DOLLAR INDEX | MONTHLY ANALYSIS#DXY has hit the strong resistance of 103 where a strong rejection candle is in formation.
For above 103, the bullish parallel channel will be active, and the upside target of 115 will be insight. But this 103 level has not crossed since 2002.
For below 103, a correction is due till 99 or maybe more than that.
On a daily timeframe, there is bearish divergence and 99 is insight.
Let us know what do you think of the idea?
Dxyshort!!!!!!!!!!!!!

DXY Dollar Index : Tighten your seatbelt, airplane in space 9.5Simple, practical, efficient.
We are looking at the highest level since March 2020.
A very smart trader once told me - Buy low, sell high.
And looking at December 2016, March 2020 - Jackpot would have been hit both occasions with a short position, with 15% down for USD on average both times.
Now let's connect that to today.
What's similar? The level it self. 103.80-104.50 is the range both times the USD came down crashing, showing strong horizontal resistance in this 5 year window.
What else? Extreme stretched MACD showing overbought condition only similar to March 2020 and December 2016.
And? RSI 14 on weekly chart shows the most stretched overbought condition since 2015, when DXY came down from 100 to 91 within weeks.
Now let's look at the other possibility , a clear breakout higher than the horizontal resistance.
This would be a breakout of a very long-term consolidation , which would mean the beginning of a new up-trend that could take the USD to highs only seen before 22 years ago and before than the mid 80's.
Is this probable considering the extreme overbought condition across big and short timeframes?
Is this probable considering the highest national debt in history by far?
Is this probable considering the tech bubble burst?
Is this probable considering the worst inflation in 40 years?
Is this probable considering the rate hike is already priced in?
And the list goes on and on.
Make an informed decision, don't buy expensive.
-----------------------------------------------------------------------------------------------------------------------------------------------------------------------------------------------------------------------------
Thank you so much for reading! If you found my idea useful please like and follow, it would mean a lot for me.
My target is to help as many traders as possible, please comment and let me know what would help you most.
I promise to respond to everyone with detail, thanks again :)
-----------------------------------------------------------------------------------------------------------------------------------------------------------------------------------------------------------------------------

DXY Dollar Index Bearish Current market structure is bearish. Creating Lower lows and lower highs. No signs of reversal yet. Will keep updated throughout the week.

DXY areas for possible sell scalpDxy is respecting this channel so far and if price corrects at these resistance it could be a good areas to scalp sell. if it breaks the channel the idea is invalidated.

DXY DOLLAR INDEX #TheCryptoCityDXY DOLLAR INDEX
The DXY (dollar index) and BTC have always had an opposite relation.
Always keep a watch on the DXY, as well as the BTC charts and price activity,
since this serves as a leading indication for predicting price swings in the crypto market.
If DXY continues to decrease, BTC + alts will finally be clear for an upside breakthrough.
When DXY shows signals of strength. on the other hand, it's preferable to de-risk some of your crypto positions.
This is an extremely good sign for #Bitcoin and #Altcoins
DXY (Dollar index) is descending slowly

DXY Chart H1Here is my view for DXY on H1. The price could go down, you can put a pending order on the Order block or find an entry on LTF within OB Zone. Trade Safe!

DXY - SHORT #DXY H4
Last setup is still valid
new Update for More Confirmation
H&S pattern Break Neckline
More Down for Next Period of Time.

$DXY looking ready to cool off.Another touch at ATH. Should cool off for a moment. Let Crypto and Stocks run a bit. Retrace to 95?

DXY DOLLAR INDEX #TheCryptoCity$DXY DOLLAR INDEX
Break down below the trendline on the 4 Hours time frame. It's getting ready to take a plunge
This is an extremely good sign for #Bitcoin and #Altcoins

DXYThe dollar index has entered the resistance range and there is a possibility of a correction to the range of 102,500.
If the dollar index can break the range downwards, a downtrend will happen.
This is my personal opinion. Please do not trade based on my analysis and data.

DXY - Complete Compression ⚠️The DXY was luring early sellers in with a compression move.
They then finally decided to complete this compression with a liquidity grab move.
Now that early sellers have been stopped out, could enough liquidity be created to make a small sell retracement?
Bear this in mind if you are trading USD pairs today traders! 🏌️♂️

CW20 DXY FORECAST IDEAThis is a DXY forecast idea by MBMG MARKETS analyst.
This is an idea, for DXY short in the coming weeks.

Bearish on DXYI am targeting those three lines . Only entering short when i see strong bearish reaction at the top

US DOLLER (DXY)Setup If Broke a 103.258 area continue the crashi
US DOLLER (DXY)Setup
US Dollar Index comes under pressure south of 104.00 ahead of key CPI
BY BULLSFX TEAM

DXY showing weakness and a reversal may be in the its futureDXY losing the 200 hma on the 1h chart and failing to get above it multiple times.
So far the PA ranging and starting to lose support indicating it might be time to reverse.
Interesting, as the CPI report gets released today and the SPX and Crypto dangling at low support levels.
Let's see what happens today.

USD INDEX(DXY)USD index likely bto fall to the zone around 102.603 or a little below it with respect to the fibonacci pattern 50>>70% which aligns perfectly with the zones and chart as seen respected 50% and so our next target is 70% whichb is a zonne and also has liquidity to be taken out

DXY: TIME for USD PULLBACKS?Hey traders, in this week we are monitoring DXY for a selling opportunity around 104 zone, once we will receive any bearish confirmation the trade will be executed.u
we highly recommend to take a look at DXY at the beginning of every trading week if not everyday, that will help you to trade USD pairs more professionally and spot their direction!
Trade safe, Joe.

2023 WORLD ECONOMY CRASHESIn 2023, we will face a major economic crash and the value of the dollar will fall sharply against other world currencies. This economic crisis may exist until 2025, but after that we will enter the era of economic prosperity in the United States.

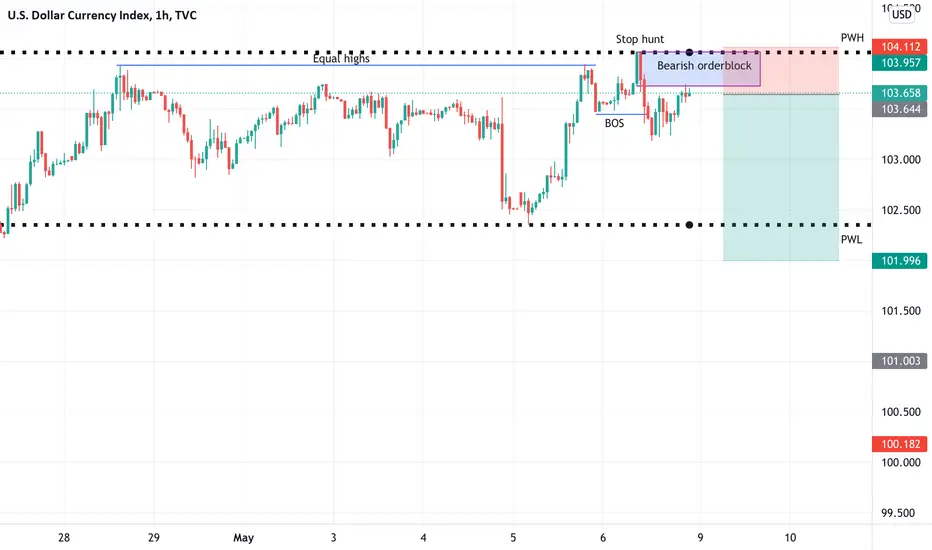
DXY Weekly Analysis ⁉️Here I expect bearish price action as we could see SH+BOS+RTO Pattern, after the price took out liquidity above equal highs and rejected from institutional figure 104.000, broke the structure and returned to bearish orderblock.
DXY fallHello Traders, I think it is time for the indicators to recover and the dollar to fall from it strongest area, even if it will continue to rise. I expect to visit 100$ before rise , the scenario is different in case it rises above 105 and remains stable above.
If you like this idea, do not forget to support with a like and follow

DXY - BREAKOUT STORYDOLLAR INDEX has once again giving a breakout from its recent high of 103.600. Recently as highlighted on the charts the breakouts remain successfuly specially after FED Hawkish View.
Will this breakout succeed ?

Jamie Trade Idea- Sell DXYTrade Idea: Selling DXY
Reasoning: Posted double top formation - looking for a move lower.
Entry Level: 102.90
Take Profit Level: 101.95
Stop Loss: 103.17
Risk/Reward: 3.52 R
Disclaimer – Signal Centre. Please be reminded – you alone are responsible for your trading – both gains and losses. There is a very high degree of risk involved in trading. The technical analysis , like all indicators, strategies, columns, articles and other features accessible on/though this site is for informational purposes only and should not be construed as investment advice by you. Your use of the technical analysis , as would also your use of all mentioned indicators, strategies, columns, articles and all other features, is entirely at your own risk and it is your sole responsibility to evaluate the accuracy, completeness and usefulness (including suitability) of the information. You should assess the risk of any trade with your financial adviser and make your own independent decision(s) regarding any tradable products which may be the subject matter of the technical analysis or any of the said indicators, strategies, columns, articles and all other features.

DXY Parabolic Rise DXY showing a parabolic rise with 4 bases formed. Currently hitting resistance of two previous highs forming a triple top. Could descend from here or make one more advance to the 106-108 area before declining into the low 90s. May depend on euro interest rates before seeing a significant decline I think.
