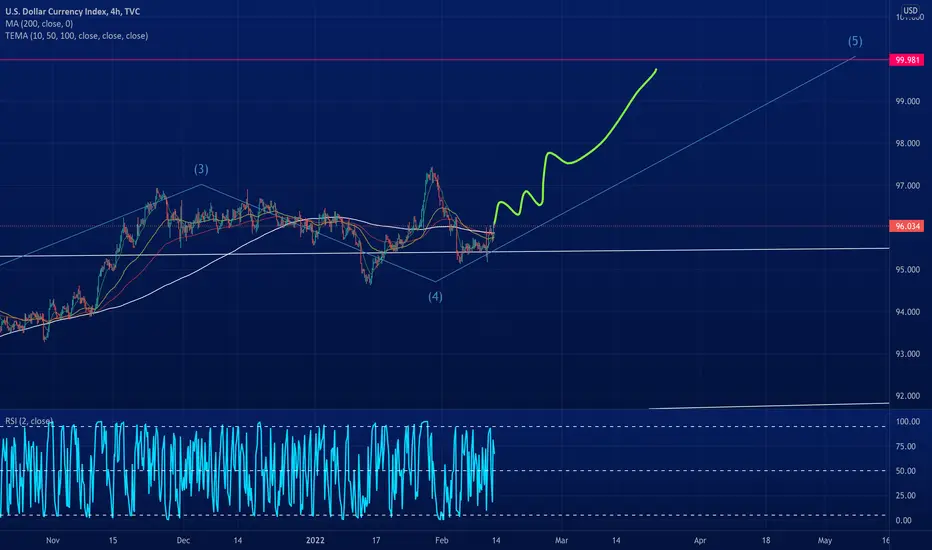
Wave 5 impulse coming for the DXY.The final impulse move is incoming for the DXY, there will be pitfalls a long the way but once it breaks the 30 Jan 2022 top, it's clear skies ahead. We want to buy every dip before it breaks the top and start selling our positions at around 100.
Dxyshort!!!!!!!!!!!!!
DXY A Great Selling Opportunity 🤨👌Trade Proposal:
There is a probability of first tp to the proposed ( 88.00 ) Direction line. So, Traders can set orders based on Price Action and expect to reach short-term goals.
Technical analysis:
DXY is in Downtrend and It is Expected to Continue Downtrend.

DXY EXPLAINED 📉📉📉🎯 DXY - USD Index
USDINDEX - The U.S. Dollar Index (USDX, DXY, DX, or, informally, the "Dixie") is an index (or measure) of the value of the United States dollar relative to a basket of foreign currencies, often referred to as a basket of U.S. trade partners' currencies, this index helps us to understand if USD is bullish or bearish on a short term or long term perspective.
🎯 DXY has two correlations one of them is positive meaning the certain assets moves like DXY and negative corelation meaning certain assets move exactly vice-versa.
✅ DXY Positive Correlations
DXY ⬆️
USDCAD ⬆️
USDJPY ⬆️
USDCHF ⬆️
USDRUB⬆️
USD XXX ⬆️
✅ DXY Negative Corelations
DXY ⬆️
EURUSD ⬇️
GBPUSD ⬇️
AUDUSD ⬇️
NZDUSD ⬇️
From a technical standpoint to have a better probability in your trades try to find entries when both DXY and for example USDCAD are in long poi (point of interest) this will increase your chance of having profits as you use inter-market correlations

DXY$DXY conclusion is we are in Wave A which is almost finished while #cryptocurrency r also in A wave up , soon B wave down to #Crypto will start with B wave up to $DXY then final c wave down to $DXY to complete wave 4 on minor TF and also C wave up to $BTC will finish.$DXY finishes W5 around $100 unless we get a truncation.
Fact is DXY remains inverted to the cryptocurrencies and can always be used as a counter indicator.

EURUSD RE-ACCUMULIATION TO CONTINUE LONG After the weekly close last week on EU I am looking for it to continue bullish off the yearly open price. Might even re-accumulate a little lower around 1.3500 big figure. I for-see a major correction coming and CPI this Thursday could be the catalyst to sustain this rally.

DXY LONGS 📉📉📉📉 Expecting bullish price action on DXY as price is being in a bullish market strucuture on a HTF premise, if price rejects 95.000 instituional figure area + bullish orderblock on d1 we will see DXY bullish way above 97.000 / 97.500 this month.
What do you think? Comment below..

it's isn't just the future of the dollar, it's about all fiats0.61 5-i=99.18
0.78 5-i=108.4
butterfly harmonic pattern:
X=68.29
3-4=0.78 X-3
4-5=0.88 3-4
0.61 5-i=99.18
0.78 5-i=108.4
0.78 4-5=85.85
0.88 4-5=82.23
0.78 X-3=78.34
0.88 X-3=73.47
1.6 4-5=60
1.27 X-3=57.35
1.6 X-3=2.24 4-5=45.9

USD INDEXHello traders. I expect the price to rise again to $ 96 after reaching the $ 94.5 range and then complete the third wave of correction. Be profitable

DXY BEARISH APPROACH Here DXY has reached to point D of a bearish Bat harmonic pattern . Showing weakness is not out of reach.

short on DXY next 3 monthsI found several reversal paterns. If DXY go down BTC will go up, as simple as that.

Still looking for that wave 5 for the DXY!We are still waiting for the wave 5 to come for the DXY, at this levels we want to wait for another dump to come before riding the price up to break the top and beyond. This dump should break 94 and even 93 before the upside comes. LFG!

DXY- Is this a double top?After reversing from the very strong confluence support at 94.50, DXY made a new high above 97.
However, what should have led to continuation proved to be a false break and we have an Evening Start candle formation which marks strong resistance.
Yesterday the index also has broken down under the ascending trend liner and now is facing support on what can very well be the neck-line of a double top.
A break under this support would give us confirmation for the pattern and could lead to further losses towards 92 support.

DXY 95.31 - 0.7 % SHORT IDEA * CONTINUATION PTTNSHEY TO EVERYONE WHO SEE THIS
HOPE EVERYONE IS DOING GOOD HAVING A GOOD
SOME OPPORTUNITIES IN THE COMING WEEK.
LOOKING AT THE DOLLAR INDEX
* From the H&S the index has been on a down trend hitting LL & HL.
* Due to the bearish momentum looking for possible continuation towards the next major support level.
* The index already broke support level pushed up for a retest, rejection from this level will be the key for this set up.
lets see how it goes
IF THIS IDEA ASSISTS IN ANY OR IF YOU LIKE THIS ONE
SMASH THAT LIKE BUTTON & LEAVE A COMMENT.
ALWAYS APPRECIATED
____________________________________________________________________________________________________________________
* Kindly follow your entry rules on entries & stops. |* Some of The idea's may be predictive yet are not financial advice or signals. | *Trading plans can change at anytime reactive to the market. | * Many stars must align with the plan before executing the trade, kindly follow your rules & RISK MANAGEMENT.
_____________________________________________________________________________________________________________________
| * ENTRY & SL -KINDLY FOLLOW YOUR RULES | * RISK-MANAGEMENT | *PERIOD - SWING TRADE

DXY | The last target to climb📍Hello traders, Dollar Index ( DXY ) in daily timeframe , this analysis has been prepared in daily timeframe but has been published for a better view in 2 day timeframe.
In the wave counting done in higher times, a leading trend is formed and from this trend, waves 4 and 5 remain.
Wave 4 was originally intended as a flat, but wave c, which we identified in the count now, did not look like a leader, and we assumed it to be a triple zigzag.
So the count has changed to triangle and from this triangle the waves a, b and c are complete and now we are inside the wave d.
From wave d, wave a continues to form.
Wave a forms its waves 1 and 2, but what is in doubt is wave 3.
Wave 3 cannot be said to be over or still ongoing.
However, according to the channel related to this wave and the latest resistance to the bottom of this channel, wave 3 will probably continue and by breaking the range, it is determined that the end of wave 3 is from wave 3 to form wave 5 and up to around 97000 to 98000 This upward trend will continue
However, if the bottom of the orange canal is broken, I will consider the 4th wave to have started.
🙏If you have an idea that helps me provide a better analysis, I will be happy to write in the comments🙏
❤️Please, support this idea with a like and comment!❤️

DXY Weekly Draw UpdateHello, Traders here's my weekly chart for the dxy updated
by the way there's a typo on the chart
meant to say a Swing low will form near the OB
I wish you all good luck and good trading.

DXY SHORTS 📉📉📉📉 On a mid-term perspective i expect bearish price action on this pair till price reaces bullish orderblock on d1 around 96.000 price takes out buy side liquidity and closes bearish on friday d1 after a huge bull run meaning bulls are losing momentum and bear are getting momentum on the london open monday morning. We will see bullish price action on XXX USD pairs and bearish on USD XXX pairs
What do you think ? Comment below..
