3.19 Gold continues to peak, waiting for the Fed's interest rateThe gold market continued to rise strongly after opening yesterday, reaching the highest point of 3038 and then consolidating at a high level, with no obvious adjustment in the middle. Although we determined that the market would surge, it was still stronger than expected. The daily line finally closed with a big positive line with a slight shadow line. After this pattern ended, the bulls in today's market are still there.
Resistance level: 3045 3050
Dxyshort!!!!!!!!!!!!!

On 3.19, gold continued to fluctuate upward after breaking throuAs a safe-haven asset, gold has attracted more buying amid global political tensions: the escalation of the conflict in the Middle East and the continued strikes by the United States against the Houthi armed forces in the Red Sea region may affect the energy supply chain. The uncertainty of the ceasefire negotiations between Russia and Ukraine has led to a high risk aversion in the market. The increase in domestic political risks in the United States may affect market confidence and push up gold demand.
The rise in gold on March 18 is in line with my thinking. Obviously, the US market was suppressed at 3028. After a short-term retracement, it further broke upward. It is expected to continue the upward trend at night and see the suppression of 3044.
The weekly and monthly lines are concerned about the upper track position, and even diverge upward under the impetus of market sentiment. The specific position cannot be determined because there is no reference point, but it is only necessary to follow the market trend to do it, and the transaction is relatively simple. From a technical perspective, the upper track of the weekly line is 3030, and the upper track of the monthly line is 3050. This is the position that needs attention. In addition, the previous two waves of rises have gone through 4 positive monthly K lines, and then closed with a negative correction.
Support level
$2994; $2982; $2950
Resistance level
$3025; $3050; $3080

3.18 Risk aversion and expectations of rate cuts support gold toIntraday data analysis:
Gold hit a new record high and maintained an upward trend. For the support below, pay attention to the upper rail of the 4-hour Bollinger band at $3010, followed by the integer position of $3000, which is also near the high point of gold prices on Monday; for the pressure above, pay attention to the upper rail of the weekly Bollinger band at $3028, which is also the upper rail position of the current 4-hour Bollinger band. If the gold price continues to break upward, the upper space can pay attention to the upper rail of the monthly Bollinger band at $2950. The 5-day moving average and the MACD indicator cross upward, and the KDJ and RSI indicators cross upward. The short-term technical side is bullish.
Gold intraday reference: Supported by risk aversion expectations and interest rate cut expectations, gold maintains an upward trend and gold prices hit a new record high. In terms of operation, it is recommended to treat it with a volatile mindset. Pay attention to the support below at $3010, followed by $3000. Pay attention to the breakthrough near $3028 for the pressure above. If it stands firm here, you can continue to pay attention to $3050.

3.18 Gold Refreshes $3,000, Be Cautious About Backtesting RisksIn 4 hours, the main trend is continuous rising and breaking rising; the main trend is anti-falling; in terms of indicators, the stochastic indicator crosses downward, mainly empty, but the pattern is anti-falling. At the same time, the MACD double lines are glued together, without crosses. Therefore, the cross of the stochastic indicator is just a correction method for 4 hours to change time for space; the horizontal support position is at the support position of 2980 and 2955.
Short-term operation: SELL: 3000
TP1: 2990
TP2: 2980
TP3: 2970
As usual, we will update regularly throughout the day and tell you how we manage active ideas and settings. Thank you for your likes, comments and attention, we are very grateful!

3.17 Technical Analysis of Gold Short-term OperationsIn the early Asian session on Monday (March 17), spot gold fluctuated at a high level and is currently trading at $2,990.02/oz. Spot gold once broke through the important $3,000 mark during trading last Friday, reaching a high of $3,004.82/oz, setting a new historical high. Investors chased this historic surge in safe-haven assets, seeking to avoid the economic uncertainty caused by US President Trump's tariff war, and then fell slightly due to profit-taking, closing at $2,988.12/oz.
Analysis of intraday gold short-term operations:
Gold is still in a three-month upward channel, and the relative strength index (RSI) on the daily chart remains around 70, indicating that the bullish tendency is still intact.
Once the gold price stabilizes above $3,000/oz (integer level, midpoint of the ascending channel) and confirms that this level is support, then $3,060/oz (upper limit of the ascending channel) may be set as the next bullish target, and the next bullish target is $3,100/oz (integer level).
On the other hand, if gold fails to turn $3,000/oz into support, technical buyers may be frustrated. In this case, $2,920/oz (20-day simple moving average, lower limit of the ascending channel) and $2,900/oz (round level, static level) may be seen as the next support level for gold
Resistance: 2998 3010 3020
Support: 2980 2965 2950

3.17 Gold short-term may extend low and longLast week, the gold market opened at 2912.9 at the beginning of the week, and then fell back at the beginning of the week. After the weekly low reached 2880, the market rose strongly due to risk aversion. After breaking the previous historical high of 2957, the market accelerated upward. On Friday, the weekly high reached 3005.2, and then the market consolidated. The weekly line finally closed at 2986.1, and the market closed with a big positive line with a lower shadow slightly longer than the upper shadow. After this pattern ended, the market continued to look at the bullish demand point after the adjustment at the beginning of the week. After the breakout of 2940 and 2958 last week, the stop loss was followed up at 2956.
Short-term operation suggestions:
SELL: 2995 target 2980 70 stop loss 10

3.14 Gold breaks through historical high to 3000Yesterday, the gold market continued the risk-averse rally and broke through the historical high. After opening at 2933.4 in the morning, the market first rose to 2947.4 and then fell back. The daily line reached a low of 2932.4 and then rose strongly. After breaking through the previous historical high of 2957 during the US trading session, the market accelerated upward. The daily line reached a high of 2989.3 and then the market consolidated. The daily line finally closed at 2988.8 and the market closed with a basically saturated big positive line. After this pattern ended, the weekly line completed the N-shaped break. Today's market reached the 3000 mark and quickly pulled back to 2988 and then came to 2997.
Short-term recommended operations:
Resistance level: 3000 3010 3020
Support level: 2995 2985 2970

3.14 Risk aversion and interest rate cuts have pushed gold to thGold is supported by risk aversion and interest rate cut expectations, and the overall trend remains upward. Short-term technical aspects also show that the advantages of the bulls have been strengthened.
On the daily chart, gold has set a new record high and performed very strongly. For the support below gold, radicals pay attention to the upper rail position of the daily and weekly Bollinger bands at $2,983, which is also the low point of the gold price falling back in the morning. Secondly, the low point of the fall after the intraday high in the US market on Thursday was $2,976. The continued fall suggests that the gold price has the risk of adjustment. Pay attention to the previous historical high of $2,956; for the pressure above gold, pay attention to the breakthrough of the integer position of $3,000. If it breaks through and stands firm here, it will not guess the top. The 5-day moving average is golden cross upward, the KDJ and RSI indicators are golden cross upward, and the MACD indicator forms a dead cross, indicating that the advantages of the bulls in the short-term technical aspect are further strengthened.
Resistance points: 2,990, 3,000, 3,010
Support points: 80, 70, 56

3.14 Gold peaks againGold is forming higher highs while forming an ascending triangle, which will be confirmed if the price of gold closes above the record high of $2,982/oz on a daily basis. If the price of gold breaks the record high, then the price of gold will target the round mark of $2,990/oz. If the buyers conquer the latter, a test of the psychological barrier of $3,000/oz will be inevitable.
The 14-day relative strength index (RSI) is moving higher above 50, supporting the case for further upside in gold prices.
On the other hand, the price of gold has strong support at the 21-day simple moving average (SMA) of $2,914/oz. If the selling pressure intensifies, the price of gold will challenge the ascending trendline support of $2,893/oz. Failure to defend this level will accelerate the decline towards the psychological level of $2,850/oz.
Resistance 2980 2990 3000
Support 2950 2930 2900
As always, we will be updating regularly throughout the day and letting you know how we are managing active ideas and settings. Thank you all for your likes, comments, and attention, we really appreciate it!

3.13 Technical analysis of gold short-term operationGold market analysis:
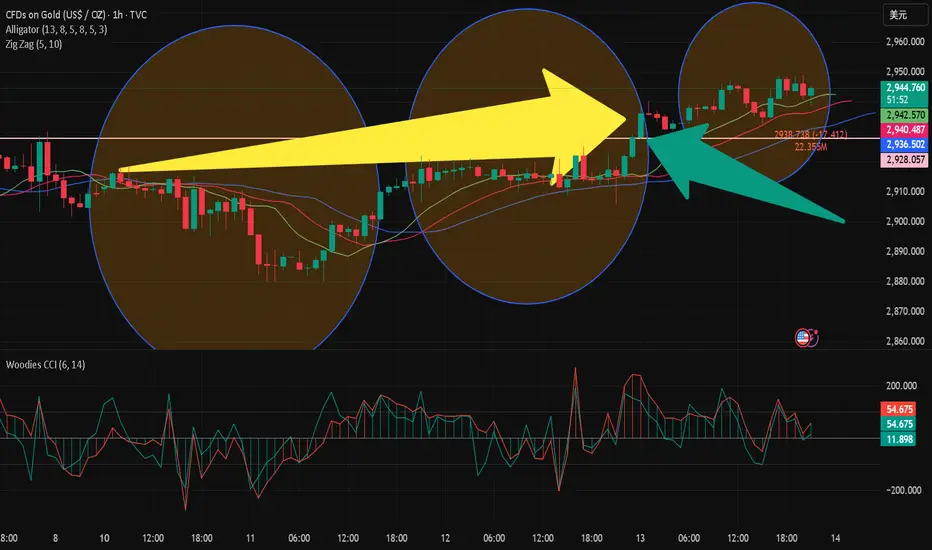
, Gold hourly level: In the morning, it rose from 2932 to 2946, and fell back to 2932 from 2946 in the afternoon. It rose from 2932 to 2948 in the European session. From the trend of the Asian and European sessions, it can be seen that it may enter a certain range of back and forth consolidation; combined with the trend of the bottom of 2880 rising to 2948, it can be found that there is a similar pattern in early March. After a short-term continuous rise, it will enter the box oscillation for several hours, and then continue to rise in a short-term continuous rise, and then continue to enter the box oscillation; then combined with the yellow channel in the above figure, pay attention to the pressure of the upper rail 2951-53 tonight. If it is suppressed, it may fall back to 2932-30 repeatedly. The lower rail support is an ideal bullish point. It will move up to 2923-25 tonight, which is also the top and bottom conversion position. If it can be touched, it is necessary to continue to follow the bullish
Resistance point l: 2945 2955 2970
Support level: 2935 2920 2900
Traders, if you like this idea or you have your own opinion about it, please write it in the comments. I will be happy
3.13 Gold surges higher againGold technical analysis
It has fluctuated continuously for two weeks in the 2890 to 2930 area. It broke through the Asian session yesterday. Then the second crazy game of the previous high formed a double top prototype structure. The global risk aversion gradually receded. The only rise was the economic recession of the United States. In fact, you think too much about global buying orders. Regardless of the recent territorial expansion speech or various taxes, or even selling cards, the purpose is to make the US dollar strong again, and hope to continue global hegemony. Therefore, it is uncertain that all kinds of speeches in the middle of the night stimulate risk aversion. Gold is constantly falling and giving you a V back every day, which is to constantly cultivate your inertia. Falling is an opportunity, and buying in batches is profit. So today is very simple. If the weakness is below 2956, it is at most 2942 to 2947, which is a direct decline, not giving you a second chance to rush high, or quickly reaching a new high, making you feel that gold is bullish again, the world is chasing more, or low-level shorts are forced to chase more hedges, then the market will change quickly.
The short-term operation ideas are as follows:
Pressure: 2955------2975 Support: 2880-----2830
Traders, if you like this idea or you have your own opinion on it, please write it in the comments. I will be happy

3.13CPI is bullish, gold cautiously rises and falls in short terThe CPI data released in the evening was lower than expected, which is bullish for gold in the short term and continues to fluctuate during the day.
In the short-term 1-hour chart, according to 4, the price has risen above the directionless 20-period SMA and 100-period SMA, while the 200-period SMA is rising below the above short-term moving averages. At the same time, technical indicators have lost directional strength and turned slightly lower within the neutral level, predicting that gold prices may fall soon.
Short-term trading: short near 2935, stop loss 2945, take profit 2920/2915

3.12 Gold shocks, waiting for CPIGold prices surged nearly 1% on Tuesday (March 11) as the dollar weakened and tariff wars triggered concerns about economic slowdown.
Gold continued to fluctuate in one hour, and gold continued to be shorted at high levels. Gold was under pressure near 2922 several times yesterday and began to fall. Gold was still under pressure at 2922 in the early trading and continued to be shorted at high levels. Gold can be shorted near 2920, but you have to pay attention today. If gold continues to resist falling, then gold may be accumulating momentum and may use data to attack. So if gold still does not fall quickly in the European session, then leave the market first and wait for data guidance.

3.12 Technical analysis of gold short-term operationGold Short-Term Technical Outlook
From a technical perspective, the daily chart of gold shows that the price of gold remains below the currently flat 20-day simple moving average (SMA), which provides dynamic resistance near $2,910.00/oz. The longer-term moving averages continue to move upwards at levels well below the current gold price, suggesting that bulls remain in control in the long term. Meanwhile, technical indicators have turned down near their mid-lines, suggesting that gold prices may extend their corrective decline before finding new buying interest.
In the near term, the price of gold is at risk of continuing its decline as seen on the 4-hour chart. The 20-period SMA and the 100-period SMA provide resistance in the $2,910/oz area, while the bullish 200-period SMA hovers around $2,867/oz, providing support. Finally, technical indicators remain in negative territory, albeit with mixed strength. However, a break below the intraday low of $2,881.80/oz on March 4 could see the price of gold fall further.
Important support and resistance levels:
Support level: $2881.80/oz; $2867.10/oz; $2854.95/oz
Resistance level: $2910.00/oz; $2927.90/oz; $2941.40/oz

3.11 Gold’s short-term signal resistance levels are mixedSpot gold rebounded slightly in the Asian session on Tuesday (March 11) and is currently trading around $2,896.52 per ounce.
The technical signals of spot gold are a bit mixed. It has successfully stabilized near the support level of $2,879 per ounce and started to rebound. The focus on the resistance near 2,915 is on the top.
Between March 4 and March 7, a temporary top was formed in the range of $2,894 to $2,927. This indicates that the target is $2,861. However, after a brief confirmation, the top became invalid as the price of gold climbed above the neckline of the pattern at $2,894.
The rebound increases the possibility of resuming the upward trend from $2,832. A breakthrough of $2,909 will be seen as a strong signal to resume the upward trend.
Before the price of gold climbs above $2,915, the price of gold may still be biased to the downside, as the current rebound may just be a correction to the top, and the correction is a bit excessive.
On the daily chart, gold is also neutral in the range of $2891 to $2934, similar to the situation on the hourly chart.
When gold moves out of the range, the signal will become clearer. The wave pattern suggests that the market may experience a small decline first, followed by a strong rebound.

3.11 Analysis of gold short-term operation suggestionsOn Monday (March 10), the latest spot gold (XAU/USD) was quoted at $2915.01, up 0.10% on the day. In the Asian session, the gold price remained in a narrow range around $2914, but since 15:25 Beijing time, gold has fluctuated downward from $2915.39, reaching a low of $2896.73.
Fundamental analysis: The Fed's interest rate meeting is approaching, and the market is cautiously watching
At present, the gold market has entered a sideways consolidation phase, and investors are evaluating multiple factors, including the Fed's upcoming policy meeting on March 19 and the latest economic statements of US President Trump. In an interview with the media, Trump said that the US economy is in a "transition" stage, and the market has generally believed that the US economy is at risk of recession.
Market sentiment and capital flows: Short-term funds are cautious, and gold is still supported
Technical analysis: Long and short divergences are increasing, key support and resistance levels
From a technical perspective, the gold price is currently consolidating around $2890. The key resistance above is the intraday high of $2918.19, followed by the intraday R1 resistance of $2927 and the R2 resistance of $2945. If the gold price breaks through $2945, the market may challenge the historical high of $2956 set on February 24.
In terms of support below, the $2900 integer mark and the S1 support level of $2893 constitute double support. If it falls below this area, the gold price may test the S2 support level of $2878. Technical analysts believe that if Trump does not release additional tariff policy signals in the near future, market sentiment may gradually stabilize, and gold may pull back to the support range in the short term to accumulate power for subsequent gains.
Conclusion: Short-term consolidation, pay attention to the dynamics of the Federal Reserve
Overall, gold is currently maintaining a range of fluctuations, and the short-term trend is subject to the expectations of the Federal Reserve meeting and the uncertainty of the US economic outlook. Investors need to focus on the interest rate meeting on March 19 and the impact of the remarks of Federal Reserve officials on market sentiment in the coming weeks. In the current context, the market still tends to look for buying opportunities in pullbacks. If the gold price remains above $2,893, the bulls will still have a certain advantage.

3.11When will gold break out of its range?Will gold continue to adjust downward after the wash, or will it break upward after this period of consolidation?
1: Trump announced on the 7th that Russia launched a fierce attack on Ukraine. In order to encourage the two sides to sit down at the negotiating table for friendly negotiations, sanctions and tariffs will be imposed on Russia, including banks, until both sides are willing to stop the exchange of fire. This has increased the uncertainty of geopolitical risks, which will be a boost for gold.
2: Fed Chairman Powell reiterated at a press conference on Friday that the current US economic performance is relatively ideal, and the Fed does not intend to rush to cut interest rates next. As we all know, interest rate cuts will stimulate gold to rise, and slowing down the pace of interest rate cuts will form resistance for gold.
Since gold entered the adjustment on February 11, the repeated high-level roller coaster shock wash has been brewing for a month, and it is time to end. The gold price has repeatedly fluctuated around $2,900, and even the non-agricultural data failed to break the support of $2,890 and the pressure of $2,930.
As for gold, the focus is still on $2890 as the support point. As long as it is not lost here, it is still mainly based on reaching the bottom of the box. For players of physical gold, it is not recommended to repeatedly get on and off the gold when the funds are idle. It seems smart but will eventually miss it perfectly.
Trading strategy:
You can consider getting on the train within the range of 2900-2895, and defend below 2880 US dollars. The focus above is on the breakthrough of the 2920-30 pressure area.

3.10 Gold short-term operation analysis and suggestionsIn early Asian trading on Monday (March 10), spot gold fluctuated in a narrow range and is currently trading around $2,912.60 per ounce. Gold prices have fluctuated at high levels for three consecutive trading days, but they still rose 1.65% on a weekly basis, helped by safe-haven inflows and the U.S. employment report showing that job growth in February was lower than expected, suggesting that the Federal Reserve is expected to cut interest rates this year. In addition, the volatile tariff policy of U.S. President Trump has also increased uncertainty.
Gold continues to fluctuate in a range, and the overall trend is in an upward trend. After the adjustment, the price of gold will continue to rise. The idea is to continue to step back on low-multiple operations. Pay attention to the 2898 support during the day. Relying on this position, short-term long, stop loss 2889, stop profit at 2922/2932. Breaking the 2932 suppression is expected to further rush to a new high.
In addition, if it falls below the support near 2889, coupled with the recent strength of the U.S. dollar, gold may fall further, so if it falls below the support, don't consider continuing to go long, pay attention to the risk.
March 10th gold short-term trading: long near 2898, stop loss 2889, take profit 2922/2932
Backup ideas: (fall below 2889, rebound to 2896 and continue to short, stop loss 2904, take profit 2880-2876)

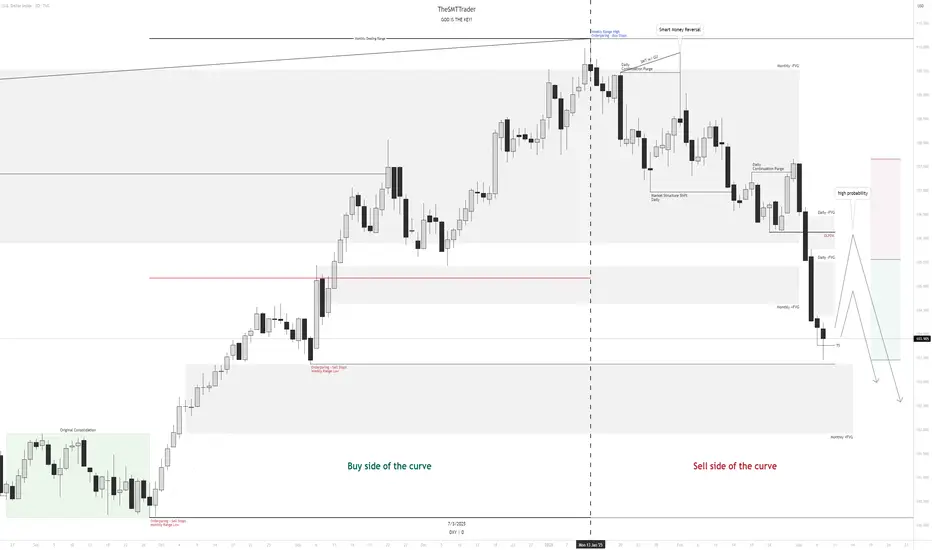
$DXY MMSMIn my view, the DXY could have a bullish bias this week, but only as a correction after last week's sharp drop. The main bias is still bearish, as we are on the sell side of the curve. Therefore, long trades should be approached with caution since the price can reverse to the downside at any moment—after all, the market is sovereign, and only it determines its movements.
I remain firmly bearish until the monthly range lows are taken out. I will only reconsider this outlook if the price holds at a high-timeframe PDA and institutional order flow (IOF) signals a potential shift in direction.
DXY will be fine (95)The dollar index expects to fall into the 95 area. Regardless of who wins tomorrow, the dollar will fall until 2025. The new government's realization of how sad everything is now will delay the process of a sound market. Vote!

Dollar idex is ready to drop next week are you ready ?This week, the market was slow with little movement. However, starting next week, keep an eye on the dollar. The order flow is showing a strong sell, and the daily chart reveals an FVG that indicates a sell from this level. Additionally, the current low aligns with the monthly FVG level. Trading next week should be exciting!

3.7 Gold short-term non-agricultural comingFundamental analysis
Tariff policy shows signs of easing, but risks have not been completely eliminated
Recently, the United States has postponed the implementation of the auto import tariff plan for Canada and Mexico, which has eased the economic and trade tensions in North America to a certain extent. However, this postponement is not indefinite. More importantly, import tariffs in other countries and regions are still in the process of being prepared or implemented, and potential uncertainties may still erupt again at any time. Driven by a series of previous tariff policy news, gold prices have repeatedly received safe-haven support. Although there is a slight correction at present, it is still near the historical relative high.
Technical analyst interpretation:
Currently, gold is fluctuating around $2,900/ounce. Overall, bullish confidence remains solid, but it also faces a large technical barrier in the short term. The following are several key observation points:
Key levels and support and resistance
Intraday key level: $2,914/ounce
If this position can be effectively broken through, it may attract more bulls to enter the market and pave the way for further impact of $2,934/ounce (R1).
R1 resistance during the day: $2934/oz
If the gold price breaks through this level, the next target will be $2950/oz (R2), and approach the historical high of $2956/oz on February 24. Once it approaches this high again, the market may experience a new round of violent fluctuations.
S1 support below: $2899/oz, coinciding with the $2900/oz mark
This area is a short-term long-short watershed. Once the shorts successfully suppress the price below $2900/oz, the bullish sentiment is vulnerable, and the risk of a short-term correction will also increase significantly. If it effectively falls below $2899/oz, the gold price may continue to fall to $2879/oz (S2), which is another possible long defensive position.
High consolidation and correction risk
From the overall market situation, the gold price has been strong since the end of last year, constantly refreshing the interim highs. However, as the market digests the Fed's expectations of rate cuts, bullish sentiment may be blunted at the current position. In addition, if the ECB or the United States' policy expectations change again, causing funds to reassess the prospects of global economic recovery and monetary policy, gold may also face certain pressure to fall from highs.
Pay attention to the operation of gold prices in the range of $2,900-2,934/ounce: If the bulls continue to fail to break upward, it is advisable to be alert to the potential correction caused by high-level profit-taking; and once the positive news is released, the possibility of gold prices quickly breaking through $2,934/ounce and heading straight to the $2,950-2,956/ounce area cannot be ignored.

3.6 Technical Analysis of Short-term Gold OperationsThe US ADP employment data for February fell sharply. The market expected 140,000, but only 70,000 were released last night, which was cut in half. This data is not surprising. Since Musk established the efficiency department at the oval table on January 20, a large number of government employees have been reduced, and the reduction in employment is reasonable.
However, the consensus is that the number of employed people will decrease, which is good for gold, and washing the market has become a routine operation. After the data was released, gold not only did not rise, but fell rapidly, all the way to $2,894, and it seemed that it was about to fall by a waterfall. At that time, I said internally that we should be careful of the double kill of longs and shorts, but it was pulled back to above $2,920 in the late trading.
In 1 hour, the US market quickly returned to the top and bottom conversion of $2,894 last night. After this retracement, it was pulled up again, indicating that the market bulls are still dominant, but the current market is still dominated by fluctuations, not a unilateral rise, so try to avoid chasing more and wait for the decline before intervening.
Today, the dividing point is still 2895-2900. We will continue to go long after the pullback. The upper target is 2920-2935 US dollars. The US dollar has begun to weaken. Gold is just in the process of brewing. The single negative on the weekly line does not form a stage top.
