3.5 Technical Analysis of Short-term Gold OperationsThe non-farm payrolls (NFP) and consumer price index (CPI) data to be released this week will be the focus of market attention. If the data is strong, especially the inflation data is higher than expected, the market may reduce the bet on the Fed to cut interest rates. The market currently expects the Fed to cut interest rates by 75 basis points this year, an increase from the 44 basis points expected last week.
Gold Technical Analysis - Daily Chart
From the daily chart, gold received support near $2,832 last Friday and rebounded to $2,900 driven by tariff concerns. However, from this time frame, market information is limited, so it is necessary to further zoom in on the analysis period to get more details.
Dxyshort!!!!!!!!!!!!!

3.5 Technical analysis of gold short-term operation Key point 25Looking back at the overall market, gold has rebounded for two consecutive days, but from the perspective of the morphological structure, it is not yet in a state of reversal. Beware of the risk of a fall after a surge.
From the perspective of the one-hour and four-hour structures, the overall trend is still in a downward trend. Although there has been a strong rebound in the past two days, the rebound is not a reversal.
Today, we need to focus on $2925, which is 680 yuan, as the dividing line between today's long and short turns. Below this area, given the rebound in the past two days, I think we can try to go south to see a fall. Refer to the 2895 or 2880 area below.
However, if the box continues to oscillate today and closes above $680 or $2925, it will bottom out and turn to long! At that time, we will adjust our thinking and look north to see new highs!
Note that the short-term market is approaching a turning point, and 2925 needs to be paid attention to.

US DOLLAR: Sell Opportunity after support breakTVC:DXY has broken below a key support zone, indicating a potential shift in momentum. The price is now retesting this zone, which previously acted as support and could serve as resistance, aligning with a potential bearish continuation.
If sellers confirm resistance at this level, the price is likely to decline further toward the 105.800 target , which aligns with a major support level. Conversely, a breakout above the zone could signal further upside.
Before considering short positions, look for bearish confirmation signals such as bearish engulfing candles, strong wicks rejecting the resistance zone, or increased selling volume.
Just my take on support and resistance zones—not financial advice. Always confirm your setups and trade with solid risk management.
Best of luck!

3.5 Technical analysis of short-term gold operationsOn the first trading day of March, the US dollar index fell sharply. Data released by ISM showed that the US ISM manufacturing index in February was 50.3, lower than the expected 50.8, and the previous value in January was 50.9. 50 is the dividing line between prosperity and recession. Although the ISM manufacturing PMI continued to expand in January, the amplitude was small and tended to stagnate. Both new orders and employment shrank. At the same time, the material purchasing price index soared to the highest level since June 2022. After the data was released, the US dollar index fell further.
Gold rebounded sharply, challenging the 10-day moving average. The 5-day and 10-day moving averages still showed a dead cross. The daily RSI rebounded and reached the key pressure zone of 2900-10 in 4 hours. The short-term trend turned to bullish, but it was still not a strong bull market. You can wait for the opportunity to stabilize and go long near 2875.

3.4 Short-term operation of gold within the dayIn February, gold closed with a long upper shadow line, the MACD indicator golden cross high volume, and the dynamic indicator SRO hooked up into the overbought area, indicating that the monthly line is still bullish. At the current monthly level, we focus on the support of the MA5 moving average and the strong support of the MA10 moving average, which correspond to 2763 and 2647 respectively.
The weekly line fell last week, including the previous day's positive column to form a negative cover, so the gold price will continue to weaken this week. The 2936-42 above the weekly line is a short-term top suppression, and the low point of last week is 2832. If it falls this week, it will definitely break the low point of last week. The current support below is the MA10 moving average near 2802, and the middle track support is 2732.
The daily line is more interesting: after the bottoming out and rebounding last Friday, the big positive pulled up yesterday; if the price continues to rebound and repair, then today's low will not exceed yesterday's low of 2857-58, and the current moving average MA60 supports near 2861. The upper pressure is at the middle track 2902-2910. The daily indicator macd is dead cross at high level and runs with large volume, and the smart indicator sto is repaired upward, which represents the daily level of shock.
The current macd is running at a low golden cross with large volume in 4 hours, and the smart indicator sto is entering the overbought area upward, which means that the current 4-hour shock is strong. At present, the upper pressure of the 4-hour is also at the intersection of the moving average MA60 and the upper track at 2913-14.
The current macd at high golden cross of the hourly line shrinks and sticks, and the smart indicator sto is repaired downward, which means that the hourly line is currently oscillating and tends to fall back. The current support is 2879, followed by 2870-58.
In summary:
During the day, we will mainly focus on yesterday's low point of 2857-58. If it is not broken, we can go long near 2867-68. In the short term, we can go long in the 2883-80 range in the Asian session, and the target is 2900-2910. The first short position is also in the 2909-20 range.
Strategy:
Go long in the 2880-83 range in the Asian session, defend 2875, and target 2890-2900-2910
Go long near 2866-68 during the day, defend 2858, and the target remains unchanged
Go short near 2909-12 during the day, defend 2918, and target 2900-2892

DXY weekly Perspective 23.02.25DXY Analysis & Bias for This Week
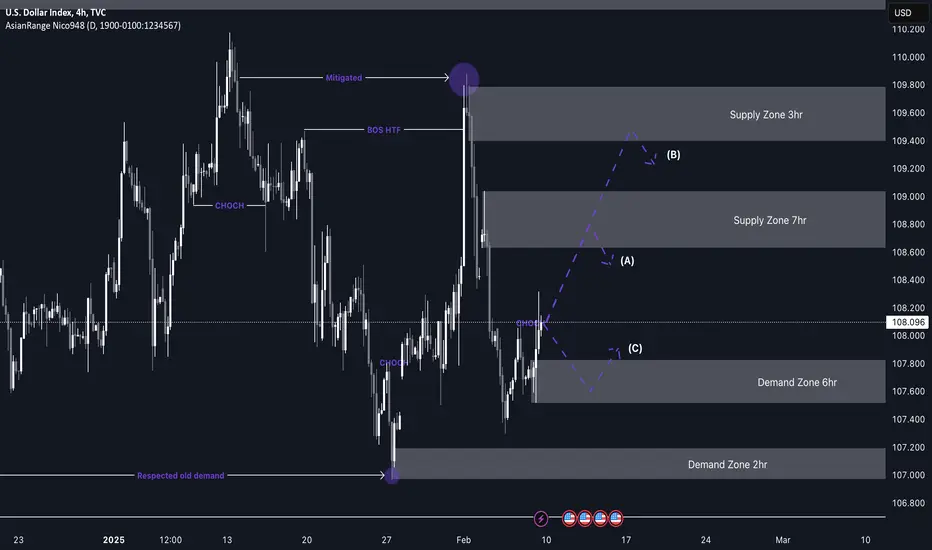
My outlook for the Dollar Index (DXY) remains bearish, which aligns with my bias for bullish moves on pairs like GU, EU, and Gold. Since price has already broken structure to the downside, I anticipate a retracement to mitigate the newly formed 14-hour supply zone before continuing lower.
While price may react bullishly from the 3-hour or 2-hour demand zones I’ve marked, the overall momentum still favors the downside, as seen from the strength of recent bearish candlesticks.
Plan of Action:
📌 Once price reaches the 14-hour supply zone, I will wait for lower timeframe confirmations before taking action.
📌 I will also check for any corresponding demand zones on my other pairs to ensure alignment across the board.

$DXY IdeaFor the DXY, we have an initial outlook of seeking internal liquidity in the discounted region of the monthly range, further reinforcing our bearish trend. Additionally, the presence of a **bottom SMT** in bonds, within a **bullish PDA**, suggests an upward movement for them.

Short swing trade set up developingI can see a good short trade opportunity developing.
1)The price sharply dropped below the major support/resistance zone around 107 area and retraced up gently within the ascending parallel channel to fill the fair value gap.
2)The current 4H candle is moving below the bottom parallel channel. (developing)
3) MACD is in the bear zone and it looks like it is about to cross to the downside (but not confirmed).
4) RSI is also in the bear zone and it is starting to cross to the downside.

DXY Weekly BiasMy bias for this index is bearish and the price might target the Sellside Liquidity at 105.4. My Optimum Trade Entry would be around the 107.28 Zone.

$BTC.D and $DXY are in diametrically opposite directionsIn this blog space we have been discussing Bitcoin Dominance ( CRYPTOCAP:BTC.D ) since Dec 2024. On 9th Feb 2025 I posted a blog where we discussed the Fib Retracement levels in CRYPTOCAP:BTC.D chart and we said that we can expect more upside and has broken past 0.618. I said it is possible that the dominance can reach the 0.786 Fib level at 66.12%.
I tried to plot the Dollar index TVC:DXY in the same weekly chart as CRYPTOCAP:BTC.D and it was quite surprising that the FIB retracement levels in CRYPTOCAP:BTC.D are the same as the top to the bottom levels in the TVC:DXY chart. We are looking at the last 5 years for our analysis.
When CRYPTOCAP:BTC.D has broken past 0.618 Fib level and trying to reach 0.786 @66.12%. But the TVC:DXY has broken below 0.786 and in the near term the TVC:DXY level can end up at 0.618 Fib levels which can take TVC:DXY to 104.
So, in the near to medium term is CRYPTOCAP:BTC.D @ 66.12% and TVC:DXY @ 104.

Scenario on DXY 13.2.2025I would see the dollar index like this if I was considering going short I would first consider going above the monthly level of 108.048 if the market continued then I have one more SFP at a price around 108.6 if I was going to talk about a long position then first around the monthly level of 107.053 then the next one below the daily level of 106.724.

#DXY 1DAYDXY (1D Timeframe) Analysis
Market Structure:
The price has broken below the uptrend support, signaling a potential shift from bullish to bearish momentum. This breakdown indicates that buyers were unable to sustain the upward trend, leading to increased selling pressure. Additionally, a sell engulfing candlestick has formed, further confirming bearish sentiment.
Forecast:
A sell opportunity is expected as the breakdown of uptrend support and the sell engulfing pattern suggest further downside movement.
Key Levels to Watch:
- Entry Zone: After a confirmed breakdown and possible retest of the broken support as resistance.
- Risk Management:
- Stop Loss: Placed above the broken support or recent swing high.
- Take Profit: Target lower support zones for potential downside movement.
Market Sentiment:
The combination of the uptrend support breakdown and a sell engulfing pattern indicates that bearish momentum is increasing. Waiting for confirmation of continued selling pressure will help align with the prevailing market trend.

DXY Weekly BiasMy bias for this index is bearish considering that we retested and confirmed the Weekly Bearish Order Block at 109.65.
I do anticipate that the index might be attracted towards Sellside Liquidity at 107.27, 106.95 ,and 105.4.
Our daily setup will further give us the best entry and stop loss.

DXY (Dollar index) short from 108.800My DXY analysis aligns with the expectation of a bearish move, which suggests that my pairs—EU and GU—could push higher. However, before that, we may see a minor pullback as price moves toward a demand zone.
Price has recently broken structure to the upside, leaving behind a fresh demand level. Once price reaches this area, I anticipate accumulation before a potential move upward. I will look for opportunities to capitalize on this movement across the pairs I trade, such as Gold, EU, and GU.
The price action has been very clean so far, which is promising, and we can expect more of the same as we move further into Q1.
Have a great week ahead and remain vigilant!
$DXY MMSMGiven the current scenario, we maintain a bias toward the continuation of the DXY's decline, as it exhibits MMSM characteristics. Additionally, bonds have invalidated a bearish FVG on the daily timeframe after holding at a bullish PDA in discount. However, caution is essential, as we cannot ignore President Trump's statements, which are shaking the market and completely disrupting our bias

DXY - "Pullback or Breakdown? Key Levels to Watch!"📉 Price Action Update: Key Levels to Watch
Currently, the price is trading within the 108 – 107.800 range. There are two potential scenarios to anticipate:
1️⃣ If the price continues to decline, we could see a drop toward 106.950.
2️⃣ Alternatively, a pullback from 108 could push the price toward 108.500 – 108.700 before resuming its downside move.
This analysis is based on DXY's price action on February 3rd, where it faced monthly timeframe resistance. Such a significant resistance level often leads to a short-term downtrend, especially on lower timeframes like the 1-hour chart.
📊 Stay alert to price reactions at these key levels! 🚀

Dollar for the Week of 13 JanuaryBearish Dollar because it hit already the W OB and it's inside the W SIBI, so it take also a liquidity from second January's high.
We can wait a retracement lower for Dollar, it means all major pairs can be higher.

Bearish drop?US Dollar Index (DXY) is rising towards the pivot and could reverse to the 1st support.
Pivot: 109.59
1st Support: 107.46
1st Resistance: 111.96
Risk Warning:
Trading Forex and CFDs carries a high level of risk to your capital and you should only trade with money you can afford to lose. Trading Forex and CFDs may not be suitable for all investors, so please ensure that you fully understand the risks involved and seek independent advice if necessary.
Disclaimer:
The above opinions given constitute general market commentary, and do not constitute the opinion or advice of IC Markets or any form of personal or investment advice.
Any opinions, news, research, analyses, prices, other information, or links to third-party sites contained on this website are provided on an "as-is" basis, are intended only to be informative, is not an advice nor a recommendation, nor research, or a record of our trading prices, or an offer of, or solicitation for a transaction in any financial instrument and thus should not be treated as such. The information provided does not involve any specific investment objectives, financial situation and needs of any specific person who may receive it. Please be aware, that past performance is not a reliable indicator of future performance and/or results. Past Performance or Forward-looking scenarios based upon the reasonable beliefs of the third-party provider are not a guarantee of future performance. Actual results may differ materially from those anticipated in forward-looking or past performance statements. IC Markets makes no representation or warranty and assumes no liability as to the accuracy or completeness of the information provided, nor any loss arising from any investment based on a recommendation, forecast or any information supplied by any third-party.

DXY next year.i told yall I am bullish, yes i'm still bullish. Here's what I think might be happen to DXY, be flexible to other pairs

#DXY 1DAYDXY Daily Analysis
The DXY (US Dollar Index) is trading near a trendline resistance on the daily chart. This resistance is a critical level where selling pressure may dominate. A breakdown below the nearby support line would confirm bearish momentum, offering a strong sell opportunity for further downside.
Technical Outlook:
Pattern: Trendline Resistance
Forecast: SELL (Sell Opportunity upon Support Breakdown)
Entry Strategy: Enter a sell position once the price breaks below the support line and confirms the breakdown with bearish price action, such as a strong close below the support or a retest of the broken level as resistance.
Traders should watch indicators like RSI for overbought conditions or MACD for a bearish crossover. Use proper risk management by placing stop-loss orders above the trendline and setting profit targets at subsequent key support zones.

Analyzing DXY: Key Clues for USD Pair Trading Opportunities👀👉 In this video, we dive into the DXY index and analyze its bearish break of market structure on the 4-hour chart, highlighting the mounting pressure on the dollar. We discuss the importance of monitoring price action through the London session into the New York open, waiting for potential liquidity runs and pullbacks before the daily or weekly trend emerges. Learn how the DXY provides vital clues for trading correlated and inversely correlated currency pairs, unlocking potential opportunities across the forex market. Don’t miss these key insights to stay ahead in your trading! Not financial advice.📊✅

Shorting the Dollar: A Madman's GameI’m going to take this trade—it's close enough to the level where it would invalidate my idea. I may tighten my stops a bit, but I’m okay with taking a second shot later if I get stopped out.
The Dollar is indeed strong right now, so I’m going against the trend here. I’ll be aggressively taking profits if it dips a bit. If we push past 106.75, I might consider shorting it.
This price action is looking very similar to the July-September 2023 move.
TVC:DXY

Analysis of the U.S. Dollar Index (DXY)Technical Analysis
Monthly Chart:
Since January 2023, the DXY has been moving within a range. The upper boundary of this range was marked by the 107.348 level, which has now been cleared. This breach of the previous high suggests that liquidity above the range has been taken, signaling the potential for a downside move. Historically, such liquidity grabs often precede significant reversals, aligning with the current bearish setup.
Daily Chart:
On the daily timeframe, the DXY displayed a sharp decline after taking out its last significant high. This aggressive sell-off has formed a strong bearish pattern, indicating a potential continuation to the downside. The presence of strong bearish momentum highlights sellers' dominance in the current market conditions, reinforcing the bearish outlook initiated by the liquidity grab on the monthly chart.
Price Targets:
Short-Term Target: A move toward 104.636 is expected as the DXY continues its bearish momentum, which aligns with immediate support and prior structural lows.
Medium-to-Long-Term Target: If the bearish trajectory persists, the DXY could reach the 101.917 level, which aligns with a significant support zone from previous price action. This target reflects the potential for extended downside in a broader bearish scenario.
Fundamental Analysis
Federal Reserve and Interest Rates:
Recent minutes from the Federal Reserve highlight concerns about continuing rate cuts due to the potential risks they pose to inflation. The Fed has signaled that further rate reductions would only be considered if both the labor market weakens and inflation continues to decline. However, these two factors are closely intertwined.
Labor Market Conditions:
Historically, the months of November and December exhibit strong employment trends due to holiday hiring. This seasonality reduces the likelihood of immediate rate cuts, as a robust labor market typically does not align with the conditions necessary for easing monetary policy.
Inflation Outlook:
For the Fed to proceed with aggressive rate cuts, inflation figures would need to remain stable or show further declines. If unemployment rises and inflation remains under control, the Fed may have room for another round of cuts. Such a scenario would support a long-term bearish outlook for the DXY, as lower interest rates reduce demand for the U.S. dollar.
Summary and Outlook
Technically, the DXY is positioned for further downside following the liquidity grab above the 107.348 level and the subsequent bearish pattern on the daily chart. Fundamentally, while seasonal strength in the labor market may delay immediate bearish moves, the broader macroeconomic context suggests that eventual rate cuts are likely.
Key factors to monitor include:
Unemployment data in the coming months.
Inflation trends to confirm stability or further declines.
Any changes in the Fed’s tone regarding rate policy.
Price Expectations:
In the short term, we could see the DXY reach 104.636, reflecting a retracement toward a key support zone.
In the medium to long term, the DXY is likely to target 101.917, aligning with major support from prior price structures and further confirming the bearish outlook.
If unemployment begins to rise and inflation remains under control, these targets become even more probable, reinforcing the alignment between technical and fundamental factors.
