DXY Breakthrough Tripple bottomBreakthrough Tripple bottom confirmed
Dedicated to related idea 9 mothes ago
Attached below
Dxyshort


Dollar Weakens After FED AnnouncementsAs of now, the FED interest rate decision has been announced and the FED has kept the interest rate constant. In addition to keeping it steady, Powell still made harsh and hawkish statements. Personally, I have question marks in my mind about how full these explanations are. Because now the job is not just to reduce inflation and most business sectors have started to break. I don't think it can go on like this.
If we are talking about interest rates, the only factor we need to look at is the dollar index. The dollar index has technically formed a descending triangle. The level to be seen in a down break will be $ 98.

DXY OutlookThere are endless reasons why DXY will get rejected strongly. I have explained some of them here. We can expect Bitcoin to hit 300K.

DXY index Road Map🗺️!!!(4-hour time frame⏰)DXY index managed to break the 🟢 support zone($102.24-$101.91) 🟢 and support line during the last day.
Based on the theory of Elliott waves, the DXY indicator is completing a corrective Zigzag structure(ABC/5-3-5) .
🔔I expect the main wave C to finish at the 🟢 heavy support zone($101.30-$100.82) 🟢.
U.S.Dollar Currency Index ( DXYUSD ) Analyze, 4-hour time frame⏰.
Do not forget to put Stop loss for your positions (For every position you want to open).
Please follow your strategy, this is just my Idea, and I will be glad to see your ideas in this post.
Please do not forget the ✅' like '✅ button 🙏😊 & Share it with your friends; thanks, and Trade safe.

What the DXY's Price Means for BitcoinTLDR:
* There is an inverse correlation between the DXY and Bitcoin.
* Each percentage drop in the DXY could potentially cause a 5% increase In Bitcoin’s price (highly speculative, don’t call the Lambo sales office, yet).
* If this month’s inflation numbers will be below expectations, it could send the DXY below the 101.37 level and kickstart a mini bull run.
The Inverse Correlation between the DXY and BTC
* I am analyzing the DXY because of its inverse correlation with Bitcoin. My premise is that if the DXY loses the 100.37 support, it could push Bitcoin and the crypto market higher.
For example:
* On March 16th, 2020, the DXY tested the 100.37 level as resistance and began a 41-week (287 days) downtrend. The DXY’s drop was the signal for Bitcoin to begin the 2020 bull run.
* On the whole, between March 16th, 2020, and January 4th, 2021, the DXY lost 14% value while Bitcoin in the same period, went up by 845%.
Meaning that for every 1 percent the DXY lost, Bitcoin went up 60%
A more recent example:
* Between September 26th, 2022, until the 10th of April 2023, the DXY lost 12.4% of its value. * Bitcoin, during the same period, gained 69.35%.
Meaning that for every 1 percent the DXY lost Bitcoin went up 5.6%.
* These examples are only meant to illustrate the inverse correlation between the DXY and Bitcoin. I do not claim that correlation equals causation, nor do I claim that the DXY is the only influencing factor on Bitcoin’s price. Regardless, it is clear that if the Dollar index goes down, it is positive for the Bitcoin price.
DXY Analysis:
* The DXY is in a downtrend since September 22nd, 2022. This downtrend is forming a Descending Triangle. The 100.37 level is the Triangle’s support level. I am assuming that a drop below this level will hurt the DXY and could push Bitcoin into a mini-bull run. As far as the DXY is concerned it is 1.5% shy of disaster.
* Furthermore, the Non-Farm Payroll numbers published on July 7th caused a 0.9% drop in the DXY’s price but had no lasting effect on BTC’s price. I think that maybe, the Forex market is a more accurate gauge of Bitcoin’s Future prospects than we, in crypto, realize.
Conclusion:
* This is just scratching the surface, but enough for now. The DXY is in a downtrend and even if we assume that the rate hikes aren’t finished yet, the end is near. If this month’s inflation numbers will be lower than expected, I think the dollar is finished.
* If this month’s inflation numbers will be higher than expected then I assume that bitcoin will continue to chop in a range between 25K – 30K.

DXY Potential To DownsideIt will be interesting to see conditions at the beginning of next week. If the movement cannot be broken at the 101.30 area, it is possible that the movement will experience a correction first. Even though the potential on the target could still be in the area of 98.

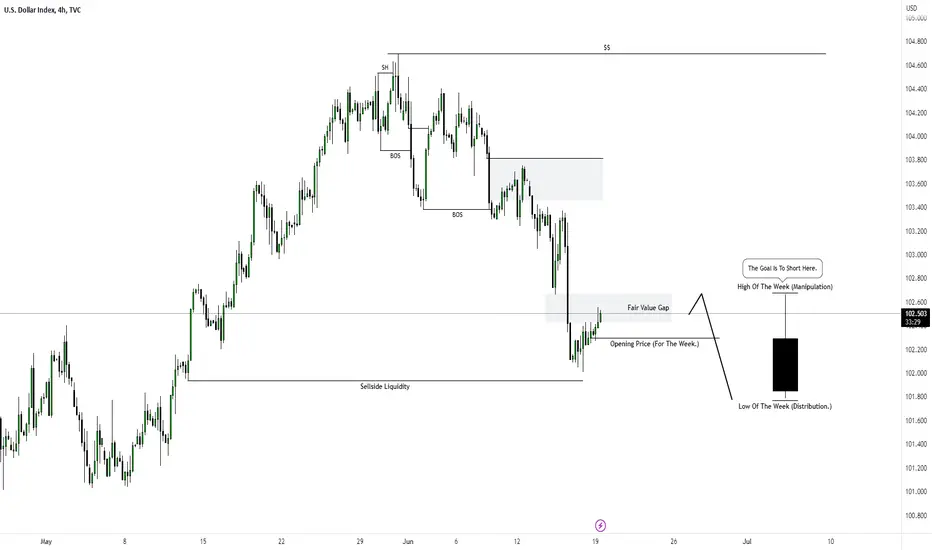
DXY Weekly Analysis - Bearish DrawThe Dollar Index is showing clear signs of wanting to reach lower.
A trade entry can be found within the previous week's range.
In order of Draw on Liquidity:
1. Weekly Low.
2. Weekly +OB
3. Weekly + OB MT
4. New Lows
- R2F


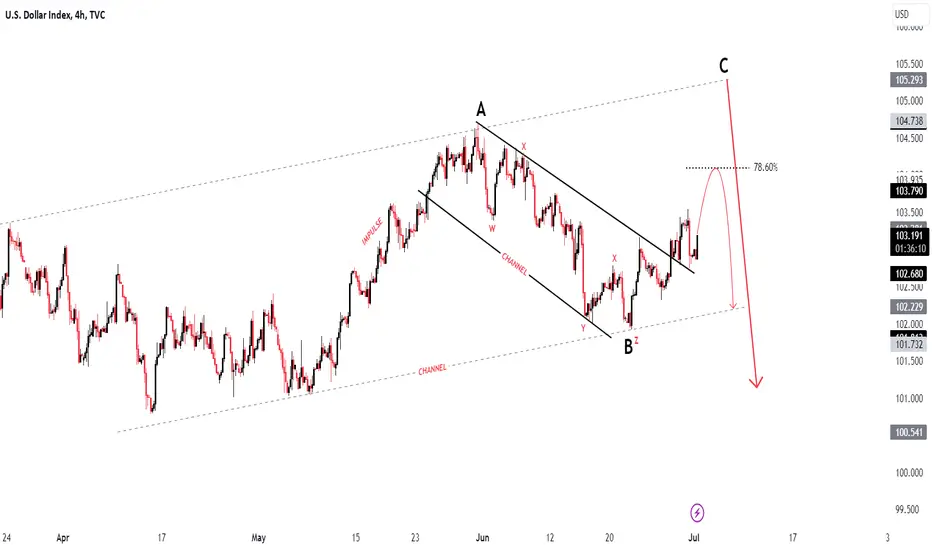
$dxy #dxy #elliottwave short wave c 3jul23This count is based on my assumptions so anything can happen not a trading or financial advice just for educational purposes only kindly do your own ta thanks trade with care good luck.

DXY Index Next Possible MovePair : DXY ( U.S Dollar ) Index
Description :
Bullish Channel as an Corrective Pattern in Long Time Frame
Completed " ABC " Corrective Wave
Divergence - RSI
Break of Structure
Impulse Correction
Fibonacci Level - 78.60%
$dxy #dxy #elliottwave short 22jun2023This count is based on my assumptions so anything can happen not a trading or financial advice just for educational purposes only kindly do your own ta thanks trade with care good luck.

The only Indicator you'll EVER NEED!!!!!!!The TVC:DXY works like a see saw...
When one side goes up: the other side goes down: specifically US PAIR$
This Objective Market Wi BME:DOM will lead you to the land f pips and money IF you to the process of UNLEARNING EVERYTHING taught you about trading.
Never over leverage.
Trust your narrative for it is the GPS to the prize!
Have a Great day of trading Family!
My MENTORSHIP is open for another 24hours if you are interested!

US Dollar Index - Looking To Sell Pullbacks In The Short TermH4 - Bearish trend pattern.
Currently it looks like a pullback is happening.
Until the two strong resistance zones hold my short term view remains bearish here.

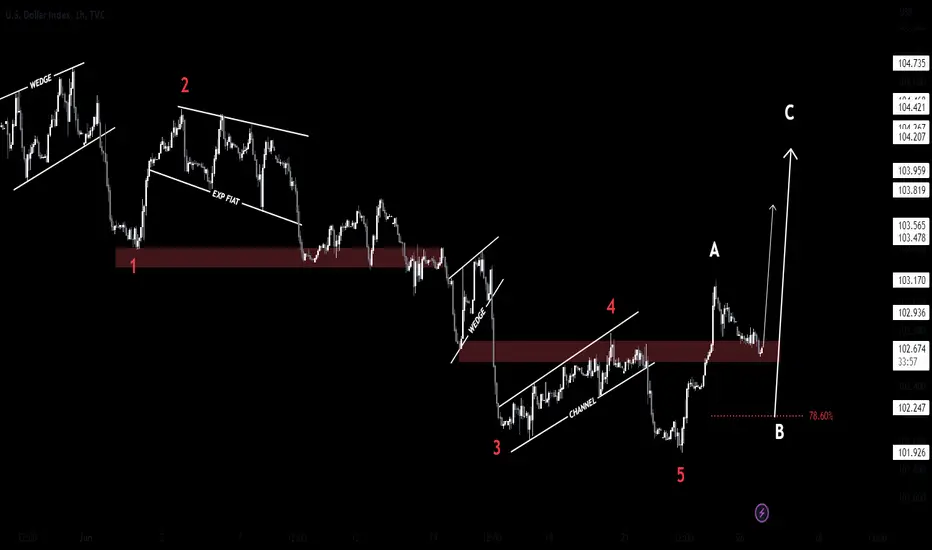
DXY Index New Week Possible MovePair : DXY Index
Description :
Completed " 12345 " Impulsive Wave and " A " Corrective Wave
Demand Zone
Break of Structure
Bearish Channel as an Correction in STF
RSI - Divergence
DXY will go DOWN to the next support zoneThe DXY index managed to break the 🟢 support zone ($ 103.6-$ 103.35) 🟢 and has now completed its pullback.
Also, DXY seems to have broken the support line with a bearish marubozu candle , and this is a sign for DXY to start falling again, at least until the next 🟢 support zone ($ 102.86-$ 102.66) 🟢.
U.S.Dollar Currency Index ( DXYUSD ) Analyze, 2-hour time frame⏰.
Do not forget to put Stop loss for your positions (For every position you want to open).
Please follow your strategy, this is just my Idea, and I will be glad to see your ideas in this post.
Please do not forget the ✅' like '✅ button 🙏😊 & Share it with your friends; thanks, and Trade safe.

20 Reasons For Sell DXY 🔆MULTI-TIME FRAME TOP-DOWN ANALYSIS OVERVIEW☀️
1:✨Eagle eye: The 12-month timeframe shows a clear bearish structure with the formation of a 3rd higher low (HL), indicating a continuation of the bearish move. The overall big picture is not favorable for the dollar. Last year, there was a large wick candle with a tap of the ultimate high order block.
2:📆Monthly: Currently, there is a clear bullish trend, but there is a visible consolidation (choch) on the monthly timeframe. A high volume candle at the top is followed by an inside doji and a fall in price. The price has been consolidating for the past 5 months, but there is potential for further downside towards the recent order block around 98.00, which can be a profit booking area.
3:📅Weekly: The price has confirmed a valid high and formed an internal consolidation (choch), but the low is yet to be confirmed. Based on the bigger picture, we anticipate further downside moves until the 100 area. We should hold our sell positions until the price taps the order block area at 100. A corrective move is expected once it reaches that level.
4:🕛Daily: The daily timeframe shows a bearish structure with potential for further lows. The last low is still protected, but given the bearish trend, there is a high chance that bears can push the price towards the 100 level during the current impulsive move.
😇7 Dimension analysis
🟢 analysis time frame: Daily
5: 1 Price Structure: Bearish
6: 2 Pattern Candle Chart: A window (gap) is present, which can act as a Continuation In Pattern (CIP). Additionally, a descending triangle is putting downward pressure on the price.
7: 3 Volume: Volume increases during bearish moves, indicating more selling pressure. Until the market gives a clear signal, it is not advisable to consider buying at any level.
8: 4 Momentum UNCONVENTIONAL Rsi: The market has lost momentum, but it is not yet strongly in favor of the bears. A strong rejection at the window area or resistance at the 60 level is needed for price confirmation.
9: 5 Volatility measure Bollinger bands: After a big volatile move, the price needs to calm down and may enter a period of consolidation or make a minor correction towards the 20-day moving average before continuing its downside move towards the target.
10: 6 Strength ADX: The ADX indicates a sideways trend at this point.
11: 7 Sentiment ROC: There is no strength in the sentiment ROC.
✔️ Entry Time Frame: H1
12: Entry TF Structure: After a strong bearish trend, there is a consolidation (choch) pattern forming. Upon closer observation, the daily window, extreme order block, and structure high coincide at the same point, making it a strong supply area or rejection point. We will place a sell order when a strong signal is formed.
13: Entry Move: The entry move must be impulsive.
14: Support Resistance Base: Daily window, extreme order block, structure high.
15: FIB: Trigger event done based on H1 timeframe.
☑️ Final comments: Open sell entries at the market opening, and if the price goes further up near the window, consider a second sell entry. A third sell entry can be placed if the market creates an internal Breakout-Sell (BOS) signal.
16: 💡Decision: Sell
17: 🚀Entry: Sell between 102.885 and 102.2
18: ✋Stop Loss: 103.175
19: 🎯Take Profit: 1st target at 100.5, 2nd target at 99.5
20: 😊Risk to Reward Ratio: 1:4
🕛 Expected Duration: 10 days

$dxy #dxy #elliottwave short 19jun2023This count is based on my assumptions so anything can happen not a trading or financial advice just for educational purposes only kindly do your own ta thanks trade with care good luck.

DXY Index Next Possible MovePair : DXY Index
Description :
Bullish Channel as an Correction in Short Time Frame with the Breakout of the Lower Trend Line and Retracement
Break of Structure
S / R Level
RSI - Divergence

DXY: The power of the economy!Mr. Biden revived the industry to compete with China, but this intervention could put the US economy and its allies at risk, according to the WSJ.
Jake Sullivan, President Joe Biden's national security adviser, is often preoccupied with foreign threats, such as the Ukraine conflict. But in April, in a speech at the Brookings Institution, he addressed the threat from within, of the long-held view of Washington elites that "the market has always allocated capital efficiently. and perfomance".
Some in policy circles call this view neoliberalism, or free trade, which has been bipartisan for decades. But Sullivan argues, this doctrine has emptied America's industrial base, weakened the middle class and made the country more vulnerable to climate change, Covid-19 and the weaponization of its supply chains. hostile countries.
To solve it, he said that the US needs a new approach, a "modern industrial strategy". Accordingly, the government supports stronger investment in industry and commerce to strengthen the middle class and national security.
Since the 2020 election, Mr. Biden has tried to come up with a unified theory for his economic policies. And Sullivan's recent remarks on the White House's domestic and foreign goals toward China have more clearly depicted what could be called "Bidenomics," with three pillars. With that comes some blind spots and contradictions in this economic policy, according to the WSJ.

DXY SHALL WE!!!Honestly, this move depends on the CPI data today and FOMC tomorrow
Still think no matter what we will be going back to 101

BRICS Movement Causing The downfall of usdso from my previous analysis my dxy analysis was accurate, however, I'm looking at a short on dxy, brics has now become ar active movement on the abolishing of using USD as form of currency, this means that the dollar index will fall

DXYThis The Continued Analysis Of My View On The Dollar Index, This Is The 4 Hour Time Frame And That's What I Anticipate To See Pan Out This Week On The DXY.