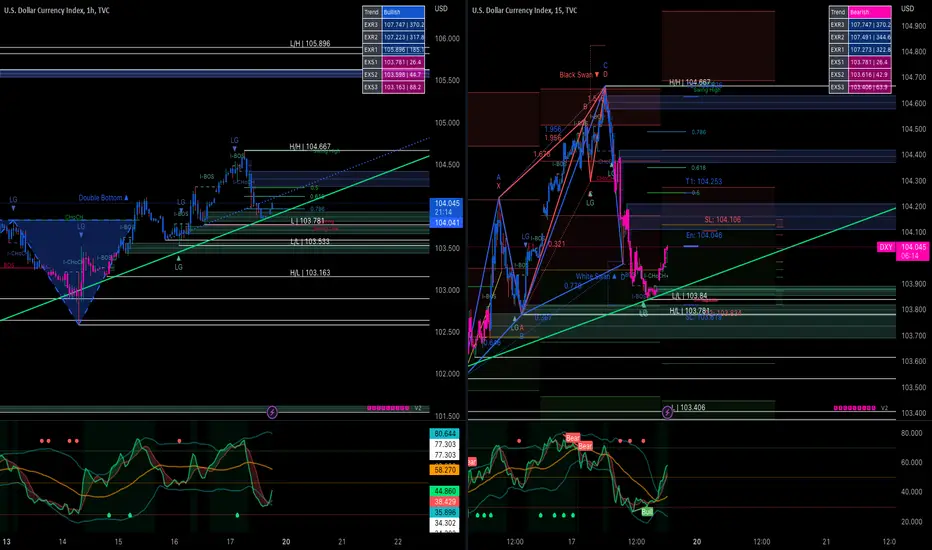
Sell DXYConfirmation
• Buy side liquidity taken out ✔️
• Break in Market structure ✔️
Entry
• At Fair Value Gap ✔️
• Newyork Killzone ✔️
Dxyshort

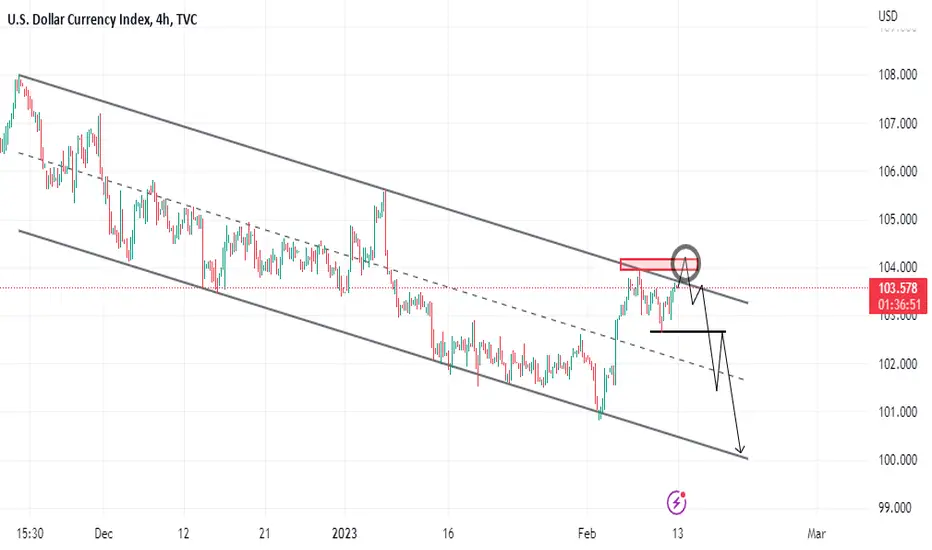
DXY might go down!As it is shown in the 4h chart; there is a regular divergence in between the chart and MACD indicator
Therefore we could expect a fall down in the price!
.
What do you think of DXY?

USD Index Targets 104.820 After US Federal Reserve Meeting?We have learned that almost all US Federal Reserve officials backed a 25-basis-points rate hike at the last FOMC meeting held on January 31 to February 1.
Only a few officials favored a larger 50-basis-points hike at the meeting or said they "could have supported" it. Even so, many more dovish sentences were spoken in the latest meeting than compared to the December meeting. Although, officials did not go as far to consider a pause in rate hikes. The only time this topic was broached was in reference to foreign central banks and their potential strategies.
Of course, the meetings also showed the obligatory note that, although the rate hikes have started to ease inflationary pressure, officials agreed that there was much more work to do to get inflation under control and were definitely aware of the risk of not doing enough, so the drip of dovish language will likely continue for some time before a dovish outlook overtakes a hawkish. Especially, because the meeting took place before the release of the hotter-than-expected jobs and retail sales data from January. This might go some way in supporting the USD in the short to medium term.
Looking at the DXY after the release of the minutes, it looks to have helped the USD index push into the mid 104s, where it is encountering some resistance. The index only has to break into 104.700 to eclipse its recent one week high and return to its month high. A target above this range could include 104.820, which aligns with the 200-EMA and some peaks reached in January.

EXPECT STRENGTH IN DOLLAR PAIRSI spotted a bullish flag chart pattern and a fake out on Dollar index. once dollar index is bullish expect other dollar pairs to gain strength, like: EURUSD, AUDUSD, GBPUSD, XAUUSD, USDJPY, NZDUSD etc.. currently I'm short in EURUSD and USDJPY I'm in long position. Please becareful, reduce your position percentage when trading correlated pairs.

dxy bulls pulling up for a little bit the 1hr dxy is still bullish and creating hh and hl right at that last bullish ob if 103.800 level is one to watch and also the last higher high level watch it as well dxy still looking bullish to me
$DXY JUST REJECTED AT A 600-DAY RESISTANCEThe $DXY just rejected off of a 600-day resistance, as expected. This rejection should initiate a violent move up in stocks and crypto.
Here's the trend lasting approximately 600 days, with multiple touch points.
And here's the initial break of the rejection.
More on this during today's show. Link in signature...

Intraday Trading Sell DXY & Profit 1: 2 (17 FEB 2023)DXY intraday trading alert
3 simple steps to find a quality setup !
Risk Reward Ratio 1: 2
Anyone same idea with me?
SELL DXY
Good luck traders..

Sell DXY!Confirmation
• Buy side liquidity taken out ✔️
• Break in Market structure ✔️
Entry
• At Fair Value Gap ✔️
• At Premium ✔️
• Above midnight open ✔️
Target
• Around 103.300🎯

dxy short update As I mentioned in the previous analysis, the dollar moved towards the specified areas with the release of the CPI news...and according to the analysis, it started its down movement.

My view for the dollar index and todays New York sessionI have a bearish view on the dollar index from specified levels

Bears surrounded the DXYAfter given breakout from the parallel bearish channel, DXY has found it self in heavy waters as it struggles to close above MA50 and subsequent horizontal resistance line. It is likely that DXY will retest lower support lines as hidden bearish divergence is also evident.

DXY ABCD Bearish Pattern This is just An IDEA .
In DXY H1 Timeframe have ABCD BEARISH Pattern GREEN LINES are Targets for TP.
Have GREAT DAYS IN week.

DXY Setting up For News 01/12/2023
information shared is for educational and demo purposed only, trading is risky and you can loose 100% of your trading capital

DXY IS BACKIm expecting 103.735 for sell side..This is only reaccumulation of dollar index.
Buy side 101 for SMC traders.
Trade base on your own decissions.
Come and check me out for more.

dxy sell limit orderdxy sell signal
It is located in the range of the ceiling of the descending channel and it seems that it will fall to the bottom of the channel after reaching the limit of losses
DXY Rejection at the resistance trendlineUS Dollars TVC:DXY is back at the resistance trendline, after some momentum move in the past few days. I expect a rejection at this level which would bring the price down.
However if price breaks through the resistance and closes above the trendline, i will conclude that the downtrend season is over and price will continue rally to the upside.
But my bias is a short if price is rejected at this zone

LONG EURUSD with target 400 pips the EURO is in uptrend and we have 50% correction from last wave
so we will long EURUSD at current price
SL 1.06
TP 1.12
Good luck traders

DXY LONG PLAY 06-02-23 (H1)
The weekly close was very bullish, this is my first target next week. I am targeting the daily FVG and equilibrium of the FVG. My long-term play is the weekly volume imbalance as it has been for a few weeks but it may take months to play out.


Bearish retest possibilityOne can only assume a trend continues until it doesn't. After the dixie ran the lows I therefore am expecting a bearish retest. A support held above retest zone should lead to continuation of bullish price action. I am targetting the 97 levels as support.


Drawing supply and demand areas and possible scenarioDrawing supply and demand areas and possible scenario Drawing supply and demand areas and possible scenario Drawing supply and demand areas and possible scenario Drawing supply and demand areas and possible scenario
