Bullish bounce?US Dollar Index (DXY) has reacted off the pivot which is a pullback support and could drop to the 1st support which is a pullback support.
Pivot: 106.18
1st Support: 105.27
1st Resistance: 107.04
Risk Warning:
Trading Forex and CFDs carries a high level of risk to your capital and you should only trade with money you can afford to lose. Trading Forex and CFDs may not be suitable for all investors, so please ensure that you fully understand the risks involved and seek independent advice if necessary.
Disclaimer:
The above opinions given constitute general market commentary, and do not constitute the opinion or advice of IC Markets or any form of personal or investment advice.
Any opinions, news, research, analyses, prices, other information, or links to third-party sites contained on this website are provided on an "as-is" basis, are intended only to be informative, is not an advice nor a recommendation, nor research, or a record of our trading prices, or an offer of, or solicitation for a transaction in any financial instrument and thus should not be treated as such. The information provided does not involve any specific investment objectives, financial situation and needs of any specific person who may receive it. Please be aware, that past performance is not a reliable indicator of future performance and/or results. Past Performance or Forward-looking scenarios based upon the reasonable beliefs of the third-party provider are not a guarantee of future performance. Actual results may differ materially from those anticipated in forward-looking or past performance statements. IC Markets makes no representation or warranty and assumes no liability as to the accuracy or completeness of the information provided, nor any loss arising from any investment based on a recommendation, forecast or any information supplied by any third-party.
Dxyshort

#dxy #elliottwave short sell setup wave c 28Nov24This count is based on my assumptions so anything can happen not a trading or financial advice just for educational purposes only kindly do your own ta thanks trade with care good luck.

DXY ShortBased on the previous analysis using a higher timeframe, I have analysed that we expect a bearish momentum from this trade.
Based on the 15 min timeframe, the price has retested and rejected the zone, forming an inverted hammer candlestick. I do anticipate that a bearish momentum is been formed.
Entry price at 106.9, SL at 107.2 and Target at 105.5

DXY ShortThis currency has been forming a descending flag, broke out of the structure and retested the higher high formed last week.
It has made a false break out (liquidity grab) and I anticipate that the price will build a bearish momentum to fill the second gap created by the previous week bullish impulse.
An analysis will follow using a shorter time frame.

#dxy #elliottwave short sell setup wave c 18Nov24This count is based on my assumptions so anything can happen not a trading or financial advice just for educational purposes only kindly do your own ta thanks trade with care good luck.

#dxy #elliottwave short sell setup wave c 18Nov24This count is based on my assumptions so anything can happen not a trading or financial advice just for educational purposes only kindly do your own ta thanks trade with care good luck.

Dxy downgradeDxy trending down, xxxusd going up usdxxx going down, bullish trend at DXY penetrative and crossing bullish resistance,
DYOR always, n keep ur trade safe

DXY, Is correction on the way ?Hello Traders, Hope you are doing great.
for upcoming days and for a short period of time, we'll probably see a downward correction to Specified level in TVC:DXY , we also have a Divergence on 4H that confirms our theory.
so with a proper trigger we can open a short position. We will also probably find better buy positions in FX:GBPUSD And FX:AUDUSD than the FX:EURUSD .
Trade safe and have a great weekend.
And finally tell me what do you think ? UP or DOWN ? leave your comment below this post.
If this post was helpful to you, please like it and share it with your friend.
THANKS.

#dxy #elliottwave short sell setup wave c 13Nov24This count is based on my assumptions so anything can happen not a trading or financial advice just for educational purposes only kindly do your own ta thanks trade with care good luck.

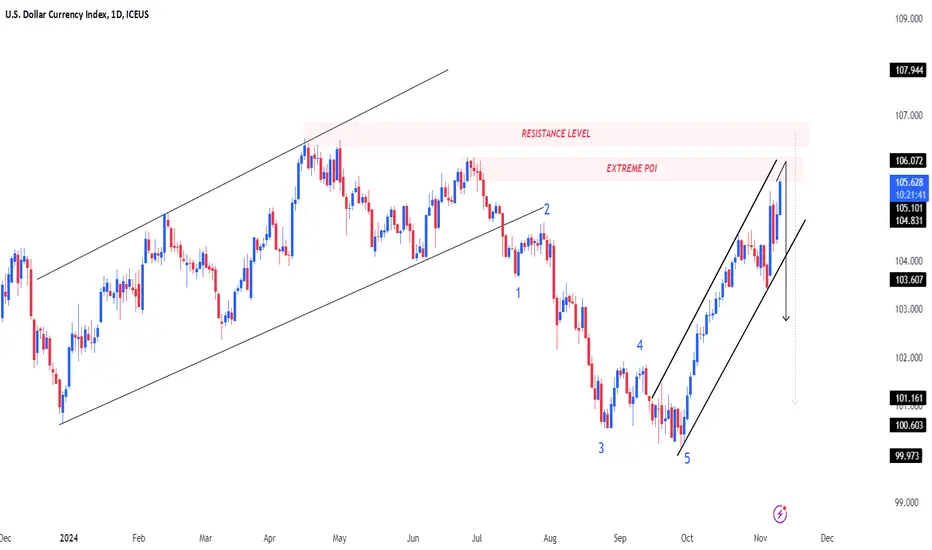
DXY IndexDXY Index
Completed " 12345 " Impulsive Waves and " ABC " Corrective Waves at Extreme Point of Interest ( POI ). Bullish Channel as an Corrective pattern in Short Time Frame and Rejection from Resistance Level with a Strong Divergence
The Breakout (The Easiest Chart To Ever UnderstandMy other Idea has a video explanation if anyone is interested

The Breakout! With The Easiest Chart Thank you for taking your time to watch this video and if you enjoyed it, Please feel free to ask any question in the comments and leave a like!

Is the DXY dollar index ready for a correction ? H4 08.11.2024💸 Is the DXY dollar index ready for a correction ⁉️
Looking back to 2016 when Trump first became US President, the dollar index initially reacted with a sharp rise and then a prolonged fall. I wonder if history will repeat itself again or if the market will take his second presidency more calmly in the distance.
DXY formed a sellers' zone at 104.80-105.16, but the far resistance zone at 106 remains intact. It's not a sure thing that it will get there, but I keep the option in my head just in case. The priority for me is to fall from the nearest sellers' zone with the targets of 103.30 and lower to 102.30. I will specify in the process.
TVC:DXY

EURUSD lond ideaSome weekly sell-side taken i like the shift now I would like to see some buy-side taken at 1.08273

#dxy #elliottwave short sell setup 21Oct24 wave cThis count is based on my assumptions so anything can happen not a trading or financial advice just for educational purposes only kindly do your own ta thanks trade with care good luck.

Waiting for the DXY correction H4. 17.10.2024 Waiting for the DXY correction
Ahead of the ECB meeting, the dollar index has reached a strong rotation level of 103.57 and the main question is whether there will be a reaction and correction downwards! There is also a spare resistance level at 104.20 and I do not rule out reaching it and then a serious correction to at least 102.28. There will definitely be volatility and it is important to watch the reaction through other currencies.
TVC:DXY

DXY IndexPair : DXY Index
Description :
Elliot Waves 12345 Impulsive Waves and A Corrective Waves
Fibonacci Level 50.00 / 61.80
CHOCH
Breakout and Retracement of Bearish Channel
Demand Zone

DXY Bullish again? rally from 102.600 back upOnce price mitigates and retests the daily demand zone I’ve marked out, I’ll be looking for the dollar (DXY) to trigger another bullish move within this point of interest (POI), potentially leading to a rally that could take out another all-time high (ATH).
Upon reaching this daily demand, I’ll focus on finding a lower time frame entry. As price pushes up, taking out the liquidity and filling the imbalance, I’ll be watching for potential short-term sell opportunities from the daily supply zone, which looks like a high-quality area.
Confluences for DXY Bullish Move:
Recent Bullish Momentum: Price has been strongly bullish.
Break of Structure (BOS): A clear BOS to the upside, leaving behind a demand zone.
Liquidity and Imbalance: Liquidity targets and imbalance above, providing room for a rally.
High-Quality Daily Demand: The daily demand zone is strong and has a good potential for a bullish push.
P.S. I wouldn’t be surprised if the daily supply also holds and causes a deep retracement, but we’ll see how the market reacts.
Have a great trading week guys!

usdjpy down in 1hr chart to 146.94usd jpy down to 146.94 by dxy in a reversaldivergence making wave number two after this last days of bull market innit we got the first reversal sign for the 2nd wave of Ellitot making it go to 146.94 arround that area in my pov, before turning agaoin up to 161/2

DXY IndexPair : DXY Index
Description :
Completed " 12345 " Impulsive Waves and " A " Corrective Waves
Break of Structure
RSI - Divergence
Bearish Channel as an Corrective Pattern in Short Time Frame
Fibonacci Level - 38.20%

Could this be the fall of the Dollar???The dollar is about to break the last significant structure on the monthly time frame. We have seen the dollar dropping over the last few months after its reaction from the last swing high.
Market structure shows price creating lower lows and lower highs which are confirmed by endless BOS. We can see a clear 11min OB has been left from the last low that price created once it tapped into the 18h demand which may allow us a buying opportunity to buy the dollar up to the 1h supply where we will continue to see it fall to it's untimely demise.
previous price action from this 18H however, didn't create much movement despite the fact it also took ASL liquidity possibly suggesting buying power in the market has no strength what so ever. We have to also consider the possibility price may not even be able to push back up but rather fall targeting the Asian lows as this would be considered a magnet for price movement.

DXY IndexPair : DXY Index
Description :
Completed " 12345 " Impulsive Waves
Consolidation Phase
RSI - Divergence
Bearish Channel as an Corrective Pattern in Short Time Frame
Triple Bottom

#DXY 4H On the 4-hour chart (4H) of DXY (U.S. Dollar Index), the price is currently in a downtrend, indicating a strong sell opportunity.
Sell Levels: 101.200 - 101.500
The price has reached a potential selling zone between 101.200 and 101.500, which is acting as a resistance range in the current bearish trend. This is a strategic area to consider short positions as the market may struggle to break above this level.
Target Level: 99.500
The expected downside target for this move is around 99.500, a key support area where the price might find some buying interest or consolidation after the bearish move.
Key Factors:
Downtrend: Lower highs and lower lows dominate the price action.
Resistance: The price faces strong selling pressure near 101.200-101.500.
Momentum: Indicators like RSI and moving averages suggest the trend is firmly bearish, with room to fall toward the 99.500 support.
Trading Strategy:
Entry: Look for short entries near the 101.200-101.500 range.
Target: Aim for the 99.500 level as the profit target.
Stop-loss: Consider placing a stop-loss above 101.500 to manage risk effectively.
This setup offers a favorable risk-to-reward ratio in line with the ongoing downtrend.
