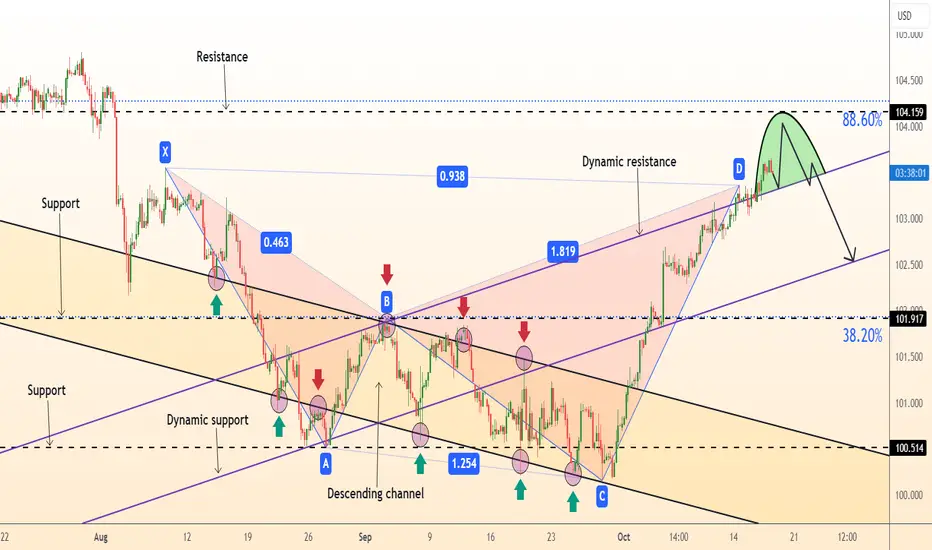
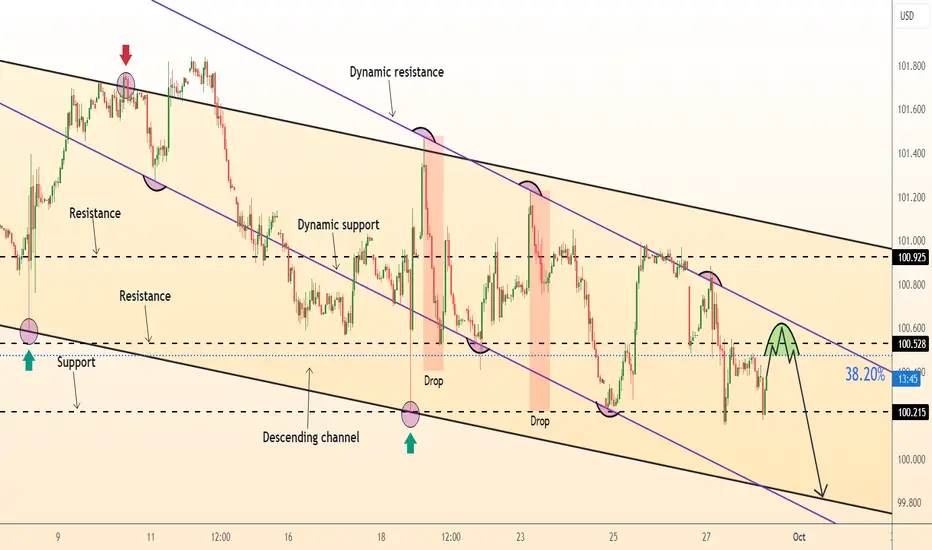
DeGRAM | DXY held the accumulation zoneDXY is near the lower boundary of the channel in the accumulation zone between the trend lines.
The index is moving from the lower trend line and has already successfully tested the borders of the current zone and support level again.
The chart has formed a harmonic pattern.
We expect growth if the index holds in the current zone.
-------------------
Share your opinion in the comments and support the idea with like. Thanks for your support!
Dxysignal

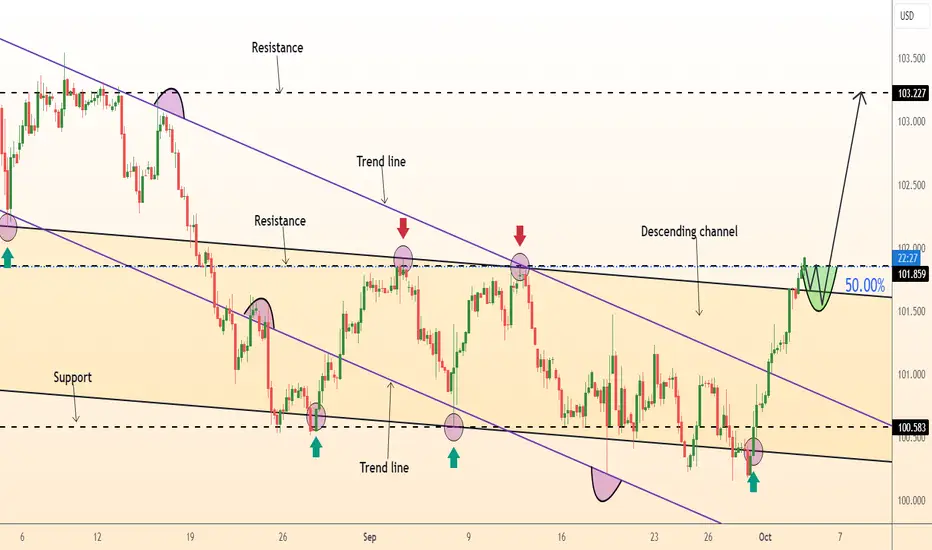
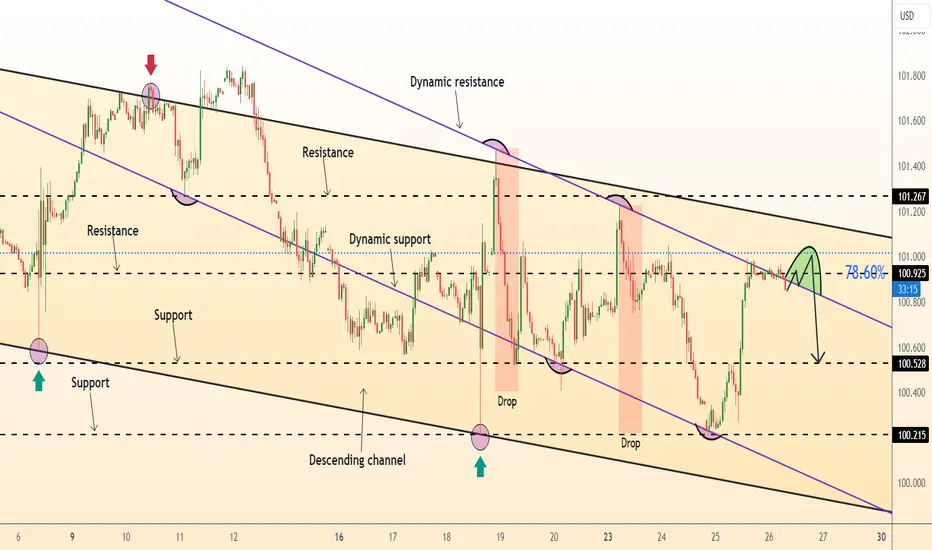
DeGRAM | DXY exiting from the accumulation zoneDXY is in a descending channel between trend lines.
The chart has already reached the lower boundary of the channel, the lower trend line and the support level, which has already acted as a rebound point.
Price has quickly picked out of the range between the levels and is now above the accumulation zone.
AB=CD pattern has been formed.
We expect a rebound after consolidation above the accumulation zone.
-------------------
Share your opinion in the comments and support the idea with like. Thanks for your support!

DeGRAM | DXY breakout of the channelDXY is between the trend lines under the ascending channel.
The chart is moving from the upper trend line and has already dropped below the lower boundary of the channel.
The price is under the 78.6% retracement level.
We expect a decline.
-------------------
Share your opinion in the comments and support the idea with like. Thanks for your support!

DeGRAM | DXY has fallen below the retracement levelThe DXY is in an ascending channel between the trend lines.
During the closing of the gap, the chart formed a new one and then sharply went down and closed the new gap.
The price has already reached the resistance level, the upper trend line and the upper boundary of the channel and has now dropped below the 62% retracement level.
The chart has broken the ascending structure.
We expect a decline.
-------------------
Share your opinion in the comments and support the idea with like. Thanks for your support!

DeGRAM | DXY index aims to close the gapDXY is near the lower boundary of the rising channel above the trend lines.
After a pullback from the resistance level, the chart formed a gap, tested the trend line and returned to the ascending channel.
At the moment the price is testing the 62% retracement level.
We expect the growth to continue after consolidation above the correction level.
-------------------
Share your opinion in the comments and support the idea with like. Thanks for your support!

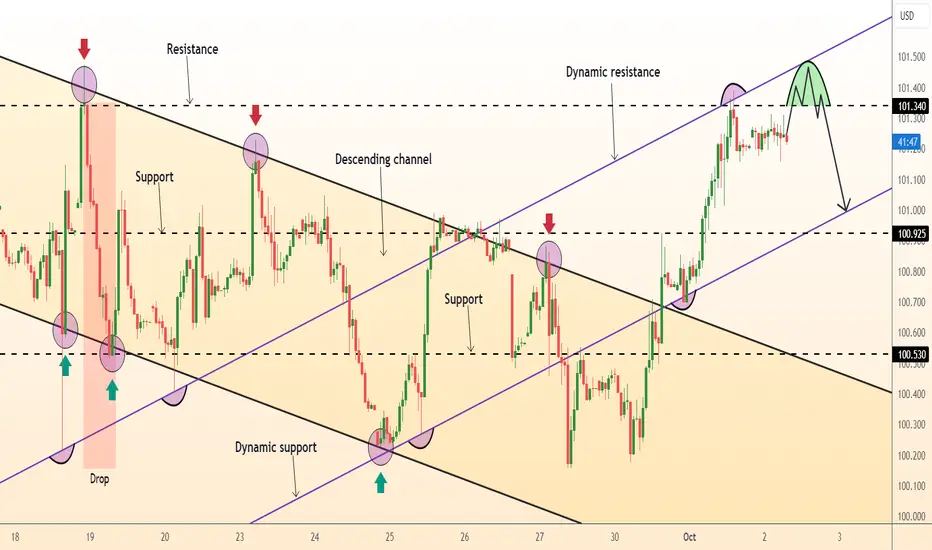
DeGRAM | DXY overboughtDXY is above the trend lines and ascending channel.
RSI indicator indicates overbought.
The price broke the channel and sharply reached an important Fibbonacci extension level.
We expect a correction.
-------------------
Share your opinion in the comments and support the idea with like. Thanks for your support!

DeGRAM | DXY broke through the channel boundaryThe DXY is under an ascending channel between the trend lines.
The chart has already reached the dynamic resistance level and has now broken down the channel boundary.
We expect a decline after consolidation under the trend line.
-------------------
Share your opinion in the comments and support the idea with like. Thanks for your support!

DeGRAM | DXY preparing for correctionDXY is near the upper border of the channel, between the trend lines, which the chart formed during the correction on the last downward impulse.
The price has reached the resistance level and is now below it.
We expect a correction after the retest of the channel border.
-------------------
Share your opinion in the comments and support the idea with like. Thanks for your support!

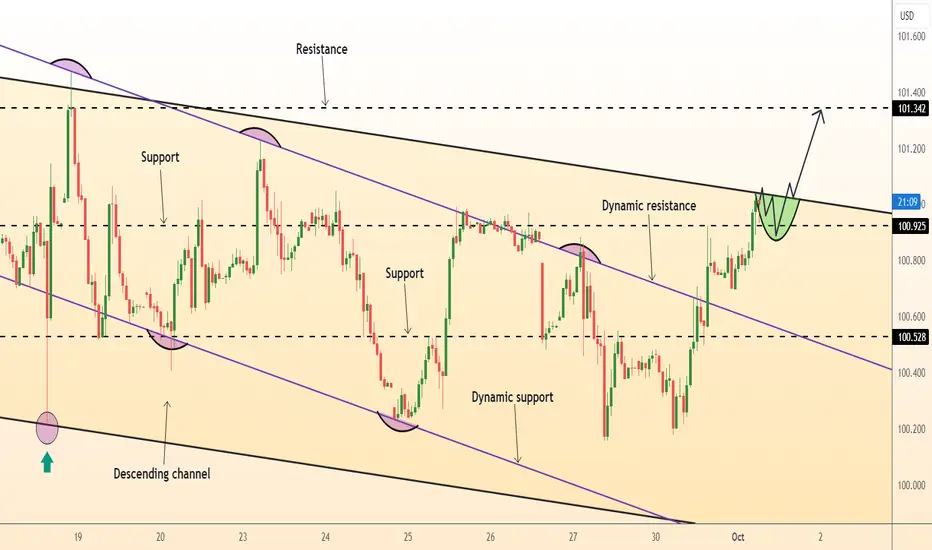
DeGRAM | DXY growth in the channelDXY is moving in a descending channel between trend lines.
Having reached the lower boundary of the channel, the chart has formed a reversal harmonic pattern.
The price has reached the 62% retracement level.
We expect the growth to continue after retesting and consolidating above the current resistance.
-------------------
Share your opinion in the comments and support the idea with like. Thanks for your support!

DXY "DOLLAR INDEX" Bank Bullish Robbery Plan To Steal MoneyHola! My Dear Robbers / Money Makers & Losers, 🤑 💰
This is our master plan to Heist DXY "DOLLAR INDEX" Bank based on Thief Trading style Technical Analysis.. kindly please follow the plan I have mentioned in the chart focus on Long entry. Our target is Red Zone that is High risk Dangerous level, market is overbought / Consolidation / Trend Reversal / Trap at the level Bearish Robbers / Traders gain the strength. Be safe and be careful and Be rich.
Entry : Can be taken Anywhere, What I suggest you to Place Buy Limit Orders in 15mins Timeframe Recent / Nearest Swing Low
Stop Loss 🛑 : Recent Swing Low using 2h timeframe
Attention for Scalpers : If you've got a lot of money you can get out right away otherwise you can join with a swing trade robbers and continue the heist plan, Use Trailing SL to protect our money 💰.
Warning : Fundamental Analysis news 📰 🗞️ comes against our robbery plan. our plan will be ruined smash the Stop Loss. Don't Enter the market at the news update.
Loot and escape on the target 🎯 Swing Traders Plz Book the partial sum of money and wait for next breakout of dynamic level / Order block, Once it is cleared we can continue our heist plan to next new target.
Support our Robbery plan we can easily make money & take money 💰💵 Follow, Like & Share with your friends and Lovers. Make our Robbery Team Very Strong Join Ur hands with US. Loot Everything in this market everyday make money easily with Thief Trading Style.
Stay tuned with me and see you again with another Heist Plan..... 🫂

DeGRAM | DXY tends to growDXY is moving in a descending channel.
The chart has broken the descending structure, the price has entered the channel and is now above the correction level.
We expect the growth to continue.
-------------------
Share your opinion in the comments and support the idea with like. Thanks for your support!

DeGRAM | DXY preparing for a reversal of movementDXY is moving above the trend lines and descending channel.
The chart has formed a harmonic bat pattern.
The price has not yet consolidated above the upper trend line.
We expect a reversal after consolidation under the dynamic resistance.
-------------------
Share your opinion in the comments and support the idea with like. Thanks for your support!
DeGRAM | DXY strong resistanceDXY is moving above the descending channel between the trend lines.
The chart has broken the descending structure.
The price has reached an important psychological resistance level.
We expect a decline if the chart fails to consolidate above the current level.
-------------------
Share your opinion in the comments and support the idea with like. Thanks for your support!

DeGRAM | DXY descending channel breakoutDXY is moving above the descending channel and trend lines.
The price broke through the resistance level, which coincides with the 50% retracement level of the bearish momentum.
We expect further growth after consolidation above the resistance.
-------------------
Share your opinion in the comments and support the idea with like. Thanks for your support!
DeGRAM | DXY a pullback from the resistance levelDXY is moving above the descending channel between the trend lines.
The price reached the resistance level, after which it instantly reacted with a decline. This level has already acted as an important resistance and a pullback point last time.
The chart is moving from the upper trend line to the dynamic support.
We expect the pullback to continue after retesting the resistance level.
-------------------
Share your opinion in the comments and support the idea with like. Thanks for your support!
DeGRAM | DXY disruption of the descending structureDXY is moving in a descending channel above the trend lines.
Having bounced off the support, the price broke the dynamic resistance and approached the upper boundary of the channel.
The chart has broken the descending structure and is now above the resistance level.
We expect the rebound to continue after consolidation above the upper boundary of the channel.
-------------------
Share your opinion in the comments and support the idea with like. Thanks for your support!
DeGRAM | DXY decline from the trend lineDXY is moving in a descending channel between trend lines.
The descending structure is not broken.
The price is below the correction level.
The chart is moving between trend lines and has already reached the upper one.
We expect the decline to continue.
-------------------
Share your opinion in the comments and support the idea with like. Thanks for your support!
DeGRAM | DXY closed the gapDXY is moving in a descending channel between trend lines.
The chart maintains a downward structure.
After the decline from the dynamic resistance, the price formed a gap, which it successfully closed during the rebound after reaching the support level.
We expect the decline to continue after the retest of the trend line.
-------------------
Share your opinion in the comments and support the idea with like. Thanks for your support!

DeGRAM | DXY reached the dynamic resistanceDXY is moving in a descending channel under the upper trend line.
The price has already reached the dynamic resistance, which has twice acted as a pullback point.
The chart is under the resistance level and the retracement level.
We expect a decline.
-------------------
Share your opinion in the comments and support the idea with like. Thanks for your support!
DeGRAM | DXY downturn in the channelDXY is moving in a descending channel between trend lines.
The chart has not yet reached the lower boundary of the channel.
After touching the dynamic support, the price bounced to the resistance level.
We expect a decline after the resistance retest.
-------------------
Share your opinion in the comments and support the idea with like. Thanks for your support!

DeGRAM | DXY attempt to get a fix in the channelThe DXY is moving near an ascending channel above the trend lines.
The upper trend line has already acted as a rebound point.
Each time approaching the support level, the price bounced.
We expect the price to rise after consolidation in the channel.
-------------------
Share your opinion in the comments and support the idea with like. Thanks for your support!

DeGRAM | DXY rebound from the channel boundaryDXY is moving in an ascending channel under the trend lines.
The lower boundary of the channel has already become a reversal point three times, and most of the time the chart has been in the upper part of the channel, which indicates an uptrend.
The price has not yet reached the support level.
We expect a rebound with a possible reaching of the support level before it starts.
-------------------
Share your opinion in the comments and support the idea with like. Thanks for your support!

DeGRAM | DXY rebound from the retracement levelDXY is moving under an ascending channel between trend lines.
The price has reached the lower boundary of the channel and 62% retracement level.
We expect a rebound.
-------------------
Share your opinion in the comments and support the idea with like. Thanks for your support!
