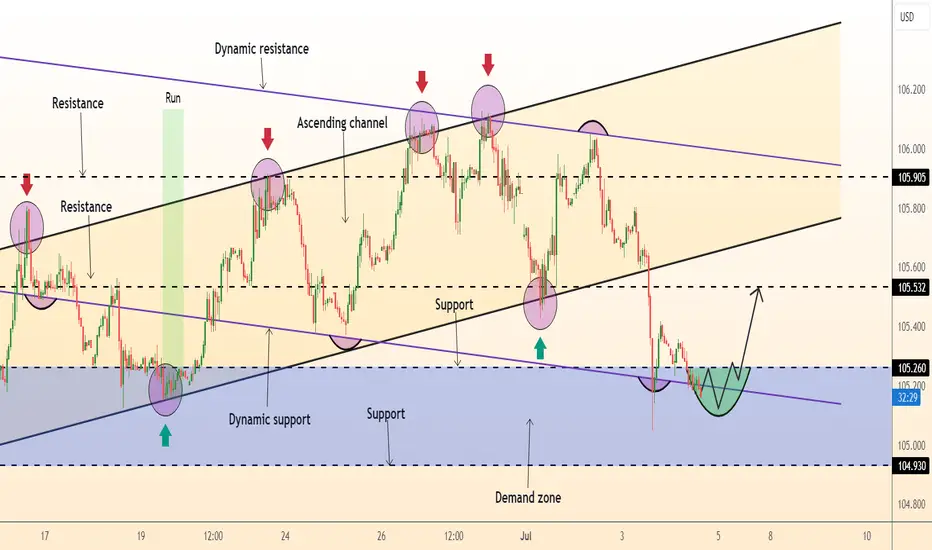
DeGRAM | DXY correctionDXY is moving in an ascending channel above the trend lines.
The chart has broken the descending structure.
The price has already reached the dynamic resistance and approached the supply zone, which has repeatedly acted as a strong resistance zone.
We expect a correction if the price consolidates under the lower boundary of the supply zone.
-------------------
Share your opinion in the comments and support the idea with like. Thanks for your support!
Dxysignal

DeGRAM | DXY reached the retracement levelDXY is moving in a descending channel between trend lines.
The descending structure is preserved.
The price has reached the resistance level coinciding with the 38.2% retracement level.
The chart has reached the dynamic resistance and the upper boundary of the channel.
We expect a pullback after consolidation under the resistance level.
-------------------
Share your opinion in the comments and support the idea with like. Thanks for your support!

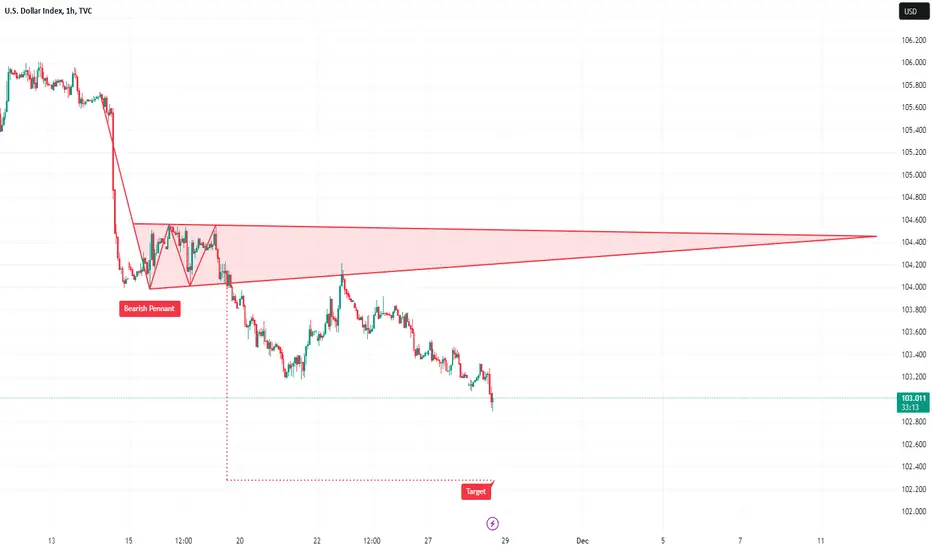
DeGRAM | DXY rebound from the extension levelDXY is moving in a descending channel between trend lines.
The price has reached the 100% extension level and is now trading above the support.
The chart has formed a pattern AB=CD.
We expect a rebound.
-------------------
Share your opinion in the comments and support the idea with like. Thanks for your support!

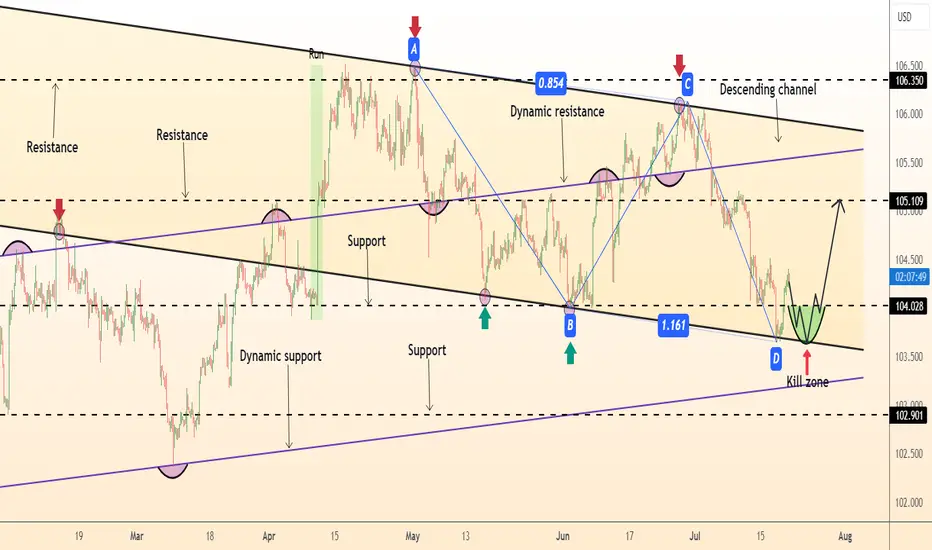
DeGRAM | DXY rebound from dynamic supportDXY is moving in a descending channel between trend lines.
The chart has reached the lower boundary of the channel, dynamic support and is now moving above the support level.
The price has formed a pattern AB=CD.
We expect a rebound after the support level is retested.
-------------------
Share your opinion in the comments and support the idea with like. Thanks for your support!

DeGRAM | DXY retest of supportDXY is moving under the descending channel and trend lines.
The price has already approached the support level for the third time.
We expect a rebound after the support is retested.
-------------------
Share your opinion in the comments and support the idea with like. Thanks for your support!

8.14 USD Trend AnalysisCPI is lower than expected, gold falls off a cliff, can the US dollar survive the desperate situation?
Today, the US seasonally adjusted CPI annual rate for the end of July was lower than expected. With gold and silver slightly bullish, gold price fell from a high of 2474 to 2050, a drop of 24 US dollars.
Everyone knows that if gold price falls, the US dollar will rise. Gold price currently lacks momentum. The war in the Middle East is still unclear. It may continue to fall. Will there be new entry opportunities for the US dollar?
What do you think of this view? Welcome to comment below

DeGRAM | DXY a sharp drop to the channel boundaryDXY fell to the lower boundary of the descending channel, continuing to move between the trend lines.
The price reached the support level, which was already acting as a rebound point.
The chart reached the lower trend line.
We expect a rebound after a retest of the lower channel boundary.
-------------------
Share your opinion in the comments and support the idea with like. Thanks for your support!

The collapse of US stocks across the board, is this a sign of a 8.2 US stocks collectively plunged
Qualcomm fell 9%
Nvidia fell 6%
Tesla 6%
Philadelphia Semiconductor Index fell 8%
Intel fell short of expectations
Is the above directly related to the news of interest rate cuts in September?
The answer is "YES"
What do you think of this comment area? Welcome to comment

Can the dollar's dominance be maintained?I believe everyone knows that when the dollar rises, gold falls. But this year, an abnormal thing happened. Both the dollar and gold rose. Many people thought it was due to inflation, war, and geopolitical influences. In fact, everyone overlooked an important detail, which is "U.S. debt". In 2017, the U.S. national debt was about 20 trillion U.S. dollars. By the end of 2023, the U.S. national debt was as high as 34 trillion U.S. dollars. In fact, you can calculate how much debt the United States has issued in 6 years according to the speed of the expansion of the U.S. debt? The answer is "70%". All the money in the world will depreciate if it is printed too much, but will the U.S. dollar be immune? The answer is definitely "no". The reason why everyone is seeing the rise of the US dollar now is because not only the United States but other countries are also printing a large amount of currency. At the same time, the US dollar is a leading currency. When it continues to tighten liquidity, The U.S. dollar seems to be scarce, but it is reflected in real assets: For example, in , when we go back and compare the values of the two, it is not difficult to find that the U.S. dollar is actually depreciating? Why do we say that when the price of gold rose in April and May this year, the United States immediately The very strong non-farm payroll data came out and immediately pushed the price of gold back. However, in In July, the previous non-farm payroll data was significantly revised downwards. This wave of expectation management can be said to have made everyone stupid. In fact, the United States is Want to maintain the dominance of the US dollar. But now the global wave of de-dollarization and the Federal Reserve's interest rate cut are about to depreciate the US dollar, which is already unstoppable.

DeGRAM | DXY reversal after AB=CDDXY continues to move in a descending channel between trend lines.
The price has reached the lower boundary of the channel, and also broke through the resistance level, which now acts as support, and also already acted as a growth point.
The chart has formed a pattern AB=CD.
We expect the growth to continue after the retest of the nearest support.
-------------------
Share your opinion in the comments and support the idea with like. Thanks for your support!
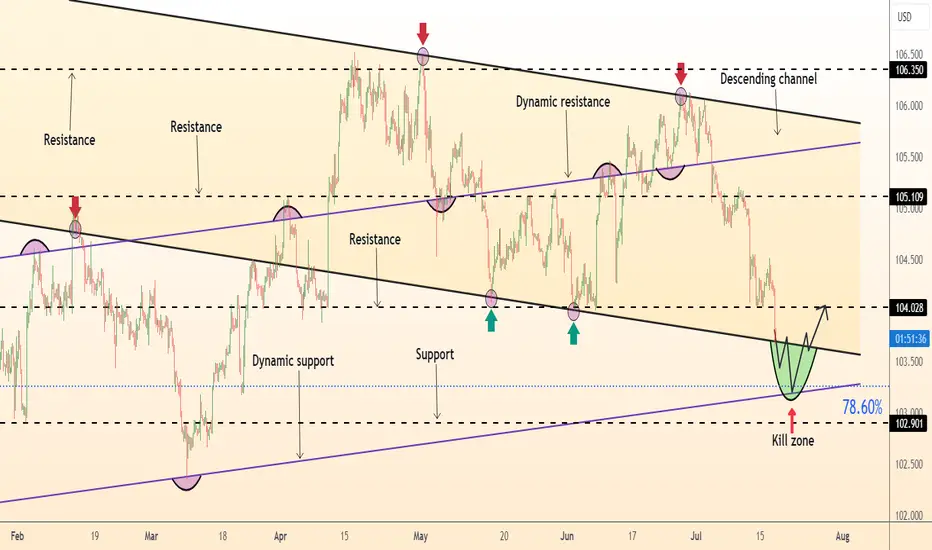
DeGRAM | DXY retest of the channel boundaryDXY is moving in a descending channel between trend lines.
The chart has already reached the lower boundary of the channel.
The price is at the 78.6% retracement level.
We expect a rebound after a retest of the lower channel boundary.
-------------------
Share your opinion in the comments and support the idea with like. Thanks for your support!
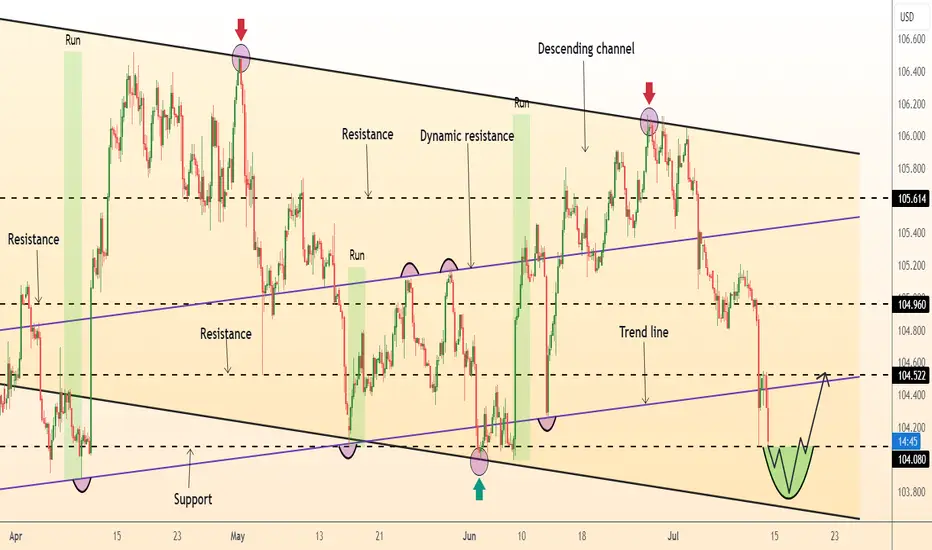
DeGRAM | DXY has reached strong supportDXY is moving in a descending channel under the trend line.
The chart is above the support level, which has already become a rebound point three times.
We expect a rebound after a retest of the support level.
-------------------
Share your opinion in the comments and support the idea with like. Thanks for your support!
DeGRAM | DXY rebound from the retracement levelDXY has dropped to the next support level.
The price reacted to reach the support, which coincides with the 62% retracement level of the bullish momentum.
We expect a rebound after a retest of the current level.
-------------------
Share your opinion in the comments and support the idea with like. Thanks for your support!

DeGRAM | DXY rebound from the demand zoneDXY is moving in the demand zone above dynamic support.
The price is testing the support level, which has already acted as a rebound point.
We expect a reversal after a retest of the upper boundary of the current zone.
-------------------
Share your opinion in the comments and support the idea with like. Thanks for your support!
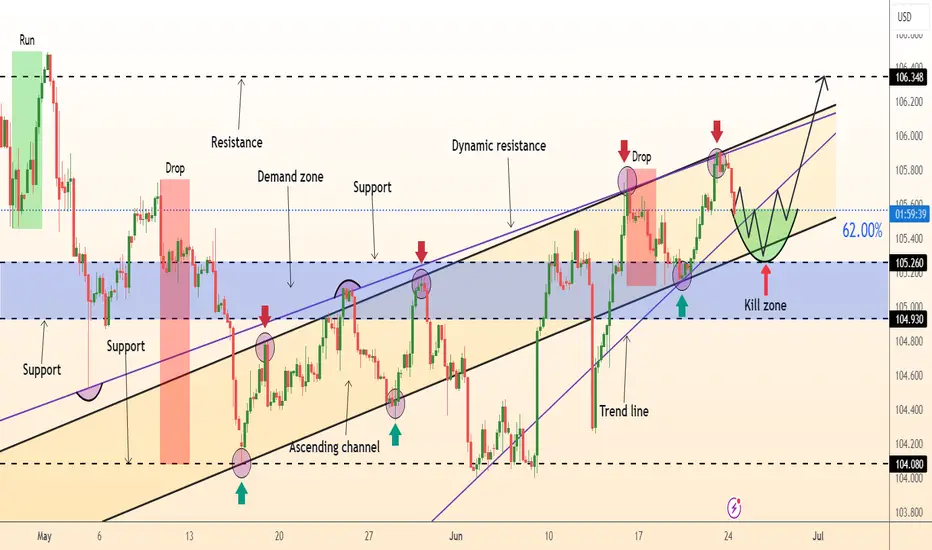
DeGRAM | DXY rebound from the retracement levelThe DXY is in an ascending channel below the trend lines.
The chart touched the lower boundary of the channel and bounced off the 62% retracement level.
The price is above the mirror support level.
We expect the growth to continue after the retest of the current level.
-------------------
Share your opinion in the comments and support the idea with like. Thanks for your support!
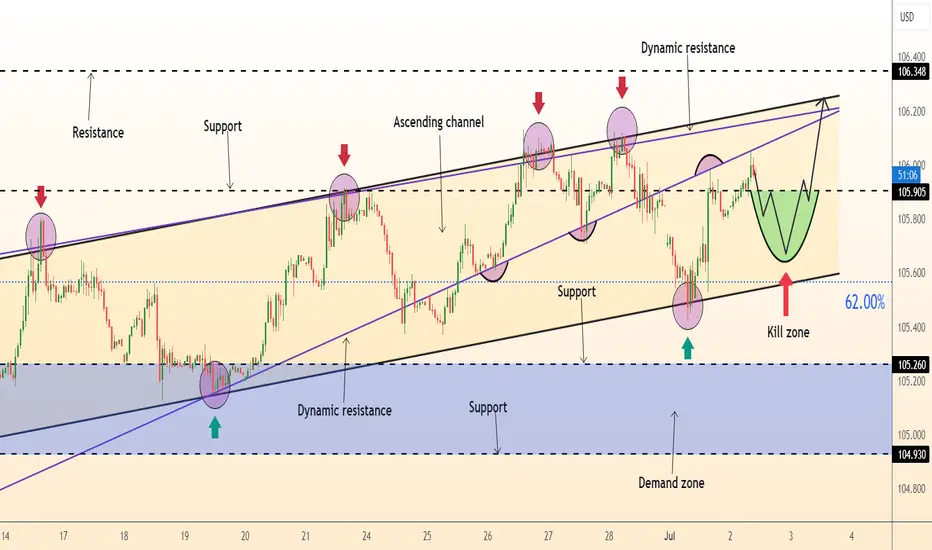
DeGRAM | DXY testing of the correction levelDXY is moving in an ascending channel between trend lines.
The volatility of the movement is decreasing.
The impulse started from the demand zone and now the price is above the 62% retracement level, which has already been a pivot point for 3 times.
We expect a rebound after retesting the 62% retracement level.
-------------------
Share your opinion in the comments and support the idea with like. Thanks for your support!
DXY Index Can Go Up by Classical Technical Analysis Pattern🚀🏃♂️The DXY Index is moving in the 🟢 Support zone($102.87-$102.43) 🟢.
📈 Regarding Classical Technical Analysis , the dollar index has successfully formed an Inverse Head and Shoulders pattern .
🌊According to the theory of Elliott waves , the dollar index has completed a Zigzag correction(ABC/5-3-5) in the 🟢 Support zone($102.87-$102.43) 🟢.
🔔I expect the DXY Index to rise to at least the 61.8% Fibonacci level and Resistance lines .
U.S.Dollar Currency Index ( DXYUSD ) Analyze, 1-hour time frame⏰.
Do not forget to put Stop loss for your positions (For every position you want to open).
Please follow your strategy; this is just my Idea, and I will gladly see your ideas in this post.
Please do not forget the ✅' like '✅ button 🙏😊 & Share it with your friends; thanks, and Trade safe.

What should we expect from DXY Index by the end of 2023❗️❓🗺️👋Hi everyone (Reading time less than 3 minutes⏰) .
📚One of the most important Indices that we should have an analysis of is the DXY index because it has a direct impact on the Forex , Cryptocurrency , and stock and etc markets. So, in this post, I'm going to show you the 🗺️ Roadmap 🗺️ for DXY until at least the End of 2023 and Early 2024 .
💡I used the Monthly time frame and Elliott wave theory to display the DXY index roadmap better.
💡First of all, it is better to know that the DXY index has formed an Ascending Channel since 2008 and is moving in it.
🌊According to the theory of Elliott waves , the DXY index has succeeded in completing its 5 impulsive waves in the ascending channel so that the 3rd wave was an extended wave .
🌊As a result, it seems that Corrective waves have started, and to confirm this, it is better to wait for the break of the lower line of the ascending channel.
🔔I expect the DXY to move between 🔴Heavy Resistance zone($107.62-$103.10)🔴 and 🟢Support zone($101.64-$99.58)🟢 by the end of 2023 and early 2024, and in mid-2024 , the DXY will begin to trend Down , and Financial markets will likely turn 🚀Green🚀 .
DXY Index Analyze ( DXYUSD ), Monthly time frame ⏰.
Do not forget to put Stop loss for your positions (For every position you want to open).
Please follow your strategy; this is just my Idea, and I will be glad to see your ideas in this post.
Please do not forget the ✅' like '✅ button 🙏😊 & Share it with your friends; thanks, and Trade safe.

DXY Analysis Sell signalHello traders,
Last week, we saw a strong bearish momentum. Moving forward, I anticipate a continuation of the sell-off in DXY in the coming week, with my short-term target being the weekly fvg.
However, before taking any action,we should wait for a displacement lower to occur before considering entering the market.

DXY Index is Ready to Break the 🔴Resistance zones🔴✅It seems that the DXY Index finally managed to break the Descending Channel that it was in for more than one month .
💡I expect the DXY Index to take the help of the Uptrend line to break the Resistance zone ahead and it can break the minimum 🔴 Resistance zone($104.20-$103.98) 🔴.
U.S.Dollar Currency Index ( DXYUSD ) Analyze, 4-hour time frame⏰.
Do not forget to put Stop loss for your positions (For every position you want to open).
Please follow your strategy; this is just my Idea, and I will gladly see your ideas in this post.
Please do not forget the ✅' like '✅ button 🙏😊 & Share it with your friends; thanks, and Trade safe.

🗺️DXY Index Roadmap🗺️⏰(4-hour time frame)⏰🏃♂️The DXY index has been moving in a Descending channel for a month .
🌊According to Elliott's theory , it seems that the DXY index has completed its 5 downward waves near the lower line of the descending channel after breaking the 🟢Support zone($103.78_$102.93) 🟢.
💡Also, we can see Regular Divergence(RD+) between two Consecutive Valleys .
💡I expect the DXY index to move towards the upper line of the descending channel and in the first step, we have to wait for the middle line of the descending channel to be broken ( the middle line has already played the role of support and resistance ).
U.S.Dollar Currency Index ( DXYUSD ) Analyze, 4-hour time frame⏰.
Do not forget to put Stop loss for your positions (For every position you want to open).
Please follow your strategy; this is just my Idea, and I will gladly see your ideas in this post.
Please do not forget the ✅' like '✅ button 🙏😊 & Share it with your friends; thanks, and Trade safe.

DXY → Further gains likely above 103.57TVC:DXY regains the smile and advances to multi-day highs past 103.70 on Monday.
If the key 200-day SMA (103.57) is surpassed, the index is expected to face more sustained gains to, initially, the weekly top of 104.21 (November 22) ahead of the transitory 100-day SMA at 104.37.
In the meantime, above the key 200-day SMA, the outlook for the index is expected to shift to bullish.

DXY → Extra losses in the pipelineTVC:DXY extends the leg lower for the fourth session in a row on turnaround Tuesday.
Further weakness in the index is expected to challenge the key support at 103.00 sooner rather than later. The loss of this region exposes the weekly low of 102.93 (August 30) ahead of another round level at 102.00.
In the meantime, while below the key 200-day SMA (103.60), the outlook for the index is expected to remain bearish.