Beware of Relying on Dollar Price Moves to Predict Bitcoin's FutThe inverse relationship between the US dollar and Bitcoin has long been a reliable indicator for traders seeking to gauge the potential movement of the cryptocurrency market. Historically, when the dollar strengthened, Bitcoin tended to experience a decline, and vice versa. This relationship allowed us to make informed decisions and manage our portfolios effectively. However, it is essential to recognize that the dynamics of this correlation have started to shift, posing potential risks to our trading strategies.
Over the past months, we have witnessed instances where the US dollar has weakened while Bitcoin continued to soar to new heights. This decoupling of the two assets challenges the reliability of the inverse correlation we have grown accustomed to. While it is tempting to continue relying on this relationship, doing so mindlessly may lead us astray and result in significant losses.
Therefore, I strongly urge you to exercise caution and refrain from using dollar price moves to indicate Bitcoin's future direction. Instead, let us analyze the underlying factors that drive the cryptocurrency market, such as market sentiment, regulatory changes, technological advancements, and institutional adoption. By adopting a more holistic approach to our trading strategies, we can better position ourselves to successfully navigate the evolving landscape of digital currencies.
In light of these developments, I encourage you to diversify your sources of information and stay updated with the latest market news and expert opinions. Engage in meaningful discussions with fellow traders, share insights, and challenge conventional wisdom. By fostering a community that embraces critical thinking and adaptability, we can collectively navigate the uncertainties of this ever-changing market.
Remember, the cryptocurrency market is highly volatile and subject to various external influences. Relying solely on the inverse correlation between the US dollar and Bitcoin is no longer reliable. Let us be vigilant, open-minded, and proactive in our approach to trading.
If you have any questions or concerns, please do not hesitate to comment. Together, we can navigate these challenging times and adapt our trading strategies to ensure long-term success.
Dxysignals

DXY Analysis 24July2023Seeing the current Dxy structure, there is a downtrend channel in which there is also a triangle expanding pattern. Seeing patterns like this, the possibility is Dxy while the time will bullish up to the pattern that I describe on this chart.

U.S.Dollar Currency (DXY) 💵Dollar Forecast Loaded with Volatility Potential but Can It Find a Trend?
The Dollar has put in for a significant retreat these past few months, but recent bearish progress has come at a much more reserved tempo
Event risk ahead is dense and may overlap in terms of market-moving potential, particularly between Tuesday’s CPI and Wednesday’s FOMC decision
Market liquidity and seasonal influence will be a critical consideration of trade in the week ahead with the subsequent final two weeks likely to see a significant drain in market depth
From the DXY Dollar Index’s multi-decade peak set back on September 28th, the Greenback has undergone significant retracement. Then again, the tempo of that slide has been much choppier after the charged reaction of the October CPI release (back on November 10th) wore off. To better determine the potential of the world’s largest currency moving forward, it is critical to assess what is the most important motivation for capital flows into and out of the US going forward. On the one hand, I keep a steady focus on the Dollar’s safe haven status, but this more of an ‘absolute’ sentiment role. While the S&P 500 and DXY have experienced an inverse correlation the past six months, the 20-day rolling correlation at present is only -0.38 (inverted but of modest strength). The complication is that the US currency also has a yield advantage – that is heavily speculated upon – and the expectation for significant risk trends is uneven at best. While the week ahead promises/threatens serious volatility potential, the serial nature of its listing will likely work against gaining clear momentum behind a theme and thereby price. That said, expectations for an overloaded docket and seasonal drain will meet a backdrop of high, realized volatility (see the 4-week ATR below). The saying ‘this time is different’ is echoed through the markets for a reason.
While the consideration of the Dollar’s safe haven status is something to always keep in mind, the need for an extreme reading to activate its influence should keep us focused on monetary policy first and recession concerns second. The US benchmark rate is just a quarter percent off the leaders – the Bank of Canada and Reserve Bank of New Zealand – heading into the new week of trade. With the Wednesday FOMC rate decision, it is likely that the US central bank regains its top rank. Economists are forecasting a 50 basis point rate hike that would lift the benchmark to 4.50 percent with Fed Fund futures placing the probability of a half percent increase at 77 percent (the balance calling for a fifth consecutive 75bp move). While 50bp is still a large move, it is a slowdown from the incredible tempo these past six months. What markets will truly focus on the implications for how far – and how fast – the Fed will move in 2023. The so-called ‘terminal rate’ is seen at 5.00 – 5.25 percent reached by May. This will shift a lot of the focus on the Summary of Economic Projections (SEP) which will include official interest rate expectations for the entire year. And, while the markets are pricing in expected rate cuts through the year, the FOMC members have been adamant that they expected to hold the rate after hitting peak.
When looking at the DXY Dollar Index’s chart, the structure looks choppy without much in the way of clear technical guidance – that is likely because it is a composite of major crosses where there is far more trade that would establish the components technical backdrop. For fundamental insight, there isn’t a better representation of the Dollar than EURUSD itself. Beyond its position as the world’s most liquid currency cross, the monetary policy and economic considerations between the two draws lots of contrast. The Fed is set to moderate its pace of hikes to coast to a peak sometime around mid-2023 while the follow through of the ECB’s course is up in the air (the group is not particularly renowned for its messaging). Considering the European Central Bank is also on deck for updating on rates Thursday, EURUSD will see a back-to-back monetary policy update Wednesday to Thursday. That may act to amplify or cool any market movement here depending on the outcome, but rate expectations have been aligning more distinctly to the FX pair when using the EU to US 2-year yield differential as the proxy.

DXY Analysis. Next week plan.Hello Everyone. I want share my idea about USDOLLAR index.
Last week was strong bearish, but this week we saw some correction. it broke Daily resistance last week and this week came for retest. I think present point for short entry is good opportunity. from here i expect movement to 97.8, at this LVL we have weekly support.
This is my 2 scone of price movement.
1 Bullish - price brake given resistance at 101.1 strong, then it coming back slowly for price correction and then going strong up again and brake all resistances.
2 Bearish - from the point what we have at the moment price has rejection and continues bearish trend, coming to weekly support at 97.8 where will be my take profit.
Be patient!

DXY New Week Possible MovePair : DXY Index
Description :
Completed " 1234 " Impulsive Wave
Divergence
Impulse Correction
Break of Structure
Descending Triangle in STF as an Corrective Pattern

DXY made a huge bearish break-out. The 1W MA200 is next.Last time we looked at the U.S. Dollar Index (DXY) we gave a sell signal on the exact top, the Lower Highs trend-line (chart below):
Our first target (102.000) got hit, which was basically the 1W MA100 (green trend-line) that supported on the May 08 bounce. This week, that trend-line broke emphatically (also the 100.825 Support) and that is a strong bearish break-out signal. Technically the 1W MA200 (orange trend-line) is next, which has been our second target (98.550) since our June 04 analysis.
Notice also that even the 1W RSI broke below its 35.05 Support, a clear indication that the long-term strength has shifted to bearish.
-------------------------------------------------------------------------------
** Please LIKE 👍, FOLLOW ✅, SHARE 🙌 and COMMENT ✍ if you enjoy this idea! Also share your ideas and charts in the comments section below! **
-------------------------------------------------------------------------------
💸💸💸💸💸💸
👇 👇 👇 👇 👇 👇

Mind-Blowing Surge: US Dollar Skyrockets 5000% against Argentina
I come bearing astonishing news that will undoubtedly leave you stunned and intrigued. Brace yourselves for a mind-blowing revelation: the US dollar has soared an unprecedented 5000% against the Argentina peso!
Yes, you read that correctly! The US dollar's monumental surge against the Argentina peso has sent shockwaves through the forex market. This staggering increase has left many traders astounded, and rightfully so. It is a testament to the volatile nature of currency fluctuations and the potential opportunities that arise from such dramatic shifts.
As we witness this extraordinary event unfold, it is crucial to consider the implications and potential ramifications. Countries like Argentina, grappling with economic uncertainties, are now contemplating the adoption of the US dollar as a viable alternative. This development has sparked a flurry of discussions among economists and policymakers, drawing attention to the stability and strength of the US dollar in tumultuous times.
In light of this monumental shift, I urge you to carefully evaluate the potential benefits of including the US dollar in your forex strategies. One effective way to gauge the US dollar's performance against a basket of other major currencies is by monitoring the Dollar Index (DXY). This index, which measures the dollar's value against a weighted average of six major currencies, can provide valuable insights and assist in making informed trading decisions.
Considering the recent surge of the US dollar against the Argentina peso, keeping a close eye on the DXY becomes increasingly pertinent. By doing so, you can stay ahead of the curve and capitalize on potential opportunities that arise from countries considering the adoption of the US dollar.
So, fellow traders, let us seize this moment of surprise and possibility. Explore the potential of the US dollar, leverage the power of the DXY, and stay one step ahead in the ever-evolving forex market.

DXYDXY BUY
TP in the chart
SL in the chart
Good luck guys
Note: To reduce the risk on your balance
you have to use only 2% of your balance.
-
-
-
-
-
-❤️If you have any questions, please, ask me in the comment section.
Please, support my work with like, thank you!❤️.

DXY Index New Possible MovePair : DXY Index
Description :
Completed " 1234 " Impulsive Wave
Divergence - RSI
Break of Structure
Impulse Correction
Bearish Channel as an Corrective Pattern in STF
S / R Level
DXY Potential To DownsideIt will be interesting to see conditions at the beginning of next week. If the movement cannot be broken at the 101.30 area, it is possible that the movement will experience a correction first. Even though the potential on the target could still be in the area of 98.


DXY Analysis 4July2023This analysis is still the same as the last analysis, I am still bullish for this analysis. the price is currently at support, with several signs of rejection candles, there is a possibility of continuing the bullish trend again. if the price drops from support, there is a high probability that the price will retest the SnD area below.

DXY Index Next Possible MovePair : DXY ( U.S Dollar ) Index
Description :
Bullish Channel as an Corrective Pattern in Long Time Frame
Completed " ABC " Corrective Wave
Divergence - RSI
Break of Structure
Impulse Correction
Fibonacci Level - 78.60%
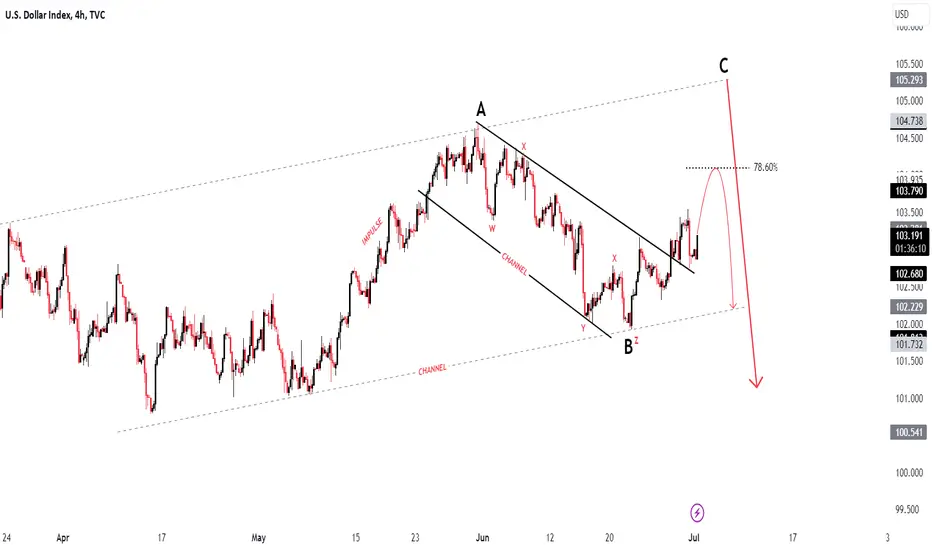
DXY 29June2023DXY analysis is still in accordance with the analysis some time ago, still in the a-b-c correction period. if we pull the fibo extension, from wave a to wave b, we can know the forecast of wave c will end.
fibo extension 1.618 is adjacent to the SnD H4 area. it could be that the price is heading in that direction.

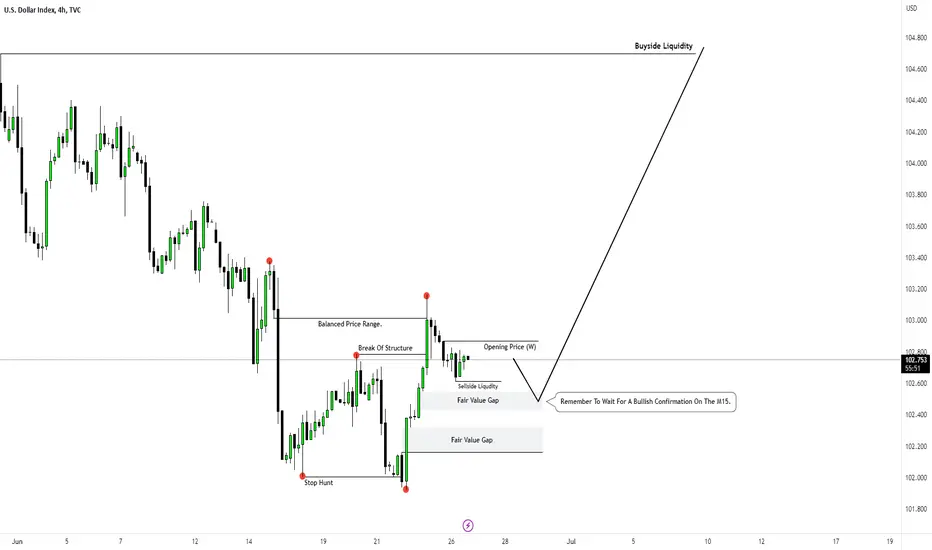
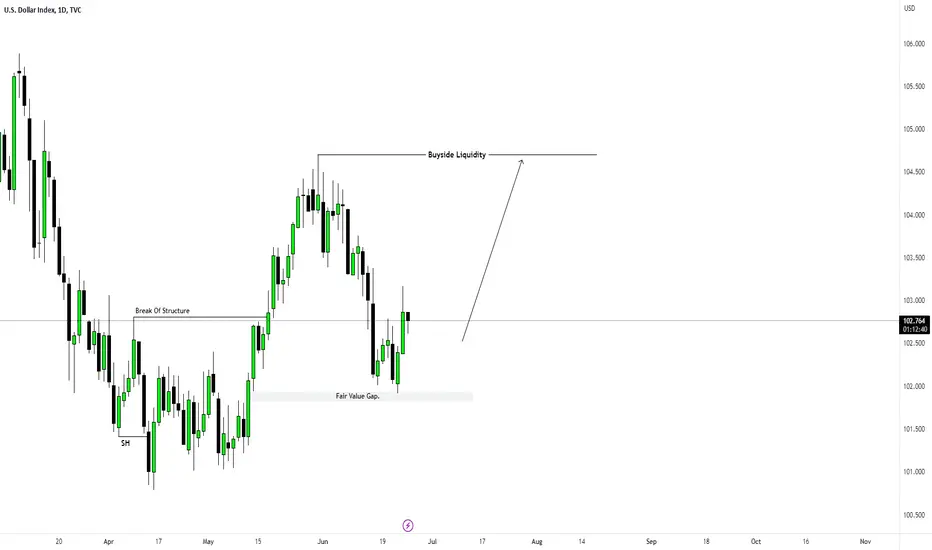
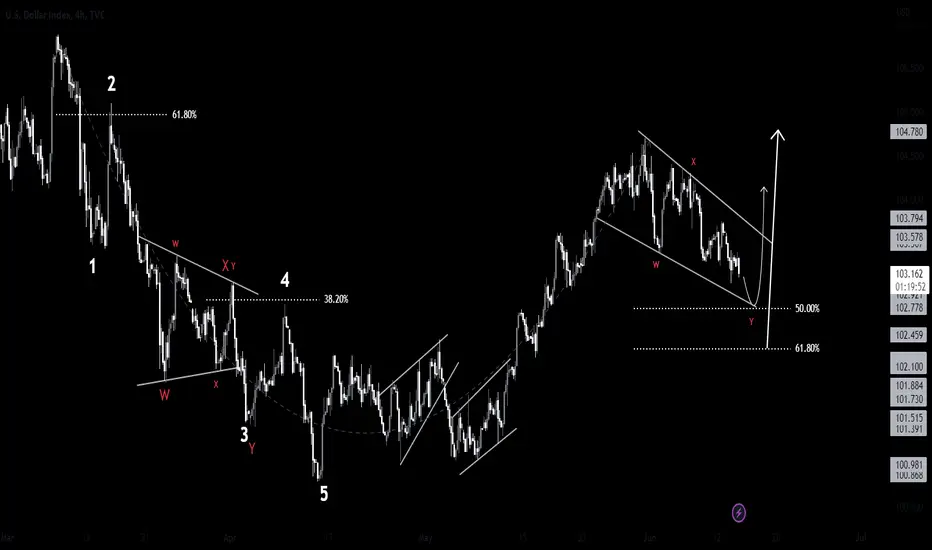
DXYThis Is The Dollar Index On The 4 Hour Time Frame And This Is What I Anticipate To See, Ideally A Sweep Of The Sellside Liquidity Engineered Today Then A Bullish Confirmation On The M15 To Confirm Our Bullish Bias Then We Can See The Dollar Index Rallying To Take The Buyside Liquidity.
DXY DailyThis Is A Simple Anticipation I Have On The Dollar Index, It May Or Not Pan Out But We'll Wait And See, I'll Update You Guys As It Progresses.
DXY 23June2023DXY's journey since the last analysis is still in accordance with the roadmap, now there is a change in the character of the trend. there is a possibility of reversal. the price has broken the trendline resistance and formed a new high.
Currently the price is moving close to SnD and is still held by the trendline, there is a possibility of a retrace. when the price drops but does not fall deeper than the invalid area, then the possibility is positive for bullish.


DXY 16June2023the SnD area is responding positively for now, there are several shadow candles with quite long proportions. if the DXY movement is appropriate then the possibility is that the price for the beginning of next week will be bullish limited to the resistance area.

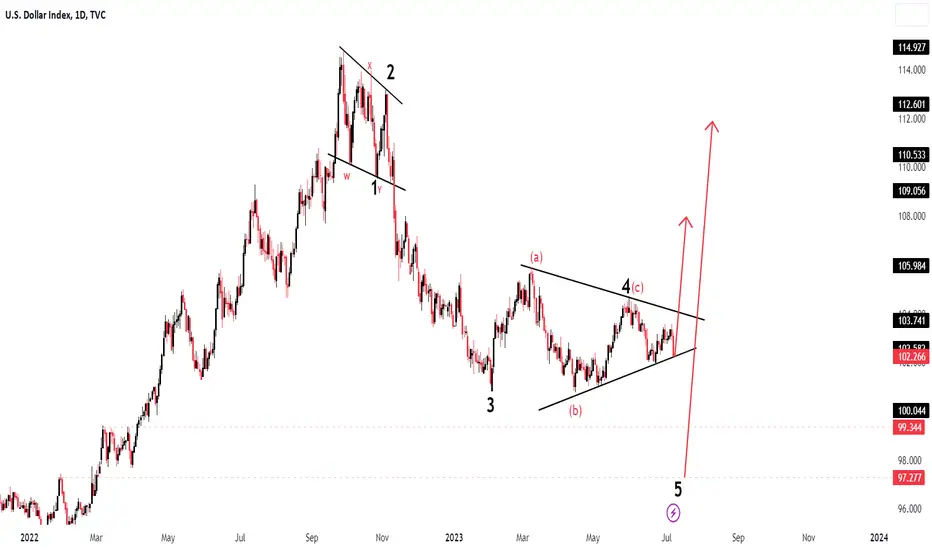
DXY Index Next Possible MovePair : DXY Index
Description :
Completed " 12345 " Impulsive Wave and " ABC " Corrective Wave
RSI - Divergence
Break of Structure
Falling Wedge as an Correction in STF
Fibonacci Level ( 50.00% / 61.80% )
S / R Level
Greenback Runs US Base Currencies!Here's a Billion DXY nugget for all who have an ear to listen: receive: and learn.
The DXY aka Dollar aka GreenBack aka That BULL aka Dolla Dolla will make her Holla : runs US Base Currencies and is Zeus in the markets.
KNOWING this Objective Fact : you can mark up the DXY and trade it against most US Base Pairs especially FX:EURUSD and whichever way the DXY is biased that day then EURUSD will be biased the exact other way within it's own specific buy/sell model and specific buy/sell schematic.
The DXY is Bullish. :)
FX:EURUSD has fallen.
Never over leverage.
Trust your trade set up. Typically most trade take time to manifest. If it doesn't hit your stop let it be.
Continue to have a Great week of trading!!!

DXY 13June2023price touched there SnD where currently seen on h4 there is resistance, is this a sign of reversal? we wait for some more confirmation, is there a positive bullish candle or maybe a rejection candle.
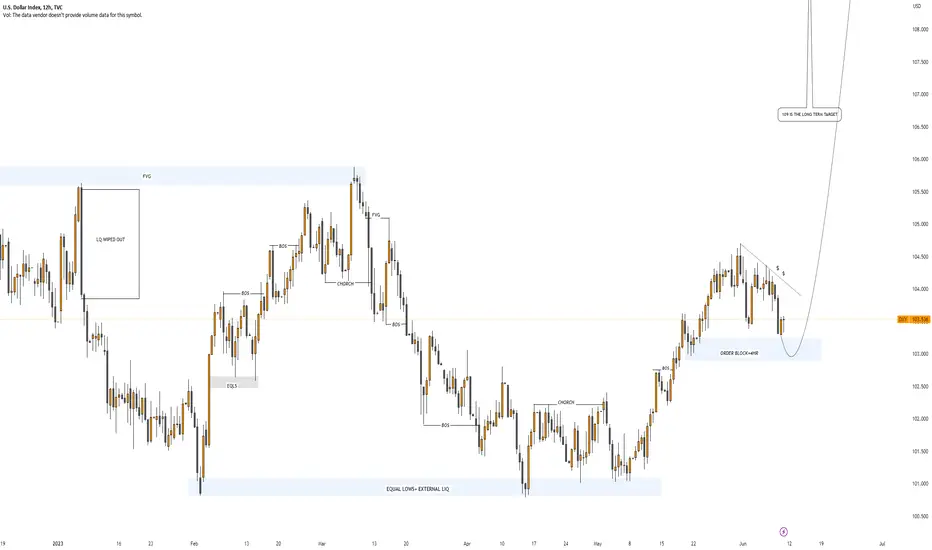
DXY: 109 IS THE NEW TARGETDear Traders, we have a good opportunity of selling XXXUSD pairs and buying USDXXX pairs, as the price currently testing previous LL we are expecting price to bounce from this zone. Let's not miss out on this opportunity.
Good Luck and Trade Safe.