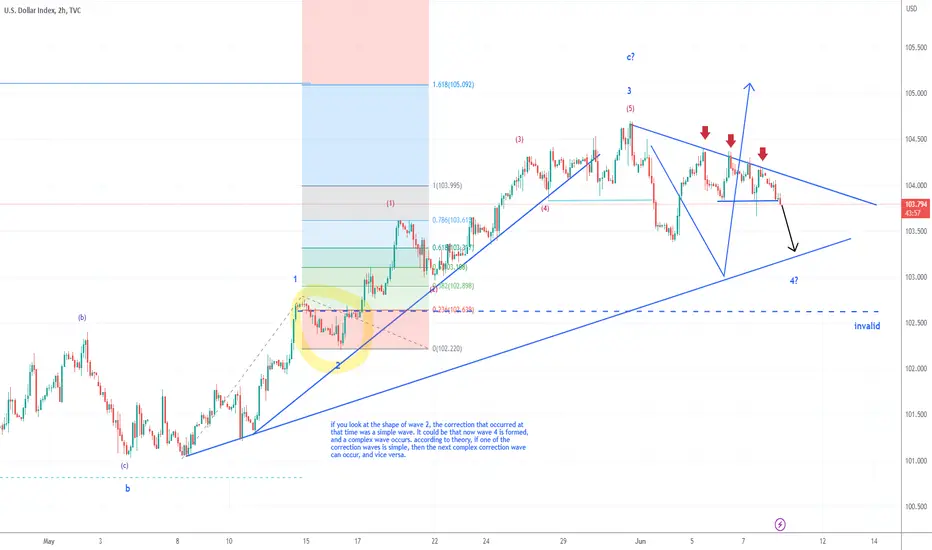
DXY 8June2023Currently the DXY seems to respond positively to the bearish trendline. the price has also broken the support. the next target is the trendline below. there are times when now is wave 4 a complex correction occurs, then we can be prepared that the price can go down quite deep going forward. the invalid area is the limit where this analysis can still be valid. when the price goes down deeper than the invalid area, then it could be that the trend has changed completely to bearish.
Dxysignals
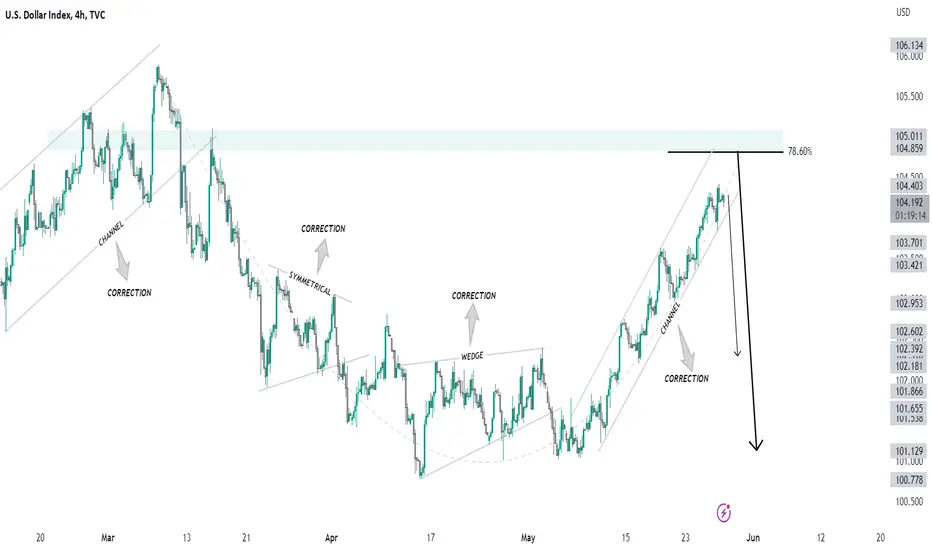
DXY Next Possible MovePair : DXY Index
Description :
Bearish Channel as a Correction in Long Time Frame
Break of Structure
RSI - Divergence
Symmetrical Triangle
Completed " AB " Corrective Wave
Fibonacci Level - 78.60%

DXY long position to the up side liquidity Guess what happens to the related charts 💵🤡
Well I wish you all the best

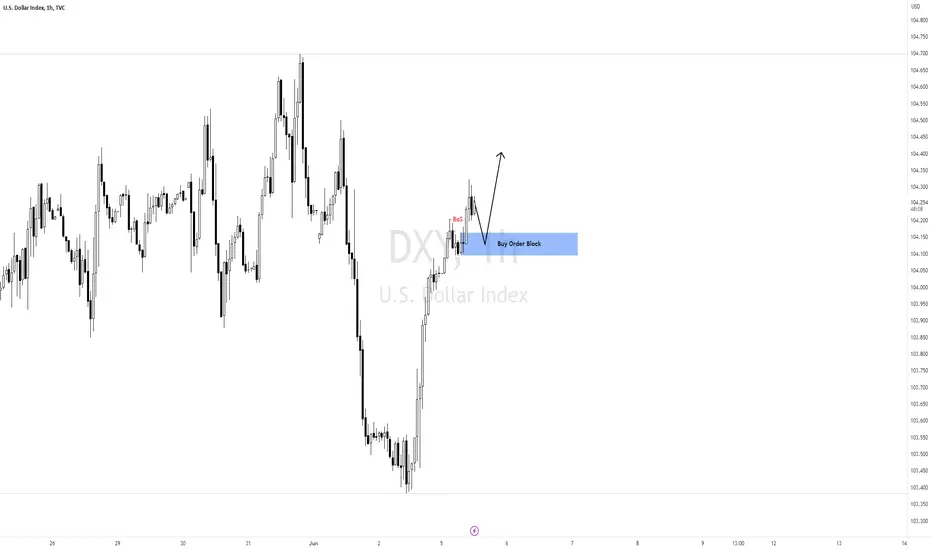
DXY Chart H1Here is my view for DXY on H1. The price could go bullish, you can put a pending order on the Order block or find an entry on LTF within OB Zone. Trade Safe!
DXY Triple bearish rejection. 102.000 by month's end.The U.S. Dollar Index (DXY) had a major Bearish Rejection last week, and the 1W chart perfectly portrays the triple sell signal that just emerged. As you see the price hit and pulled-back off 1) The Lower Highs trend-line of the Descending Triangle pattern, 2) the 0.618 Fibonacci level and 3) the 1W RSI got rejected on its Higher Highs trend-line.
This Triple Rejection is a major medium-term sell signal at least, with the first technical target being the 1W MA100 (green trend-line), which supported the downtrend last time (May 08 candle). The 1W MA50 (blue trend-line) has been the Resistance since the week of December 19 2022. If we get a weekly close below the 100.825 Support, we will re-sell and target the 1W MA200 (orange trend-line) at 98.550 on the long-term.
-------------------------------------------------------------------------------
** Please LIKE 👍, FOLLOW ✅, SHARE 🙌 and COMMENT ✍ if you enjoy this idea! Also share your ideas and charts in the comments section below! **
-------------------------------------------------------------------------------
💸💸💸💸💸💸
👇 👇 👇 👇 👇 👇

DXY-US DOLLAROur last setup on DXY worked out well, we are anticipating this price action as explain on our chart. Even if you use this chart along, you will be able to make good growth.

DXY Time to start selling it. Long-term top is near.We had a good break-out buy signal on the U.S. Dollar Index (DXY) on our last trade ten days ago (see chart below) and despite not having hit our original target, we decide to close the long position:
The reason is that it has reached the Lower Highs 1 trend-line, the first out of two Resistance levels. Our target was the 1.618 Fibonacci extension, where the 1D MA200 (orange trend-line) is expected to make contact with, so that will be our second (and final) sell entry. Pay attention to the 1D RSI also, which turned flat just before getting nearly overbought, same as it did on February 24. Our bearish strategy targets the 1D MA50 (blue trend-line) on the short-term, with a projected contact at 102.650.
-------------------------------------------------------------------------------
** Please LIKE 👍, FOLLOW ✅, SHARE 🙌 and COMMENT ✍ if you enjoy this idea! Also share your ideas and charts in the comments section below! **
-------------------------------------------------------------------------------
💸💸💸💸💸💸
👇 👇 👇 👇 👇 👇

DXY New Week Possible MovePair : DXY Index
Description :
Bullish Channel as an Correction in STF
Fibonacci Level - 78.60%
Break of Structure
S / R Level
RSI - Divergence
Bearish Channel in LTF
DXY 28May2023if elliot's notation is correct, most likely there will be a correction and DXY will continue the bullish trend again, limited to 105,600

DXY 25May2023Currently, DXY has touched the Fibo extension at value 1, meaning that the wave length that occurs is equal to Wave 1. A correction may not take long, but for the medium-term target, DXY can bounce up to Fibo extension 1,618 which is parallel to the high of wave 2.

DXY-IT IS TIME TO SELL XXXUSD PAIRS!Dear traders, hope everyone having a great week, DXY we had a massive sell off due to mostly by economic events came out negative for USDOLLAR. What we are expecting on DXY is to reverse from the current price. Though we have NFP which will be crucial

DXY Don't lose sight of the big picture.The U.S. Dollar (DXY) may be having a green month as we approach its end but this shouldn't make you diverge from the long-term perspective. And as you see, the outlook on the 1M time-frame remains bearish as not only is the price still on Lower Highs since the September but the 1M MACD completed a Bearish Cross this March and we are still far from hitting the 1M MA50 (blue trend-line), which is the first target during trend changes.
The multi-year pattern is (the decade long) Channel Up, so the target can be near its bottom (Higher Lows trend-line) around 96.000 and if a 1M candle closes below it, the we can even target the top of the Pivot Zone at 90.000.
-------------------------------------------------------------------------------
** Please LIKE 👍, FOLLOW ✅, SHARE 🙌 and COMMENT ✍ if you enjoy this idea! Also share your ideas and charts in the comments section below! **
-------------------------------------------------------------------------------
💸💸💸💸💸💸
👇 👇 👇 👇 👇 👇

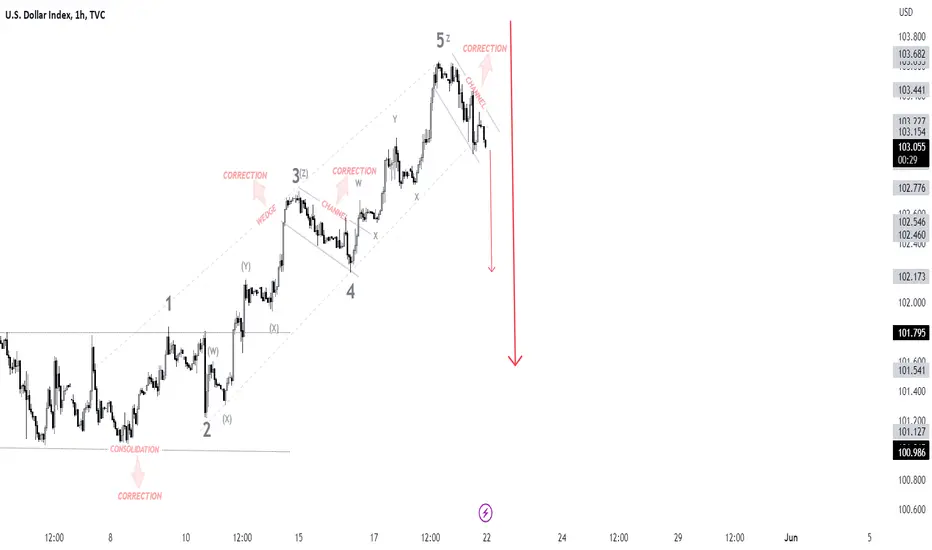
DXY New Week MovePair : DXY Index
Description :
Completed Impulsive Wave " 12345 "
Break of Structure
Divergence
Break of Structure
Impulse Correction
Bullish Channel as an Correction in STF
DXY Will keep rising until it tests the 1D MA200.The U.S. Dollar Index (DXY) has found itself rebounding, many months after the huge sell signal we gave last September (chart below):
The price rebound on the 100.790 Support that was first formed on the February 02 Low and is now above the 1D MA50 (blue trend-line). The 1D RSI symmetry with the February rise, hints that the price may rise as high as the 1.618 Fibonacci extension. That is above the Lower Highs trend-line and below the 105.885 Resistance but is projected to make or almost make direct contact with the 1D MA200 (orange trend-line). That is an excellent medium-term target, we are aiming at 105.000 to lower the risk. Note that the 1D MA200 has been intact since December 07 2022, so a rejection near it will be a strong sell opportunity.
-------------------------------------------------------------------------------
** Please LIKE 👍, FOLLOW ✅, SHARE 🙌 and COMMENT ✍ if you enjoy this idea! Also share your ideas and charts in the comments section below! **
-------------------------------------------------------------------------------
💸💸💸💸💸💸
👇 👇 👇 👇 👇 👇

DXY 18May2023The mid-week DXY looks in accordance with the initial analysis, experiencing bullish entry into the impulse wave, if now is the period of wave C, and wave C usually consists of 5 waves, then wave 3 has at least the same length as wave 1. we can estimate the movement of the wave 3 using the Fibo Extension.

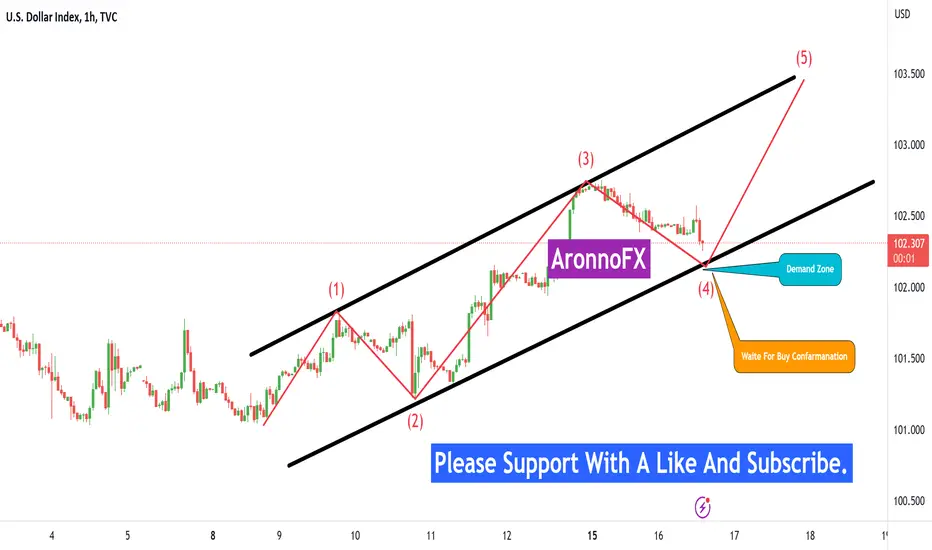
Dollar Index Chart View
AronnoFX will not accept any liability for loss or damage as a result of
reliance on the information contained within this channel including
data, quotes, charts and buy/sell signals.
If you like this idea, do not forget to support with a like and follow.
Traders, if you like this idea or have your own opinion about it,
write in the comments. I will be glad.
DXY Next MovePair : DXY Index
Description :
Bearish Channel as an Correction in Long Time Frame with the Breakout of the Upper Trend Line
Completed " 12345 " Impulsive Wave and " ABC " Corrective Wave
Break of Structure
Divergence - RSI
Symmetrical Triangle in STF with Breakout and Retracement

Dollar Index Chart Analysis....
In this situation, DXY chart creates ab=cd Pattern. So,if a breakout market 101:000 support level is then market sell to the nearest 100.800 and 100.230 support levels. If breakout 101.700 resistance level is, then the market will go up 102 resistance level.
AronnoFX will not accept any liability for loss or damage as a result of
reliance on the information contained within this channel including
data, quotes, charts and buy/sell signals.
If you like this idea, do not forget to support with a like and follow.
Traders, if you like this idea or have your own opinion about it,
write in the comments. I will be glad.

DXY New Week Possible MovePair : DXY Index
Description :
Bullish Channel in Long Time Frame as an Corrective Pattern
Completed " abc " Corrective Wave
Divergence
Impulse Correction
Break of Structure
Rejection from Fibonacci Level - 61.80%
Double Bottom
Bearish Channel in STF

DXY index 03 May MovePair : DXY Index
Description :
Falling Wedge as an Corrective Pattern in Long Time Frame with the Breakout of the UTL
Break of Structure
RSI - Divergence
Completed " ABC " Corrective Wave
Bullish Channel
Rising Wedge in Short Time Frame with the Breakout of the LTL

Intraday SELL dxy (01 MAY 2023)DXY intraday trading alert
3 simple steps to find a quality setup !
Risk Reward Ratio 1: 2
Anyone same idea with me?
SELL DXY
Good luck traders..

DXYDXY is ready to BUY. there is important price for it and i think 102.00 is very important. if tonight the price will close upper than 102.00, monthly and weekly candles shape show us good signal, in daily and 4H first top line will break, and all the reasons show us powerful signal to BUY. It can change all of markets.

DXY Next MovePair : DXY Index
Description :
Bearish Channel in Long Time Frame as an Corrective Pattern with the Breakout of the Upper Trend Line
Divergence
Break of Structure
Completed " 12345 " Impulsive Wave and making its Correction " ABC "
Bearish Channel in STF
