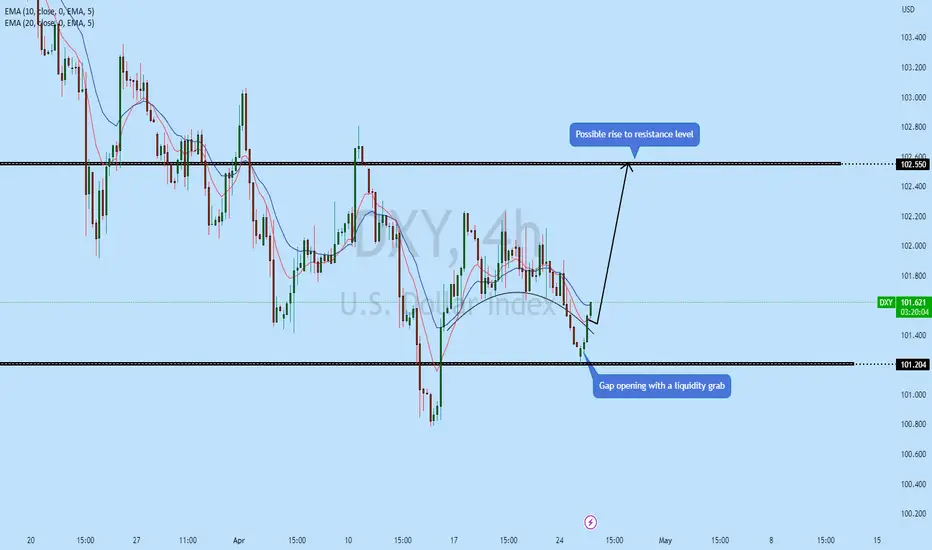
DXY may have reversed!!Currency Pair : DXY
Possible direction : Bullish
Technical Analysis : Price just has opened with gap and slowly turning into a bullish market after forming a middle man in the previous session. From monthly price has just bounced from the monthly support zone.
Fundamental : Positive ADP Non-Farm Employment change data has given a strong boost on USD
Possible trade recommendation : Bearish as per chart sketch
Press like button if you enjoy.
Risk Disclaimer: Trading foreign exchange on margin carries a high level of risk, and is not suitable for all investors. Past performance is not indicative of future results. The high degree of leverage is dangerous and can work against you as well as for you. Before deciding to invest in foreign exchange or any market you should carefully consider your investment goals, level of experience, and risk tolerance. It is EXTREMELY LIKELY that you will sustain a loss of some or all of your initial investment and therefore you should not invest money that you cannot afford to lose. No representation is being made that any account will or is likely to achieve profits or losses. Past performance is not indicative of future results. Individual results vary and no representation is made that clients will or are likely to achieve profits or incur losses comparable to those that may be shown. You acknowledge and agree that no promise or guarantee of success or profitability has been made between you, and Forex Trading Wizard. Do your own research and talk to a professional financial planner in order to be aware of all the risks associated with foreign exchange trading and investing and seek advice from an independent financial advisor before risking any capital.
Dxysignals
DXY New Week Possible MovePair : DXY Index
Description :
Bearish Channel in Long Time Frame as an Corrective Pattern
Divergence
Completed " 12345 " Impulsive Wave
Break of Structure
Consolidation Phase

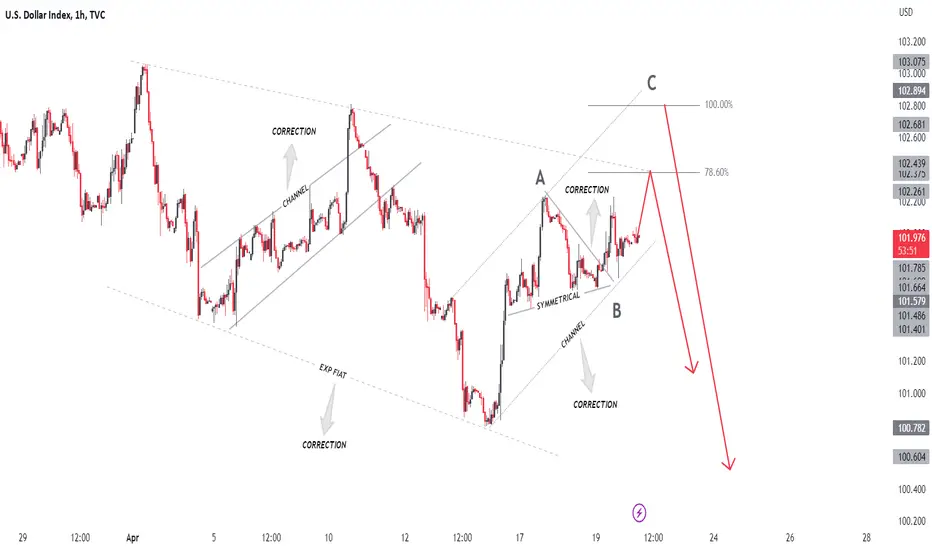
DXY Index Next Possible MovePair : DXY Index
Description :
Divergence
EXP Fiat as an Corrective Pattern in Long Time Frame
Completed " 1234 " Impulsive Wave
Break of Structure
Symmetrical Triangle
Completed " ABC " Correction in Short Time Frame
Bullish Channel as Correction in STF
Rejection from Upper Trendline or Fibonacci Level ( 78.60% - 100% )
DXY Next Possible MovePair : DXY Index
Description :
Break of Structure
Divergence
Bearish Channel in Long Time Frame as an Corrective Pattern
Completed the " ABC " Corrective Wave
Bullish Channel in Short Time Frame
CHOCH

DXY could be starting a bullish reversal.The U.S. Dollar Index (DXY) is rebounding aggressively today after holding the 100.815 Support (February 02 Low), on the strongest 4H candle so far in a month. It remains below both the 4H MA50 (blue trend-line) and 4H MA100 (green trend-line), trading inside both a core Channel Down (blue) and a Diverging Channel Down (dotted).
The very same pattern was seen prior to the February 02 Low. The Ichimoku Clouds are identical as well as the RSIs, which after Lower Lows formed a Double Bottom and rebounded. If the price breaks above the top of the Diverging Channel Down, then we will most likely see a rally extension to the 0.618 Fibonacci at 103.950. If rejected, we will resume selling and target 100.450.
-------------------------------------------------------------------------------
** Please LIKE 👍, FOLLOW ✅, SHARE 🙌 and COMMENT ✍ if you enjoy this idea! Also share your ideas and charts in the comments section below! **
-------------------------------------------------------------------------------
💸💸💸💸💸💸
👇 👇 👇 👇 👇 👇

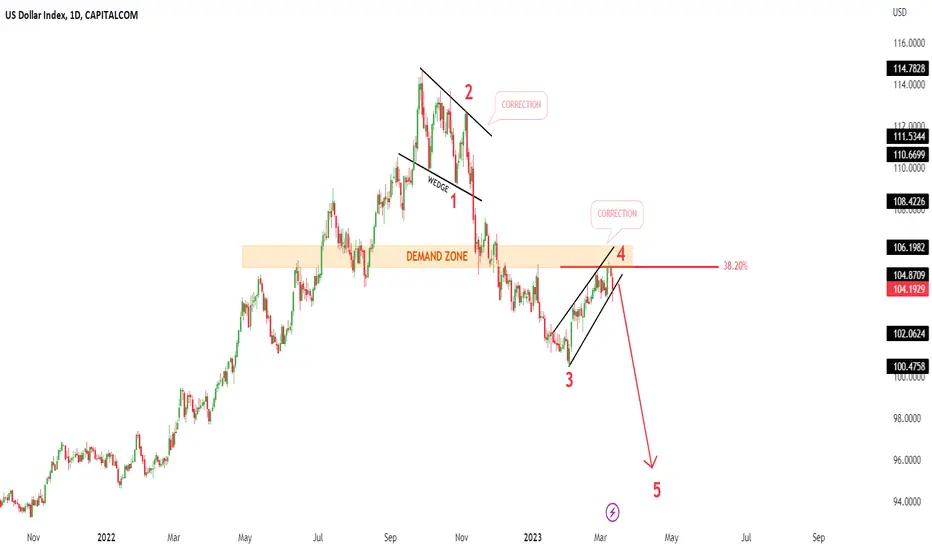
USDX(Dollar) Must Continue To Extend LowerTechnical Analysis:
- As you can see the above daily chart, USDX is still doing a ABC correction in blue
- We present two possible paths - Black and Blue ( With actual data each path has 50% probability )
- The decision of both paths (Black and Blue) will be taken when USDX will arrive to the orange circle area
- Short term structure is bearish
- H1 Right Side is down
- H4 Right Side is turning down
Technical Information:
- Don't buy USDX (Dollar) now in short term
- We like to buy when wave C in blue and wave 4 in black are completed

DXY Index Next MovePair : Index DXY ( U.S Dollar )
Description :
Falling Wedge as an Corrective Pattern in Long Time Frame
Divergence
Completed " 1234 " Corrective Waves
Symmetrical Triangle in Short Time Frame
Break of Structure
Double Bottom Possible

Time comes for USD to dieWe completed wave two of wave c and now we are in wave 3 of c and it will Be hard movements so keep your eyes opining and see what will happens.

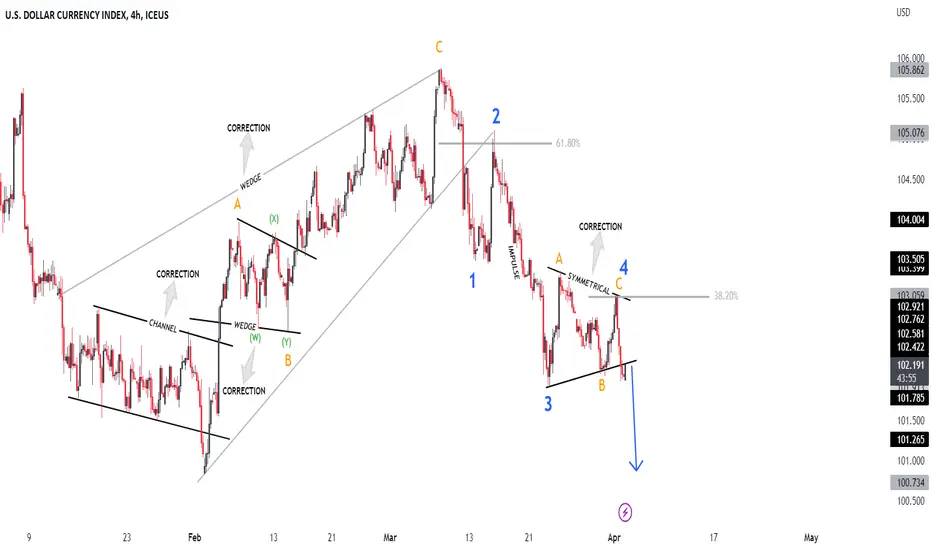
DXY 04 April Next MovePair : DXY Index
Description :
Rising Wedge as an Corrective Pattern in Long Time Frame as an Corrective Pattern with the Breakout of the Lower Trend Line
Selling Divergence
Completed " 1234 " Impulsive Wave
Break of Structure
Symmetrical Triangle in Short Time Frame and Breakout the LTL and Completed the Retracement
Impulse Correction
Rejection from Fibonacci Level - 38.20%
DXY Index New Week Possible MovePair : DXY Index
Description :
Bearish Channel as an Correction in Short Time Frame and Long Time Frame
Impulse Correction Impulse
Divergence
Completed " 12345 " Impulsive Wave and " ABC " Corrective Wave
Rejecting from the Fibonacci Level - 78.60%
Break of Structure

DXY Index NEXT MovePair : DXY Index
Description :
Exp FIAT as an Corrective Pattern in LTF as an Correction
Break of Structure
Symmetrical Triangle with the Breakout of LTL in STF
Divergence
Completed " 1234 " Impulsive Wave

DXY LTF updateExpecting to fill the GAP soon... Then we will see from there how the market reacts to that...

DXY Index Next Possible MovePair : DXY Index
Description :
Rising Wedge as an Corrective Pattern in Long Time Frame as an Correction with the Breakout of the Lower Trend Line and Retracement
Divergence
Break of Structure
Completed " 1234 " Impulsive Wave at Fibonacci level - 38.20%
Exp FIAT as an Correction in Short Time Frame and Rejection from the Lower Trend Line and Fibonacci Level - 78.60%
Impulse Correction Impulse

DXY one last leg down then continuation for new highsHi there,
DXY is setting up for one last drop to finish 4 wave before it resumes the uptrend, We have a rising wedge on 4h, after breakdown dxy will melt
Good luck with your trades

DXY New Week Possible MovePair : DXY Index
Description :
Symmetrical Triangle as an Correction in Long Time Frame with the Breakout and Retracement
Impulse Correction
Breakout the S / R Level or Break of Structure
Divergence
Completed " ABC " Corrective Wave
Bullish Channel

DXY Chart Analysis....
AronnoFX will not accept any liability for loss or damage as a result of
reliance on the information contained within this channel including
data, quotes, charts and buy/sell signals.
If you like this idea, do not forget to support with a like and follow.
Traders, if you like this idea or have your own opinion about it,
write in the comments. I will be glad.

DXY Index Next MovePair : DXY Index
Description :
Rising Wedge as an Corrective Pattern in Long Time Frame and Breakout the Lower Trend Line and Retracement
Break of Structure
Completed " ABC " Corrective Wave
Falling Wedge in Short Time
Divergence
Impulse Correction

DXY Huge H&S about to break downwards aggressivelyThe U.S. Dollar Index (DXY) has hit our first short-term target as presented on our most recent analysis:
The major news however is that it failed to break above its 1W MA50 (blue trend-line) where in fact it got rejected last week. This validates the giant Head and Shoulders (H&S) idea we discussed in the past, which is now targeting the 1W MA200 (orange trend-line) and Support Zone 2 at 98.300.
-------------------------------------------------------------------------------
** Please LIKE 👍, FOLLOW ✅, SHARE 🙌 and COMMENT ✍ if you enjoy this idea! Also share your ideas and charts in the comments section below! **
-------------------------------------------------------------------------------
💸💸💸💸💸💸
👇 👇 👇 👇 👇 👇

Intraday BUY DXY (16 MAR 2023)DXY intraday trading alert
3 simple steps to find a quality setup !
Risk Reward Ratio 1: 2
Anyone same idea with me?
BUY DXY
Good luck traders..

DXY Next Possible MovePair : DXY Index
Description :
Bearish Channel as an Corrective Pattern in Short Time Frame
Divergence
Break of Structure
Completed " 12345 " Impulsive Wave and " AB " Corrective Wave
Impulse Correction
Rising Wedge as an Corrective Pattern and Breakout the Lower Trend Line and Completed the Retracement

Dollar Index Chart Analysis....
In this situation DXY Short time chart create Bearish BAT Pattern. So, market
short term Buy UP to 104:930; and 105:100 resistance level. Then market need long
sell correction to nearest Support 103.700 and 103.400 level.
AronnoFX will not accept any liability for loss or damage as a result of
reliance on the information contained within this channel including
data, quotes, charts and buy/sell signals.
If you like this idea, do not forget to support with a like and follow.
Traders, if you like this idea or have your own opinion about it,
write in the comments. I will be glad.

DXY Index New Week Move Pair : DXY Index
Description :
Rising Wedge as an Corrective Pattern in Short Time Frame and Breakout the Lower Trend Line
Divergence
Rejecting from the Daily Demand Zone
Break of Structure
Completed " 1234 " Impulsive Wave at Fibonacci Level - 38.20%
DXY top-down analysisHello traders, this is a complete multiple timeframe analysis of this pair. We see could find significant trading opportunities as per analysis upon price action confirmation we may take this trade. Smash the like button if you find value in this analysis and drop a comment if you have any questions or let me know which pair to cover in my next analysis.
