DXY USD INDEX FORECAST Q2 W18 Y25DXY USD INDEX FORECAST Q2 W18 Y25
Professional Risk Managers👋
Welcome back to another FRGNT chart update📈
Diving into some Forex setups using predominantly higher time frame order blocks alongside confirmation breaks of structure.
✅ U.S. dollar index is a measure of the value of the dollar against a basket of six foreign currencies.
✅The currencies are the Euro, Swiss franc, Japanese yen, Canadian dollar, British pound, and Swedish krona.
💡Here are some trade confluences📝
✅ Break an d close below July 2023 key 100.00 levels.
✅ Foresee a pull back to, weekly imbalance, daily order block, daily 50ema, weekly order block and or weekly 50 ema.
✅ Awaiting to identify a significant break of structure bullish to use the DXY as confluence for our trading week 18 of Q2 toward key points of interest mentioned above.
✅ Forecasting continued bearish pressure long term.
✅Initially bullish outlook however upon price turn around. DXY to break 100.000 level again.
🔑 Remember, to participate in trading comes always with a degree of risk, therefore as professional risk managers it remains vital that we stick to our risk management plan as well as our trading strategies.
Pairs to look out for -
EURUSD
USDCHF
USDJPY
USDCAD
GBPUSD
📈The rest, we leave to the balance of probabilities.
💡Fail to plan. Plan to fail.
🏆It has always been that simple.
❤️Good luck with your trading journey, I shall see you at the very top.
🎯Trade consistent, FRGNT X
Dxysignals

DXY "Dollar Index" Market Bullish Heist Plan (Day or Swing)🌟Hi! Hola! Ola! Bonjour! Hallo! Marhaba!🌟
Dear Money Makers & Robbers, 🤑 💰💸✈️
Based on 🔥Thief Trading style technical and fundamental analysis🔥, here is our master plan to heist the DXY "Dollar Index" Market. Please adhere to the strategy I've outlined in the chart, which emphasizes long entry. Our aim is the high-risk ATR Line. Risky level, overbought market, consolidation, trend reversal, trap at the level where traders and bearish robbers are stronger. 🏆💸"Take profit and treat yourself, traders. You deserve it!💪🏆🎉
Entry 📈 : "The heist is on! Wait for the MA breakout (99.900) then make your move - Bullish profits await!"
however I advise to Place Buy stop orders above the Moving average (or) Place buy limit orders within a 15 or 30 minute timeframe most recent or swing, low or high level for Pullback entries.
📌I strongly advise you to set an "alert (Alarm)" on your chart so you can see when the breakout entry occurs.
Stop Loss 🛑: "🔊 Yo, listen up! 🗣️ If you're lookin' to get in on a buy stop order, don't even think about settin' that stop loss till after the breakout 🚀. You feel me? Now, if you're smart, you'll place that stop loss where I told you to 📍, but if you're a rebel, you can put it wherever you like 🤪 - just don't say I didn't warn you ⚠️. You're playin' with fire 🔥, and it's your risk, not mine 👊."
📍 Thief SL placed at the nearest/swing low level Using the 1H timeframe (98.900) Day / Swing trade basis.
📍 SL is based on your risk of the trade, lot size and how many multiple orders you have to take.
🏴☠️Target 🎯: 101.400 (or) Escape Before the Target
🧲Scalpers, take note 👀 : only scalp on the Long side. If you have a lot of money, you can go straight away; if not, you can join swing traders and carry out the robbery plan. Use trailing SL to safeguard your money 💰.
💰💵💸DXY "Dollar Index" Market Heist Plan (Swing/Day Trade) is currently experiencing a Bullish trend.., driven by several key factors.☝☝☝
📰🗞️Get & Read the Fundamental, Macro, COT Report, Geopolitical and News Analysis, Sentimental Outlook, Intermarket Analysis, Index-Specific Analysis, Future trend targets with Overall outlook score... go ahead to check 👉👉👉🔗🔗
⚠️Trading Alert : News Releases and Position Management 📰 🗞️ 🚫🚏
As a reminder, news releases can have a significant impact on market prices and volatility. To minimize potential losses and protect your running positions,
we recommend the following:
Avoid taking new trades during news releases
Use trailing stop-loss orders to protect your running positions and lock in profits
💖Supporting our robbery plan 💥Hit the Boost Button💥 will enable us to effortlessly make and steal money 💰💵. Boost the strength of our robbery team. Every day in this market make money with ease by using the Thief Trading Style.🏆💪🤝❤️🎉🚀
I'll see you soon with another heist plan, so stay tuned 🤑🐱👤🤗🤩

DXY / Dollar Index Market Heist Plan (Scalping/Day)🌟Hi! Hola! Ola! Bonjour! Hallo! Marhaba!🌟
Dear Money Makers & Robbers, 🤑 💰💸✈️
Based on 🔥Thief Trading style technical and fundamental analysis🔥, here is our master plan to heist the DXY / Dollar Index Market. Please adhere to the strategy I've outlined in the chart, which emphasizes long entry. Our aim is the high-risk ATR Zone. Risky level, overbought market, consolidation, trend reversal, trap at the level where traders and bearish robbers are stronger. 🏆💸"Take profit and treat yourself, traders. You deserve it!💪🏆🎉
Entry 📈 : "The heist is on! Wait for the MA breakout (103.300) then make your move - Bullish profits await!"
however I advise to Place Buy stop orders above the Moving average (or) Place buy limit orders within a 15 or 30 minute timeframe most recent or swing, low or high level.
📌I strongly advise you to set an "alert (Alarm)" on your chart so you can see when the breakout entry occurs.
Stop Loss 🛑: "🔊 Yo, listen up! 🗣️ If you're lookin' to get in on a buy stop order, don't even think about settin' that stop loss till after the breakout 🚀. You feel me? Now, if you're smart, you'll place that stop loss where I told you to 📍, but if you're a rebel, you can put it wherever you like 🤪 - just don't say I didn't warn you ⚠️. You're playin' with fire 🔥, and it's your risk, not mine 👊."
📍 Thief SL placed at the recent/swing low level Using the 1H timeframe (101.700) Day / Scalping trade basis.
📍 SL is based on your risk of the trade, lot size and how many multiple orders you have to take.
🏴☠️Target 🎯: 105.000 (or) Escape Before the Target
💰💸💵DXY / Dollar Index Market Heist Plan (Scalping / Day Trade) is currently experiencing a bullishness,., driven by several key factors.👇👇👇
📰🗞️Get & Read the Fundamental, Macro, COT Report, Quantitative Analysis, Sentimental Outlook, Intermarket Analysis, Future trend targets..., go ahead to check 👉👉👉🔗
⚠️Trading Alert : News Releases and Position Management 📰 🗞️ 🚫🚏
As a reminder, news releases can have a significant impact on market prices and volatility. To minimize potential losses and protect your running positions,
we recommend the following:
Avoid taking new trades during news releases
Use trailing stop-loss orders to protect your running positions and lock in profits
💖Supporting our robbery plan 💥Hit the Boost Button💥 will enable us to effortlessly make and steal money 💰💵. Boost the strength of our robbery team. Every day in this market make money with ease by using the Thief Trading Style.🏆💪🤝❤️🎉🚀
I'll see you soon with another heist plan, so stay tuned 🤑🐱👤🤗🤩

DXY Bullish Reversal Setup – Long Entry from Support Zone TowardEMA 30 (Red Line): Currently at 99.700 — tracks short-term trend, and price is hovering near this level.
EMA 200 (Blue Line): At 100.935 — indicates long-term trend, acting as dynamic resistance above.
📈 Trade Setup
✅ Entry Point:
Price: 99.699
Rationale: This level has been tested multiple times, forming a support zone. A bounce here signals a potential long entry.
🎯 Target Point (Take Profit):
Price: 102.738
Distance: ~3.04 points or 3.43% potential move upward.
Note: Marked as EA TARGET POINT, which suggests a calculated area possibly based on previous resistance or algorithmic strategy.
🛑 Stop Loss:
Price: 98.624
Reasoning: Just below the defined support zone (highlighted purple area), ensuring protection against downside breakouts.
📊 Risk-to-Reward Ratio
Entry: 99.699
Target: 102.738 → Gain of ~3.04
Stop: 98.624 → Risk of ~1.08
R/R Ratio: ~2.8:1 — favorable setup
📌 Overall Sentiment
This chart indicates a bullish reversal setup from a strong support zone, possibly targeting a mean reversion or trend reversal toward the 200 EMA and beyond.
However, keep in mind:
The price is currently below both EMAs, so the trend is still bearish.
The trade is counter-trend, relying on support holding and momentum shifting.

DXYDXY Index
- Completed " 12345 " Impulsive Waves
- Break of Structure
- RSI - Divergence
- Bullish Channel as an corrective pattern in Short Time Frame
- Support Level

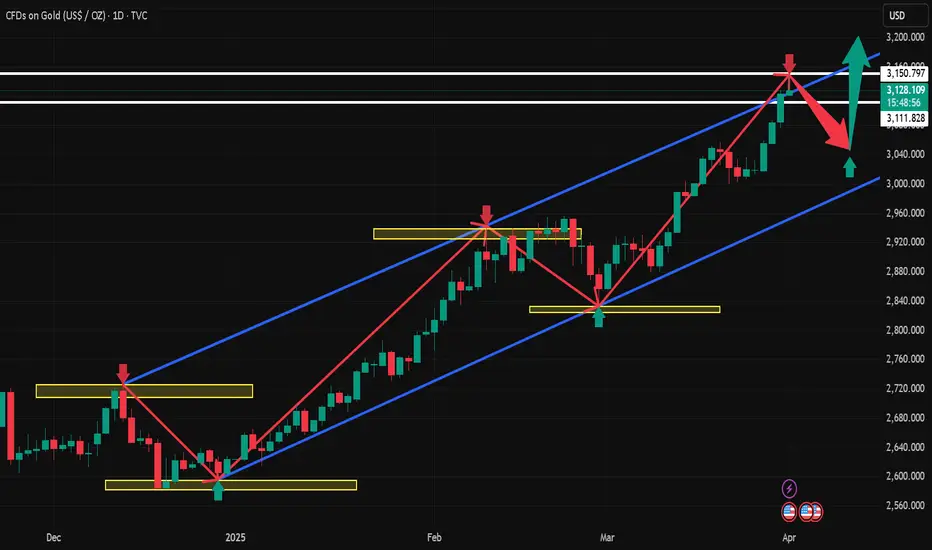
4.9 Technical analysis of short-term gold operations!Gold market analysis
Gold idea: We need to pay attention to whether the daily line will rise after reaching a low. The daily line is hovering at the bottom. In a volatile market, we must find a range of volatility. Finding the rhythm is the most important thing. Yesterday, the daily line formed a cross star again. Today, the white market is expected to fluctuate. In addition, there are many fundamentals in the near future. The market has been led by the rhythm. Gold rose well before. The sharp drop was also due to Trump’s tariff policy. The global tariff war is inevitable in the future. It will support the US dollar in the long term and suppress gold. The short-term top of the weekly line may be a long-term top.
Today’s idea: Let’s focus on the 2969-3022 volatility range. If the white market rebounds first and approaches 3022, go short first. On the contrary, if gold breaks and stands on 3022, it will also fluctuate, but the center of gravity of the volatility will rise to the 3000-3055 range. The volatility requires patience to wait for the position, and waiting is also part of the transaction.
Support level: 2990-2969,
Pressure: 3022 3035

4.8 Technical analysis of short-term gold operations!Spot gold rebounded slightly during the Asian session on Tuesday (April 8), once rising above the 3,000 mark, and is currently trading around $2,995.51 per ounce. Spot gold may rebound to $3,049 per ounce, as the price has previously completed a five-wave cycle starting from $3,168.
Analysts pointed out that the peak of wave d is around $3,049, which can be used as a rebound target. It is still difficult to judge whether this cycle is an impulse wave cycle or a correction wave cycle.
If it is an impulse wave cycle, it means that the downward trend will extend to well below $2,950. The correction wave cycle shows that despite the sharp drop from $3,168, the upward trend from $2,831 remains intact.
The information shown on the daily chart is very clear. The sharp drop in the past few days seems to be driven by wave (4), which may end near the strong support level of $2,970. The next wave (5) will push the upward trend above $3167.
Resistance level: 3015----3038-----3050
Pressure level: 3000---29833-----2970

4.8 Interpretation of gold short-term operation ideasGold price has fallen below the previous row support band in the daily trend. The K-line continues to be under pressure from the short-term moving average and maintains a weaker trend of shock. In the short term, pay attention to the pressure band around 3030. In the 4-hour level trend, the K-line is currently under pressure from the short-term moving average and is maintaining a low-level shock repair. The strength and continuation of the intraday rebound are not too large. Pay attention to the continued downward trend after a small break in the 4-hour level trend. At present, after continuous shocks in the small-level cycle trend, the technical pattern has begun to gradually adjust. The K-line has begun to slowly stand on the short-term moving average and tends to have a certain rebound space in the short-term trend. Pay attention to the short-term adjustment.
Operational suggestions:
Short near 3017-8, stop loss 3023.9, or long near 2945-6, stop loss 2939.1.
Real-time market intraday guidance.
We will update regularly every day to introduce to you how we manage active ideas and settings. Thank you for your likes, comments and attention. Thank you very much

4.7 Interpretation of gold short-term operation ideas! US market4.7 Interpretation of gold late trading operation ideas:
Falling more than 70 points in the morning, it quickly rebounded and reversed! How will gold evolve tonight?
This V-reversal market frequently appears in these three trading days. It is difficult for us to encounter it once or twice a month. This increases the risk of trading. Once you make a mistake, it will be a reversal of dozens of points! When trading, you must strictly use the "stop loss".
We note that the three V-reversals in this stage have common characteristics. The stop in the last trading intensive period means that "3130" can be used as a reference for stage support and pressure. Then these three are: 3130, 3050, 2970---2980
The decline caused by the backlog of sell orders and insufficient liquidity! For gold, it will cause multiple stimulations, panic selling, and funds leaving the market for a short time to avoid risks. Selling gold to fill the gap in other markets and many other factors, and the central banks around the world that intend to reserve gold will not wait! They will still buy strategically, so the trend determines that the decline is limited.
2880 and 2630 are the two main observation positions.
After the small-cycle funds rebounded in the morning, the market entered a triangular consolidation state, the highs were gradually decreasing, and the lows were flattening. This is an obvious sign of market wait-and-see sentiment. The probability of a V-reversal phase or a continuous unilateral trend in the evening increased! If you follow this logic, gold should be under pressure around 3035-3038 during the rebound phase of 16-18 points!
And then continue to fall. Of course, if the EU further expresses its tariffs! It may cause the short-term volatility of the market to intensify!
Any unilateral trend needs to be confirmed in the US market. In the evening, whether it is a V-reversal from north to south or a continuation of the Asian and European market, it is normal. The overall framework will not deviate from the framework of 3130, 3050, 2980!
We will update regularly every day to introduce to you how we manage active ideas and settings. Thank you for your likes, comments and attention. Thank you very much

4.7 Gold short-term operation technical strategyLast week, gold and Dow Jones started to plummet across the board, and the short-selling of the band was a carnival. First of all, our initial short-selling target of 38,500 under the Dow Jones 45,000 has been completed. The only key support is the 36,300 line, and gold has also fallen to the 2970 line. There is no bottom at present, but there is a rebound in the key support level, so don't chase the low in the morning! From the closing point of view, the weekly line finally closed with a long upper shadow line and a quasi-inverted hammer pattern. After the end of this pattern, the market has been in the short stage this week. The intraday rebound is still mainly high-altitude. The market has a large amplitude, and the small stop loss has lost its meaning. At this time, the entry position is very important. In terms of points, the intraday rebound 3045-55 area continues to be high-altitude.
Short-term support: 3038, 3018, 2980, 2960
Do a good job of pushing the position protection! ! !

Non-agricultural gold is expected to fall sharply. On Friday (April 4), at 20:30 Beijing time, the U.S. Bureau of Labor Statistics released the highly anticipated March non-farm payrolls report, which put pressure on gold.
Fundamentals: Today, gold is expected to fall sharply. The market continues to short at resistance points.
Market volatility is expected to increase during the period. The long-short game of the US dollar index near the 102 mark will determine whether it can continue to rise. If it breaks through 103, it may further suppress gold and non-US currencies. Gold is looking for direction in the range of 3080-3100 US dollars/ounce. If risk aversion picks up, it may retest the 3100 mark; on the contrary, if the US dollar continues to strengthen, breaking through 3080 will open up downside space. The decline in US stock futures may continue until early next week.

4.5 Gold falls off a cliff and waits to stabilize! ! !Gold 4-hour level: The last wave of pull-up started from the low point of 2999 to 3167. Yesterday, it fell back and tested the 618 split position 3063. The current support is still valid, which is also the MA66 day position; From the perspective of macd, it is still short-selling and has not been fully repaired. Wait until it crosses below the zero axis, and then slowly stabilizes and tends to golden cross in the future market, then a wave of trend pull-up will gradually form, and it will take time; if 3063 cannot be maintained, the two split positions below are 3035 and 3018, and attention should be paid to stabilization.
Intraday support: 3035 3018 3005
Resistance: 3045 3070 3100

DXY:Today's trading strategyTrump's announced comprehensive tariff plan has triggered global attention. As for the U.S. Dollar Index, on Thursday, the price of the U.S. Dollar Index generally showed a significant downward trend. On that day, the price rose to a high of 103.931 at most, dropped to a low of 101.232, and closed at 101.937.
Looking back at the performance of the U.S. Dollar Index price on Thursday, after the opening in the morning, the price continued to decline in the short term. Subsequently, the price remained weak all the way with almost no rebound. It underwent short-term oscillatory consolidation and finally closed with a large bearish candlestick on the daily chart. For now, pay attention to the resistance in the 102.80 area and the level of 102.40, and keep a continuous watch for further bearish pressure.
Trading Strategy:
Sell@102.50-102.60
TP:101.50-101.30
Get daily trading signals that ensure continuous profits! With an astonishing 90% accuracy rate, I'm the record - holder of an 800% monthly return. Click the link below the article to obtain accurate signals now!

4.4 Gold is low and long, wait for non-agricultureYesterday, the gold market opened at 3134.1 in the morning. The market first fell back to 3122.6 and then rose strongly. After breaking the previous high, it reached a high of 2167.9. After that, the market began to fall under the cooperation of fundamentals and technical profit-taking. The intraday low was 3053.6. After that, the market rose strongly and reached 3135.8 before consolidating. The daily line finally closed at 3114.1. The daily line closed in a spindle shape with a very long lower shadow. After this shape ended, after the break of 2940 and 2958, the long positions were reduced, and the stop loss was followed up at 3050. If it falls back to 3082 first today, the long stop loss is 3075. The target is 3115 and 3132. If it breaks, the target is 3140 and 3150.

4.4 Analysis of gold short-term operation strategy!!!On Thursday (April 3), spot gold experienced a surprising volatility, with a single-day fluctuation of nearly $114, and the price of gold finally closed down.
Analyze the technical outlook of gold intraday.
The 4-hour chart of gold shows that the price of gold is trading below the currently flat 20-period SMA, but it is still well above the bullish 100-period SMA, which provides support near $3040/oz. At the same time, technical indicators have recovered from near oversold readings and stabilized within negative levels. If the price of gold falls below the above-mentioned $3040/oz area, the price of gold may fall sharply.
Support: $3086.70/oz; $3073.90/oz; $3061.10/oz
Resistance: $3123.10/oz; $3136.70/oz; $3150.00/oz

DXY just broke below the 1W MA200 after 6 months!The U.S. Dollar index (DXY) broke today below its 1W MA200 (orange trend-line) for the first time in 6 months (since the week of September 30 2024). By doing so, it has almost hit the bottom (Higher Lows trend-line) of the long-term Channel Up.
The last contact with the 1W MA200 initiated a massive Bullish Leg two weeks after, so it would be an encouraging development if the candle holds here or better yet even close above the 1W MA200.
If it does, we expect a new strong Bullish Leg to start, targeting initially at least the 0.786 horizontal (blue) Fibonacci level at 108.000.
If not, the 2-year Support Zone is the last defense, with 99.600 as its lowest level (the July 10 2023 Low). Below that, a multi-year downtrend for DXY awaits.
Notice however, the incredible 1W RSI symmetry between selling sequences. Since January 2023, we've had two -54.50% declines. Right now, the current decline since January 2025 is exactly at -54.50%. If DXY rebounds here, it will confirm this amazing symmetry.
-------------------------------------------------------------------------------
** Please LIKE 👍, FOLLOW ✅, SHARE 🙌 and COMMENT ✍ if you enjoy this idea! Also share your ideas and charts in the comments section below! This is best way to keep it relevant, support us, keep the content here free and allow the idea to reach as many people as possible. **
-------------------------------------------------------------------------------
💸💸💸💸💸💸
👇 👇 👇 👇 👇 👇

"DXY/Dollar Index" Bull Money Heist Plan (Scalping / Day Trade)🌟Hi! Hola! Ola! Bonjour! Hallo! Marhaba!🌟
Dear Money Makers & Robbers, 🤑 💰💸✈️
Based on 🔥Thief Trading style technical and fundamental analysis🔥, here is our master plan to heist the "DXY/Dollar Index" Indices Market. Please adhere to the strategy I've outlined in the chart, which emphasizes long entry. Our aim is the high-risk Red Zone. Risky level, overbought market, consolidation, trend reversal, trap at the level where traders and bearish robbers are stronger. 🏆💸"Take profit and treat yourself, traders. You deserve it!💪🏆🎉
Entry 📈 : "The heist is on! Wait for the MA breakout (104.100) then make your move - Bullish profits await!"
however I advise to Place Buy stop orders above the Moving average (or) Place buy limit orders within a 15 or 30 minute timeframe most recent or swing, low or high level.
📌I strongly advise you to set an "alert (Alarm)" on your chart so you can see when the breakout entry occurs.
Stop Loss 🛑:
Thief SL placed at the recent/swing low level Using the 1H timeframe (103.500) Scalping/Day trade basis.
SL is based on your risk of the trade, lot size and how many multiple orders you have to take.
🏴☠️Target 🎯: 105.000 (or) Escape Before the Target
🧲Scalpers, take note 👀 : only scalp on the Long side. If you have a lot of money, you can go straight away; if not, you can join swing traders and carry out the robbery plan. Use trailing SL to safeguard your money 💰.
"DXY/Dollar Index" Indices Market Heist Plan (Scalping / Day Trade) is currently experiencing a bullishness,., driven by several key factors.
📰🗞️Get & Read the Fundamental, Macro Economics, COT Report, Geopolitical and News Analysis, Sentimental Outlook, Intermarket Analysis, Index-Specific Analysis, Positioning and future trend targets... go ahead to check 👉👉👉🔗
⚠️Trading Alert : News Releases and Position Management 📰 🗞️ 🚫🚏
As a reminder, news releases can have a significant impact on market prices and volatility. To minimize potential losses and protect your running positions,
we recommend the following:
Avoid taking new trades during news releases
Use trailing stop-loss orders to protect your running positions and lock in profits
💖Supporting our robbery plan 💥Hit the Boost Button💥 will enable us to effortlessly make and steal money 💰💵. Boost the strength of our robbery team. Every day in this market make money with ease by using the Thief Trading Style.🏆💪🤝❤️🎉🚀
I'll see you soon with another heist plan, so stay tuned 🤑🐱👤🤗🤩

DXY:Expect an uptrend based on the daily chart supportOn Tuesday, the price of the U.S. Dollar Index generally fluctuated in a range. The price reached a daily high of 104.345, a low of 103.99, and closed at 104.19.
Looking back at the performance of the U.S. Dollar Index on Tuesday, after the morning opening, the price initially fell under short-term pressure. Subsequently, it halted its decline and resumed its upward movement above the daily support level, but the overall range was limited. The price rose in a volatile manner, and finally closed with a bullish doji.
From a weekly perspective, continue to focus on the 106.60 level, which is a key level for the medium-term trend. Below this level, the medium-term trend is bearish, and the price increase is temporarily regarded as a correction within the medium-term decline.
Meanwhile, from a daily perspective, temporarily pay attention to the 103.90 level, which is crucial for the wave trend. Above this level, adopt a bullish stance for the wave trend. Also, on the four-hour chart, temporarily focus on the support at the 104.10 area. Therefore, before the price breaks below the low of Monday, bet on an upward movement based on the daily support. Only after a downward break will the trend turn bearish.
Currently, there is a lot of news, so everyone must be cautious of market risks.
Trading Strategy:
buy@103.90-104
TP:104.50-104.80
Get daily trading signals that ensure continuous profits! With an astonishing 90% accuracy rate, I'm the record - holder of an 800% monthly return. Click the link below the article to obtain accurate signals now!

Monthly closing line, gold is alert to pull higher and fall backAt the end of March, the monthly and quarterly lines of gold and silver closed with saturated strong positive lines. The first trading day of the month has broken the high by inertia, which is consistent with expectations. Next, the focus should be on guarding against the potential scenario of pulling up shipments in the first half of the month, and the possibility of extreme volatility.
There are a lot of heavy news data from the 2nd to the 4th. I think there is a high probability that there will be an obvious turning point. However, given that the global political and economic situation has not cooled down significantly, even if there is a turning point and a correction, or even a sharp correction, it is still difficult to make a real judgment of a reversal of the big cycle trend. Therefore, I think the general idea of the short and medium-term line should be to maintain short first and then long.
The small resistance is around 3145--3155, and the important support during the week is around 3050. Given the recent volatility, it is obviously necessary to continue to be prepared to deal with continued large fluctuations.
The above strategy is based on current market analysis, and specific operations need to be combined with real-time data!

4.1 Analysis and Suggestions on Gold US Market Operation IdeasGold intraday interpretation
Gold failed to hit 3150 in the morning session. How will the subsequent market evolve?
It hit a high in the morning and then fell back to 3125-3130 to stop the decline and enter consolidation. If it fails to break through 3150 on Thursday, it will have a chance to enter a high-level adjustment, and the decline may reach 30-50 points!
Market sentiment has been brewing for a long enough time. Everyone should look at tariffs rationally. Even if there is no tax increase, there is no need to be too surprised.
Currently entering the triangle consolidation pattern, which is a type of relay pattern. The pattern is usually accompanied by a reduction in trading volume and resumes the original trend after breaking through.
Focus: 3150 key resistance. Don't chase north above 3140. If the intermediate form is used, the probability of breaking through 3150 during the day is not high. Mainly look at the ADP employment number on Wednesday. Beware of the US market retreating from 3113 to 3117 and then rebounding quickly.
Lower support: 3125 3113 3105
Upper pressure: 3150 3165

DXY Bounces Back: I’m Staying BullishAfter breaking below the 104 support and hitting a low of 103.75, TVC:DXY staged a strong recovery, reclaiming support and signaling a potential false breakout.
The overnight retest of 104 established a higher low, suggesting further upside potential.
As long as 104 holds, I remain bullish and will look to sell EUR/USD and GBP/USD.

Monthly line saturated big positive line, gold and silver swordsYesterday, the gold market opened slightly higher at 3088 in the morning, and then fell back. The daily line reached a low of 3076.5, and then the market rose strongly. After breaking the 3100 integer mark, the daily line rose strongly. The daily line reached a high of 3128, and then the market consolidated widely. The daily line finally closed at 3123.8, and then the market closed with a long lower shadow. After this pattern ended, today's market still has technical bullish demand. In terms of points, after the breakout of 2940 and 2958, the stop loss followed up at 2990. Today, the stop loss of 3110 is 3105, and the target is 3128 and 3132. The breakout is 3140 and 3150-3152.
We will update regularly every day to introduce how we manage active ideas and settings. Thank you for your likes, comments and attention. Thank you very much
4.1 Analysis of gold intraday short-term trendFrom the daily chart, the gold price fell slightly after breaking through the previous high of $3127.76, but it is still in a strong upward channel overall. The current price has been stable above the 5-week moving average for many consecutive weeks, indicating that the medium-term trend is still healthy. It is worth noting that from the low of $2536.68 to date, gold has risen by more than 23%, and it is necessary to be vigilant about the risk of short-term adjustments. The next target will point to the psychological level of $3200. Factors supporting this view include rising global uncertainty, increased expectations of interest rate cuts by the Federal Reserve, and continued gold purchases by the central bank. In addition, the closing price needs to stabilize above $3135 to confirm the effectiveness of the long-term breakthrough. In this case, the price may accelerate upward, with a target of $3170.
Short-term resistance: 3130 3150 3170
The market is changing with the trend, and it is recommended to adjust the strategy in combination with real-time data!
