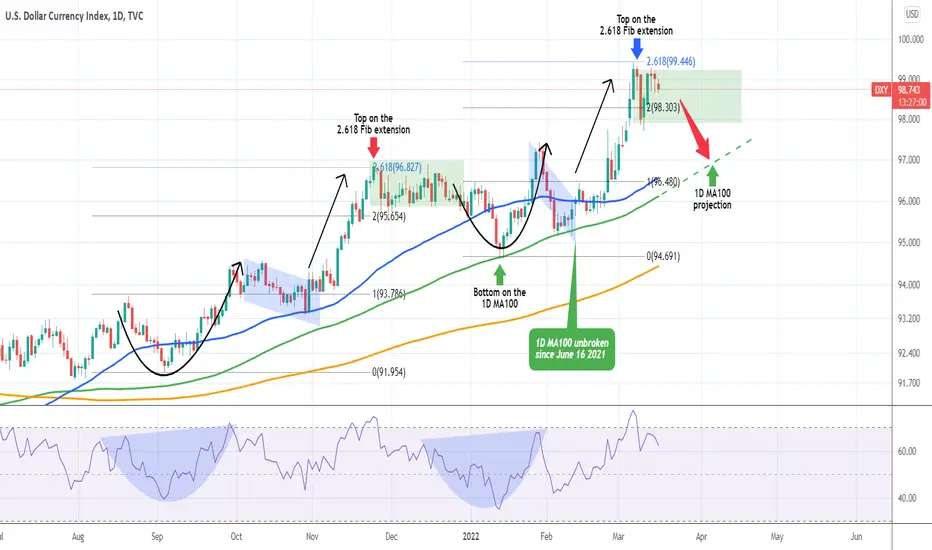
DXY topped, is consolidating and targeting the 1D MA100The U.S. Dollar Index (DXY) has been trading sideways since the March 07 High. This is no unfamiliar territory for the USD as it has last consolidated from November 24 to December 28 2021. The sequence that preceded that consolidation (green) both in price action and 1D RSI terms, is similar to the one that precedes the current consolidation.
The former consolidation ended with a break downwards that dropped to a January 14 2022 low exactly on the 1D MA100 (green trend-line). The 1D MA100 has been unbroken since June 16 2021, forming arguably the strongest long-term Support level. At the moment the 1D MA100 is at 96.112 and rising. Depending on how long this consolidation will last, a contact can be made around 97.000.
--------------------------------------------------------------------------------------------------------
Please like, subscribe and share your ideas and charts with the community!
--------------------------------------------------------------------------------------------------------
Dxysignals
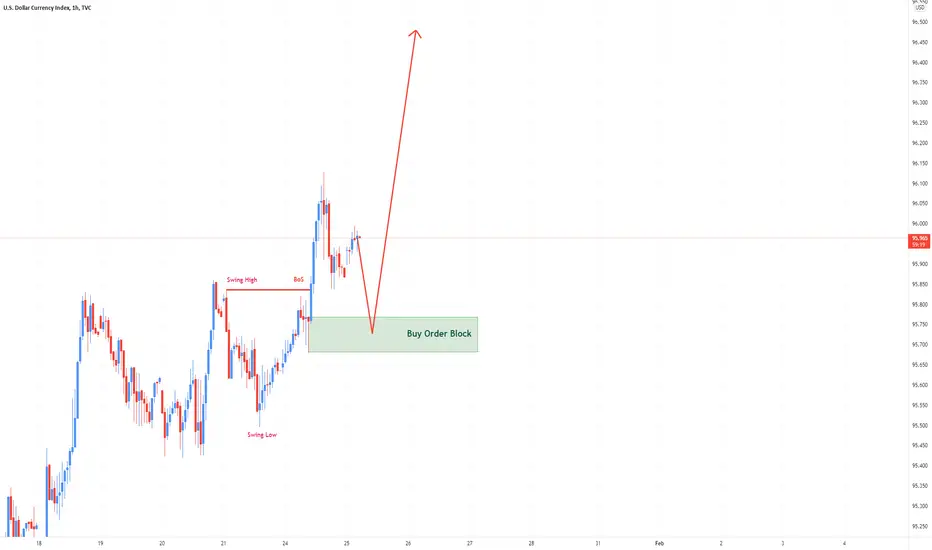
DXY Prediction H4Here is my view for DXY on H4. The price should go up, you can put a pending order on the Order block or find an entry on LTF within OB Zone. Trade Safe!

DXY Prediction H4Here is my view for DXY on H4. The price should go up, you can put a pending order on the Order block or find an entry on LTF within OB Zone, but be careful as DXY also might still be affected by the Ukraine war. Trade Safe!

DXY HAS CREATED ITS GRAVE!DXY has been SKYROCKETING to the upside recently and im here to show you guys why thats a bad thing for DXY! In this chart, you can see that DXY has been in this downtrend channel since 2015. I know it looks like its breaking out of it but thats not the case since it also seemed like that in 2017 and 2020. Actually, this time its even quite possible to break the downtrend channel to the DOWNSIDE! DXY has created a BEARISH DIVERGANCE ON THE MONTHLY!! As you see the, the rsi is going above 2020 while DXY was higher in 2020 than now. That is called a bearish divergance. 2 scenarios can play out at this point: either DXY gets rejected by the downtrend channel or it goes up to 103 resistance like it did 2017 and 2020 and crash then. Crypto and stocks bullseason is on the verge!! If DXY breaks the downtrend channel to the downside, it will be a very huge bullmarket!

DXY- On its way to 102? (weekly outlook)Since 2008 low from 72, DXY has traded upwards, and after 2015 break of 90 resistance, this zone has become a strong support, with the price reversing from here in 2018 and twice in 2021.
Recently the price also has broken above 95 interim resistance and seems determined to challenge 102 resistance.
Looking at the "power" of USD this 4% rise is very probable to happen by summer and swing traders can look to sell USD pairs like EurUsd, GbpUsd, NzdUsd, and AudUsd.
P.S: This is a clear example of Gold positively correlated with USD. So, don't trade the correlation (or what you think it is), trade the asset!

DXY inside a Channel Up. Action plan depending on break-outs.The U.S. Dollar Index (DXY) has been on Higher Highs and Higher Lows for the whole part of the year so far. Today the price hit and has so far been rejected on the Higher Highs trend-line again. As long as the price closes below on the 1D time-frame, it is more likely to see a pull-back towards the Internal Higher Lows (dashed line) and the 1D MA50 (blue trend-line).
In my opinion the key is the 1D MA100 (green trend-line). This is a Support level which DXY hasn't closed a 1D candle below since June 16 2021. This appears to be the pivot between bullish and bearish long-term. A break below that level should quickly test the 1D MA200 (orange trend-line).
However if the price breaks above the Higher Highs trend-line, which under the current unstable geopolitical climate is very probable, expect a rally near the 2.0 Fibonacci extension, which is around 100.00.
Notice how the 1D RSI has been on Lower Highs while the price was on Higher Highs, indicating here a Bearish Divergence.
--------------------------------------------------------------------------------------------------------
** Please support this idea with your likes and comments, it is the best way to keep it relevant and support me. **
--------------------------------------------------------------------------------------------------------

DXY - DOLLAR INDEX FORMING A BAT PATTERN - DXY is currently forming a BAT PATTERN.
- If you BREAK the DXY DOWNSIDE CHANNEL TREND LINE you can definitely COMPLETE the BAT PATTERN.
- If the DXY price falls below 95.00 LEVELS the BAT PATTERN will be INVALID and it will change to the SHARK PATTERN. If so we will UPDATE
- DXY BREAKOUT is very important for USD CROSS PAIRS.
- Up to DXY 97.27 can be UP if the BAT PATTERN is COMPLETE. So stay tuned for MARKET UPDATES.

DXY Chart H1Here is my view for DXY on H1. The price should go up, you can put a pending order on the Order block or find an entry on LTF within OB Zone. Trade Safe!

DXYas I said on last weeks .. DXY still keeps the premises of forming a pattern that it has been following since May 2020!
... I said in my last analysis DXY reached the 94500 area from where it strongly rejected!
in this area I will wait to see a trend for at least 1 day before entering the trade ... so,
- in case of a closure even for 1 day above level 95150 I will look for BUY towards 96400-97.900, otherwise I will look for SELL towards Fibonacci 618 from where UP again towards 97900-98300
THIS WEEK... as I analyzed ... DXY rejected from the 94500 area and closed over 95150 from where it climbed to the target proposed by me ... 96400!
I will continue to look for this target and from there I will redo the entire technical analysis!
However, I recommend that you wait for the evolution of the news about the conflict in Ukraine before making a big move on the DXY
NOTE: Please, give a LIKE if you find this idea useful!
GREAT ATTENTION:
*This information is not a Financial Advice.

DXY Chart H1Here is my view for DXY on H1. The price should go up, you can put a pending order on the Order block or find an entry on LTF within OB Zone. Trade Safe!

DXY between the 1D MA50 and 1D MA100The U.S. Dollar Index (DXY) is at the moment on a short-term rebound, following the higher than expected U.S. CPI, which is a indicator of inflation, critical to the Fed's Rate policy. Technically the price is pressured by the 1D MA50 (blue trend-line) as a short-term Resistance and at the same time supported by the 1D MA100 (green trend-line). Short-term traders should trade the break-out that prevails and closes the day: i.e. above the 1D MA50 = bullish targeting the 97.450 Resistance, below the 1D MA100 = bearish targeting the 1D MA200 (orange trend-line).
On the more medium-term, we can see two Channel patterns. The dominant one, the green Channel Up, which is leading the price since late September but if the 1D MA100 breaks, a Channel Down may emerge. That will have the 1D MA200 on its Lower Lows trend-line close to the end of the month. The strongest case for the Channel Down prevailing is made by the 1W MACD which has formed already two Bearish Crosses.
--------------------------------------------------------------------------------------------------------
Please like, subscribe and share your ideas and charts with the community!
--------------------------------------------------------------------------------------------------------

DXY Chart H1Here is my view for DXY on H1. The price should go up, you can put a pending order on the Order block or find an entry on LTF within OB Zone. Trade Safe!

DXY Chart H1Here is my view for DXY on H1. The price should go up, you can put a pending order on the Order block or find an entry on LTF within OB Zone. Trade Safe!

DXY Chart W1Here is weekly Analysis for DXY on W1. The price should go up, you can put a pending order on the Order block or find an entry on LTF within OB Zone. Trade Safe!

DXY- Is this a double top?After reversing from the very strong confluence support at 94.50, DXY made a new high above 97.
However, what should have led to continuation proved to be a false break and we have an Evening Start candle formation which marks strong resistance.
Yesterday the index also has broken down under the ascending trend liner and now is facing support on what can very well be the neck-line of a double top.
A break under this support would give us confirmation for the pattern and could lead to further losses towards 92 support.

DXY Chart H1Here is my view for DXY on H1. The price could go down, you can put a pending order on the Order block or find an entry on LTF within OB Zone. Trade Safe!

DXY- Up we broke, 100 is in cardsIf you follow my ideas, you know that I'm bullish USD for quite some time, and the market didn't disappoint me so far.
Looking at DXY, we can see that after the drop from 2 weeks ago, USD has found strong bids exactly in the confluent support given by the trend line and the horizontal one, and a strong V shape recovery followed.
Now we also have an up break of the old resistance and consolidation and the index looks determined to reach 100 psychological figure.
The strategy for USD pairs should be to sell rallies for EurUsd, GbpUsd, AudUsd, and NzdUsd

DXY Pre rate hike pattern signals a top nearbyThe U.S. Dollar index is rising aggressively since yesterday's confirmation by Jerome Powell that on the March event the Fed will indeed start raising the interest rates again. In the most recent rate hike event on December 16 2015, the DXY also starting rising 7 weeks before the event itself. As you see the patterns are quite similar, as both started rising after the formation of a Triangle.
As a result, even though a final rally is possible, starting to build up sell positions would be the safer investment choice on the long-term.
--------------------------------------------------------------------------------------------------------
** Please support this idea with your likes and comments, it is the best way to keep it relevant and support me. **
--------------------------------------------------------------------------------------------------------

DXY Chart H1Here is my view for DXY on H1. The price should go up, you can put a pending order on the Order block or find an entry on LTF within OB Zone. Trade Safe!
USD INDEXHello traders. In the dollar index, I expect the price to drop to $ 94.5 in the first stage and $ 93.2 in the second stage after breaking the $ 95.4 level. Are you agree?

DXY
as I said on last weeks .. DXY still keeps the premises of forming a pattern that it has been following since May 2020!
... as I said in my last analysis ... I will look for SELL per DXY up to around 94,500 because as we show you towards the end of 2021 I noticed a pattern that has formed since June 2020!
THIS WEEK... as I said in my last analysis DXY reached the 94500 area from where it strongly rejected!
in this area I will wait to see a trend for at least 1 day before entering the trade ... so,
- in case of a closure even for 1 day above level 95850 I will look for BUY towards 96400-97.900, otherwise I will look for SELL towards Fibonacci 618 from where UP again towards 97900-98300
NOTE: Please, give a LIKE if you find this idea useful!
GREAT ATTENTION:
*This information is not a Financial Advice.

AUDUSD LongWe have strong reversals on both AU and DXY and we are bullish on most AUD pairs, stochastics are bullish, pair bounced right off on the 200EMA and the 4hr ascending channel is holding properly

DXY bouncing on the pivot and 1D MA100.DXY has formed a Channel Down since the December 15 Double Top, a projection made clearly on my previous Dollar Index analysis a month ago:
On Friday however, the price hit and bounced on the 94.600 Pivot which on October 12 2021 acted as a Resistance. This time seems to be a Support and this is further strengthened by the fact that it is exactly where the 1D MA100 (green trend-line) is, in fact the exact bounce was on the 1D MA100.
As a result, it is possible to see a rebound that will put the 1D MA50 (blue trend-line) up to test as a Resistance. Overall, with the 1W MACD forming a Bearish Cross, the bearish trend is favored long-term. In either case, a break below the Pivot, is am immediate bearish break-out signal with a target on the 0.5 Fib (93.245) and the 1D MA200 (orange trend-line).
--------------------------------------------------------------------------------------------------------
** Please support this idea with your likes and comments, it is the best way to keep it relevant and support me. **
--------------------------------------------------------------------------------------------------------
