DXY Best level for a long-term short.The U.S. Dollar index (DXY) has been trading within a 1.5 year Channel Up pattern (since July 14 2023) and just 2 weeks ago it formed a Golden Cross on the 1D time-frame. Having hit the pattern's top a week earlier, the current rebound seems to technically be part of the Lower Highs/ Lower Lows top formation, similar to October 03 - November 01 2023 peak.
That was 1 year again, a peak formation that was also formed after a 1D Golden Cross. This indicates that the long-term pattern (Channel Up) is highly symmetrical and as the 1W RSI is also declining after a rejection on the 70.00 overbought barrier, we consider the current level the best possible short entry.
The Bearish Leg that followed the 2023 High extended as low as the 0.786 Fibonacci level. As a result, we expect to see at least 102.000 (just above the 0.786 Fib) before any signs of a rebound.
-------------------------------------------------------------------------------
** Please LIKE 👍, FOLLOW ✅, SHARE 🙌 and COMMENT ✍ if you enjoy this idea! Also share your ideas and charts in the comments section below! This is best way to keep it relevant, support us, keep the content here free and allow the idea to reach as many people as possible. **
-------------------------------------------------------------------------------
💸💸💸💸💸💸
👇 👇 👇 👇 👇 👇
Dxysignals

Dollar Index (DXY): Very Bullish Sentiment
Dollar Index completed a consolidation, violating
a resistance of a wide horizontal range on a daily.
It opens a potential for more growth.
The market may keep rising, at least to 107.45
❤️Please, support my work with like, thank you!❤️

DXY- Will it continue up into year's end?December is usually a bearish month for the USD. However, this time, the situation could be different. The USD seems well-supported by fundamentals, and the technicals are looking bullish.
Looking at the 4-hour chart, we can see that after the local high at 108, the index started to fall and broke below the support from the April-May highs (old resistance). However, after hitting a low at the 105.50 zone, the USD Index reversed, breaking above the falling trendline of the corrective falling wedge and also reclaiming the 106.40 resistance.
At this moment, there is a high chance of upward continuation, and as long as the 106–106.40 zone remains intact, the outlook remains valid.

Is USD Setting Up for a Retrace?👀 👉 The DXY (USD) has shown strong momentum, rebounding sharply from a key support level and pushing into this 4H resistance zone. In my view, the price seems overextended, and I’m anticipating a retracement within the current price swing range back to equilibrium. 📢 *Disclaimer: This content is not financial advice.

Analyzing DXY: Key Clues for USD Pair Trading Opportunities👀👉 In this video, we dive into the DXY index and analyze its bearish break of market structure on the 4-hour chart, highlighting the mounting pressure on the dollar. We discuss the importance of monitoring price action through the London session into the New York open, waiting for potential liquidity runs and pullbacks before the daily or weekly trend emerges. Learn how the DXY provides vital clues for trading correlated and inversely correlated currency pairs, unlocking potential opportunities across the forex market. Don’t miss these key insights to stay ahead in your trading! Not financial advice.📊✅

DXYDXY - U.S Dollar Index
Bearish Channel as an Corrective Pattern in Short Time Frame
Break of Structure and Retracement
RSI - Divergence
Completed " 1234 " Impulsive Waves
Order Block

DXYThis is it DXY is looking wealthy, I'm going for a buy looking at:
- 4h SUPPORT ZONE
- H&S pattern formed
- Double bottom on top of 4h support zone
And many other correlations

DXY "DOLLAR INDEX" Market Money Heist Plan on Bullish SideHii! My Dear Robbers / Money Makers & Losers, 🤑 💰
This is our master plan to Heist DXY "DOLLAR INDEX" Market Market based on Thief Trading style Technical Analysis.. kindly please follow the plan I have mentioned in the chart focus on Long entry. Our target is Red Zone that is High risk Dangerous level, market is overbought / Consolidation / Trend Reversal / Trap at the level Bearish Robbers / Traders gain the strength. Be safe and be careful and Be rich.
Entry 📈 : Can be taken Anywhere, What I suggest you to Place Buy Limit Orders in 15mins Timeframe Recent / Nearest Low Point take entry in pullback.
Stop Loss 🛑 : Recent Swing Low using 2H timeframe
Attention for Scalpers : Focus to scalp only on Long side, If you've got a lot of money you can get out right away otherwise you can join with a swing trade robbers and continue the heist plan, Use Trailing SL to protect our money 💰.
Warning : Fundamental Analysis news 📰 🗞️ comes against our robbery plan. our plan will be ruined smash the Stop Loss 🚫🚏. Don't Enter the market at the news update.
Loot and escape on the target 🎯 Swing Traders Plz Book the partial sum of money and wait for next breakout of dynamic level / Order block, Once it is cleared we can continue our heist plan to next new target.
💖Support our Robbery plan we can easily make money & take money 💰💵 Follow, Like & Share with your friends and Lovers. Make our Robbery Team Very Strong Join Ur hands with US. Loot Everything in this market everyday make money easily with Thief Trading Style.
Stay tuned with me and see you again with another Heist Plan..... 🫂

DXY IndexDXY Index
Bearish Channel
CHOCH
Fibonacci Level 50
Break of Structure
Completed Impulsive Waves

Unmasking DXY's Bullish Potential with Volume ProfileH ello,
The unusually high market activity around the 100.5 level indicated strong bullish accumulation. The yellow ellipses highlight the volume and price levels. You can see that volume decreases both above and below this key level. This accumulation is evident because the price broke out of a bullish consolidation pattern, as shown in the left yellow circle, reaching a high of 103.9, indicated by the yellow line. This is the current level, where you may notice exceptionally high market activity. As the price remains above the green demand zone, the red supply zone may be tested, as suggested by the volume profile.
Regards,
Ely

DXY DXY Index
Change of Characteristics
Bullish Channel as an Corrective Pattern in Short Time Frame
Break of Structure and Retracement
RSI - Divergence
Completed " 12345 " Impulsive Waves

DXY DXY Index
Change of Characteristics
Bullish Channel as an Corrective Pattern in Short Time Frame
Break of Structure and Retracement
RSI - Divergence
Completed " 12345 " Impulsive Waves

Dxy downgradeDxy trending down, xxxusd going up usdxxx going down, bullish trend at DXY penetrative and crossing bullish resistance,
DYOR always, n keep ur trade safe

DXY, Is correction on the way ?Hello Traders, Hope you are doing great.
for upcoming days and for a short period of time, we'll probably see a downward correction to Specified level in TVC:DXY , we also have a Divergence on 4H that confirms our theory.
so with a proper trigger we can open a short position. We will also probably find better buy positions in FX:GBPUSD And FX:AUDUSD than the FX:EURUSD .
Trade safe and have a great weekend.
And finally tell me what do you think ? UP or DOWN ? leave your comment below this post.
If this post was helpful to you, please like it and share it with your friend.
THANKS.

DXY is facing resistance zoneAs you know, I’ve been bullish on the DXY and have anticipated a reversal since the now-confirmed bottom just above 100.
With the price now above 106, however, I believe USD bulls should start exercising caution. There’s a very strong resistance zone ahead, ranging from 106.20 to 106.50, with another important level just above 107.
In my view, a correction is likely soon, and I’ll be watching for buying opportunities in EUR/USD and GBP/USD.

Is a DXY Pullback on the Horizon? Key Price Action Signals Is a DXY Pullback on the Horizon? Key Price Action Signals to Keep an Eye On
👀👉 The DXY Dollar Index has shown robust bullish momentum recently—but is it overextended? A pullback at a major support level could offer a valuable entry opportunity. I’m watching this zone closely for a possible buy setup aligned with the key criteria covered in the video. In this analysis, we’ll explore essential price action signals to watch and discuss strategies for positioning in the next potential move. Disclaimer: This analysis is for informational purposes only and not financial advice.* 📊✅

DXY "DOLLAR INDEX" Bank Bullish Robbery Plan To Steal MoneyHola! My Dear Robbers / Money Makers & Losers, 🤑 💰
This is our master plan to Heist DXY "DOLLAR INDEX" Bank based on Thief Trading style Technical Analysis.. kindly please follow the plan I have mentioned in the chart focus on Long entry. Our target is Red Zone that is High risk Dangerous level, market is overbought / Consolidation / Trend Reversal / Trap at the level Bearish Robbers / Traders gain the strength. Be safe and be careful and Be rich.
Entry : Can be taken Anywhere, What I suggest you to Place Buy Limit Orders in 15mins Timeframe Recent / Nearest Swing Low
Stop Loss 🛑 : Recent Swing Low using 2h timeframe
Attention for Scalpers : If you've got a lot of money you can get out right away otherwise you can join with a swing trade robbers and continue the heist plan, Use Trailing SL to protect our money 💰.
Warning : Fundamental Analysis news 📰 🗞️ comes against our robbery plan. our plan will be ruined smash the Stop Loss. Don't Enter the market at the news update.
Loot and escape on the target 🎯 Swing Traders Plz Book the partial sum of money and wait for next breakout of dynamic level / Order block, Once it is cleared we can continue our heist plan to next new target.
Support our Robbery plan we can easily make money & take money 💰💵 Follow, Like & Share with your friends and Lovers. Make our Robbery Team Very Strong Join Ur hands with US. Loot Everything in this market everyday make money easily with Thief Trading Style.
Stay tuned with me and see you again with another Heist Plan..... 🫂

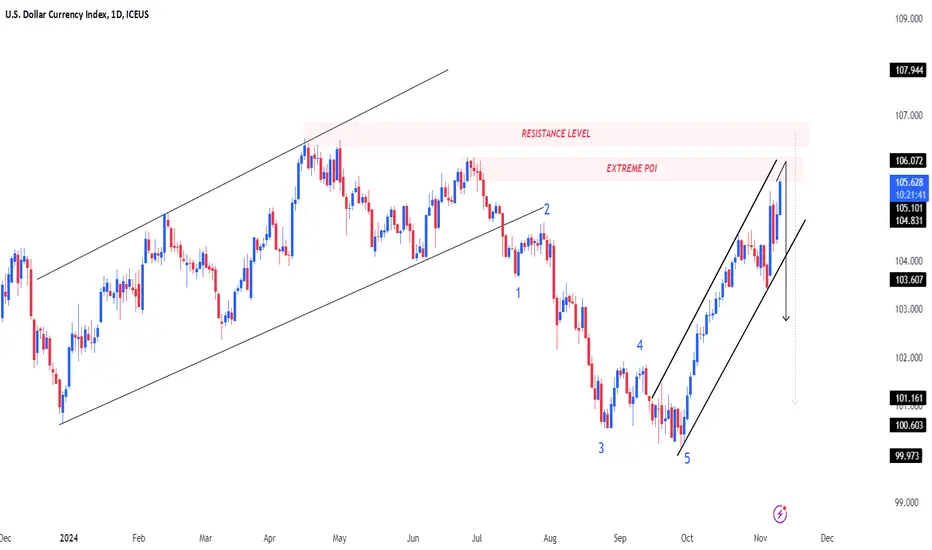
DXY IndexDXY Index
Completed " 12345 " Impulsive Waves and " ABC " Corrective Waves at Extreme Point of Interest ( POI ). Bullish Channel as an Corrective pattern in Short Time Frame and Rejection from Resistance Level with a Strong Divergence
DXY topped on the 1-year Channel Down. Strong downside potentialThe U.S. Dollar index (DXY) has been trading within a Channel Down pattern since the October 03 2023 High (13 months) and yesterday got the first red 1D candle after almost touching the pattern's top (Lower Highs trend-line) the day before.
As the 1D RSI has dropped significantly after being overbought 2 weeks ago, this is a very similar top formation to the Highs of April 16 2024 and October 03 2023. As a result this is the earliest possible sell entry we can take to target long-term the new Lower Low of the Channel Down.
The previous two Bearish Legs priced their Lows after roughly a -6.00% to -6.25% decline, just above the 1.1 Fibonacci extension. As a result, our Target is 99.800.
-------------------------------------------------------------------------------
** Please LIKE 👍, FOLLOW ✅, SHARE 🙌 and COMMENT ✍ if you enjoy this idea! Also share your ideas and charts in the comments section below! This is best way to keep it relevant, support us, keep the content here free and allow the idea to reach as many people as possible. **
-------------------------------------------------------------------------------
💸💸💸💸💸💸
👇 👇 👇 👇 👇 👇

Bear control...After three attempt to goes to touch the upper line of big channel, DXY made three bearish daily candlestick and now can correct to 103.
On my view, all pairs can strong against Us Dollar. JPY is one of the best choice to choose.
Trade safe.
Good luck.

DXY Trade Idea👀👉 The US Dollar Index (DXY) has retraced and showing signs of upward momentum. We are looking to buy on this 4H pullback. Disclaimer: This is not financial advice. Always do your own research and consult a licensed financial advisor before making any trading decisions.📊✅

DXY Index at Critical Resistance: Possible Clues for USD Pairs👀👉 The US Dollar Index (DXY) is nearing a key resistance zone, repeatedly tested on both the monthly and weekly timeframes, which often signals a potential market reaction or rejection. While the US dollar has maintained a strong bullish trend, these factors suggest a possible near-term reversal, offering potential opportunities in both correlated and inversely correlated currency pairs. Disclaimer: This is not financial advice. Always do your own research and consult a licensed financial advisor before making any trading decisions.
📊✅

USD Index at 104 Resistance: Strategies for the Next MoveIn early October, I wrote that the multiple attempts to break below the support level given by the beginning of the year price were likely false breaks.
I suggested that the DXY (U.S. Dollar Index) was primed for a reversal to the upside, which could potentially push the price toward the 104 resistance level.
As anticipated, the USD Index reversed and touched this key resistance.
Looking ahead, a correction from this point seems probable, with the 102.50 zone being a possible target in the coming days.
My strategy is to look for buying opportunities in EUR/USD and AUD/USD.
