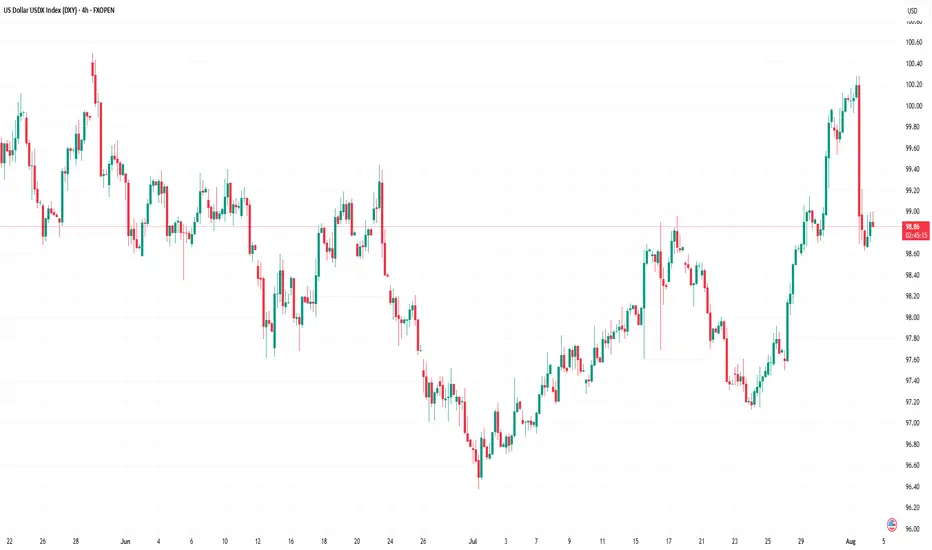
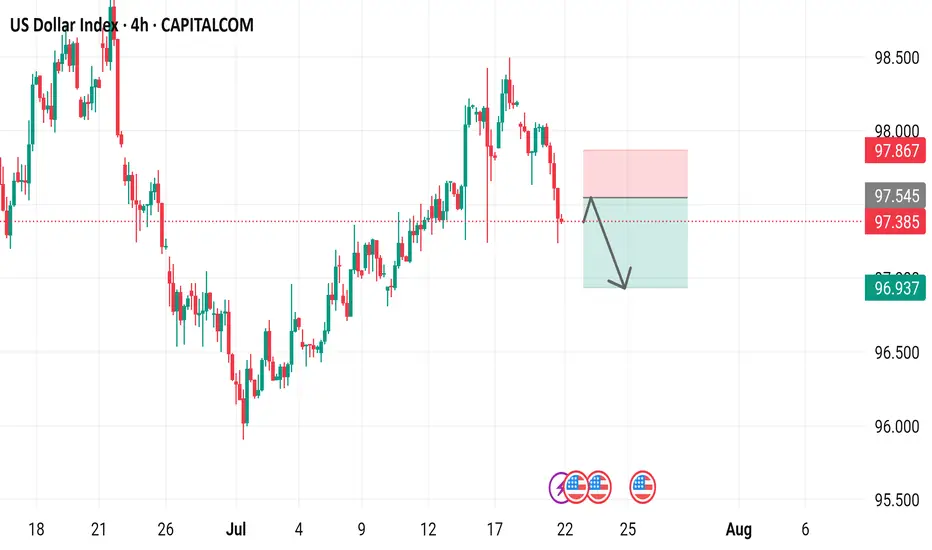
US Dollar Index (DXY) Plummets Following Labour Market DataUS Dollar Index (DXY) Plummets Following Labour Market Data
The US Dollar Index (DXY) fell by approximately 1.4% on Friday after the release of disappointing US labour market figures. According to Forex Factory:
→ The unemployment rate rose from 4.1% to 4.2%;
→ The Nonfarm Employment Change figure came in at 73K, well below the forecast of 103K. This is the lowest level of job creation in the nonfarm sector in 2025 and is roughly half the previous month’s reading (prior to revisions).
→ Furthermore, revisions for May and June were significantly more severe than usual. The May figure was revised downward by 125,000 — from +144,000 to +19,000. Similarly, the June figure was revised down by 133,000 — from +147,000 to +14,000.
These results point to a weakening labour market, which increases the likelihood of a rate cut aimed at supporting economic growth. In turn, expectations of a Fed rate cut are acting as a bearish driver for the US dollar.
Technical Analysis of the DXY Chart
Six days ago, we highlighted two U-shaped trajectories (A and B), which together formed a bullish сup and рandle pattern on the US Dollar Index chart.
Following this, price action generated a notable upward impulse (as indicated by the arrow), breaking through the upper boundary of the pattern.
However, Friday’s news triggered the following developments:
→ A new top (4) was formed on the chart, accompanied by a false bullish breakout above the psychological level of 100.00;
→ The price declined to the 98.80 area. The downward move slowed here, as this zone had previously seen strong bullish activity during the breakout from the pattern’s upper boundary — likely explaining why the market is finding support here on Monday morning.
Overall, the technical picture has shifted towards a bearish outlook. Friday’s peak continues the summer sequence of lower highs and lows: 1 → 2 → bottom of pattern (A) → 4. This structure is part of a broader downtrend that has defined the market in 2025.
Should bearish sentiment persist, fuelled by Friday’s data, we can assume a further decline in the US Dollar Index towards the median line of the descending channel (shown in red), which has been drawn through the aforementioned price extremes.
This article represents the opinion of the Companies operating under the FXOpen brand only. It is not to be construed as an offer, solicitation, or recommendation with respect to products and services provided by the Companies operating under the FXOpen brand, nor is it to be considered financial advice.
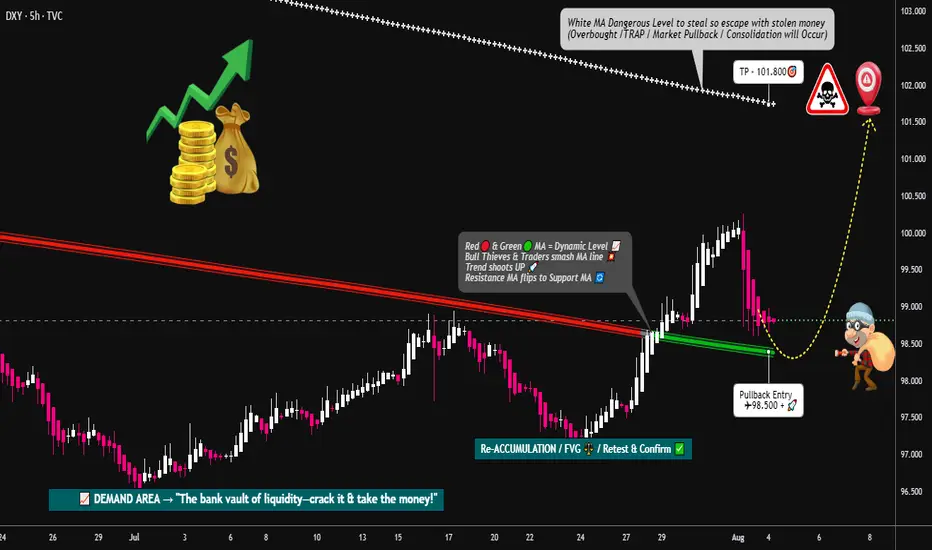
Dxytradingsetup
DXY Locked & Loaded: Robber's Gameplan for Profit Pullout💸💼 "DXY Market Heist Blueprint – The Thief's Bullish Escape Plan" 💼💸
Rob the Market, Not the Rules – Trade Smart, Trade Sharp, Trade Thief Style™
🌍 Hey Money Makers, Risk Takers & Market Robbers!
Hola! Ola! Bonjour! Hallo! Marhaba! 🙌
Let’s break into the DXY vault and swipe those profits with precision. 💼💸
🧠💡This Thief Trading Style™ Master Plan is a high-stakes operation backed by technical setups, macro-fundamentals, and robbery-level insights. Follow the blueprint laid out on the chart. Our target? The High-Risk Yellow ATR Zone – where the real treasure is buried.
💼 ENTRY: "The Vault Is Open – Grab the Bullish Bags!"
Enter long as price approaches key pullback levels within a 15–30 min timeframe. Use the most recent candle wick’s swing low/high for sniper-style DCA entries.
🔑 Layer multiple limit orders like a thief stacking getaway bags (aka the DCA / Layering Method). Be patient and precise.
🛑 STOP LOSS: "Don’t Get Caught by the Market Police"
📍 Place SL just below the nearest 4H swing low (example: 97.300) depending on your strategy (scalping/swing).
⚖️ Your SL should reflect your risk appetite, lot size, and how many limit orders you’re running. Thieves don’t risk it all on one job. 🎭
🎯 TARGET: 101.800 (or Escape Before the Sirens)
Once the target zone nears, decide whether to collect full loot or exit before resistance hits. We trade smart, not greedy. 🧠💰
📈 Why This Heist Makes Sense: Market Conditions Breakdown
Bullish momentum supported by macro drivers and intermarket forces
COT report and sentiment leaning in favor of USD
Dollar Index structure showing signs of reversal + trend confirmation
Consolidation trap zones hinting at institutional accumulation
💡 This is not just a blind entry—it's a well-researched and time-tested plan. Check the chart details and refer to:
🔗 Fundamentals | COT Reports | Sentiment Score | Quantitative Outlook
🚨 NEWS & POSITION MANAGEMENT ALERT
Before jumping in, beware of high-impact news!
🗞️ To keep your trades safe and stress-free:
Avoid opening new positions during major news releases
Use trailing SLs to protect gains
Monitor volatility triggers (economic calendar is your best friend!)
🏴☠️💥 BOOST THE ROBBERY – Hit That Like/Boost Button
The more you boost, the stronger the heist crew becomes! 💪🚀
Help fellow traders steal opportunities with the Thief Trading Style™ – calculated, bold, and sharp.
🔥 Let's continue to outsmart the markets and make each trade count. Stay tuned for the next heist update – fresh trades, deeper insights, and bigger bags. 🤑💼
🔔 Disclaimer: This plan is not financial advice. Use it for educational and entertainment purposes. Always conduct your own analysis and manage risk accordingly.
📌 Markets shift quickly. Stay adaptable, informed, and always ready to pivot.
DXY still in downward channel. Rejection here = BTC rally The DXY is still in a downward sloping channel and trying to break back above the previous 2-year cycle low, but I think will reject here and kick off the next leg of the BTC rally.
Ideally we get a big DXY drop and ultimately break below the 95% level and on down into 'Bitcoin Super Rally Zone'🚀

US Dollar Index (DXY) Reaches One-Month HighUS Dollar Index (DXY) Reaches One-Month High
The US Dollar Index (DXY) has risen to its highest level since early July. According to media reports, the bullish sentiment in the market is driven by the following factors:
→ Optimism around US trade agreements. A new trade deal with the EU — which includes a 15% tariff on European goods — is being perceived by the market as favourable for the United States.
→ Confidence in the resilience of the US economy. Strong Q2 corporate earnings have acted as an additional bullish catalyst. Investors may have started covering short positions against the dollar, viewing concerns over a US slowdown as overstated.
→ Expectations that the Federal Reserve will keep interest rates on hold.
From a technical standpoint, today’s DXY chart reflects strengthening bullish momentum.
Technical Analysis of the DXY Chart
Two U-shaped formations (A and B) that developed over the summer have created a bullish сup and рandle pattern — a formation that suggests waning bearish pressure, as evidenced by the shallower second dip.
This setup points to the potential for a bullish breakout above the trendline (marked in red) that has defined the downward movement in the DXY throughout the first half of 2025.
As previously analysed, there are signs that the dollar index may have found a base following a period of decline. This could indicate a shift in market sentiment and the possible end of the recent bearish phase.
This article represents the opinion of the Companies operating under the FXOpen brand only. It is not to be construed as an offer, solicitation, or recommendation with respect to products and services provided by the Companies operating under the FXOpen brand, nor is it to be considered financial advice.
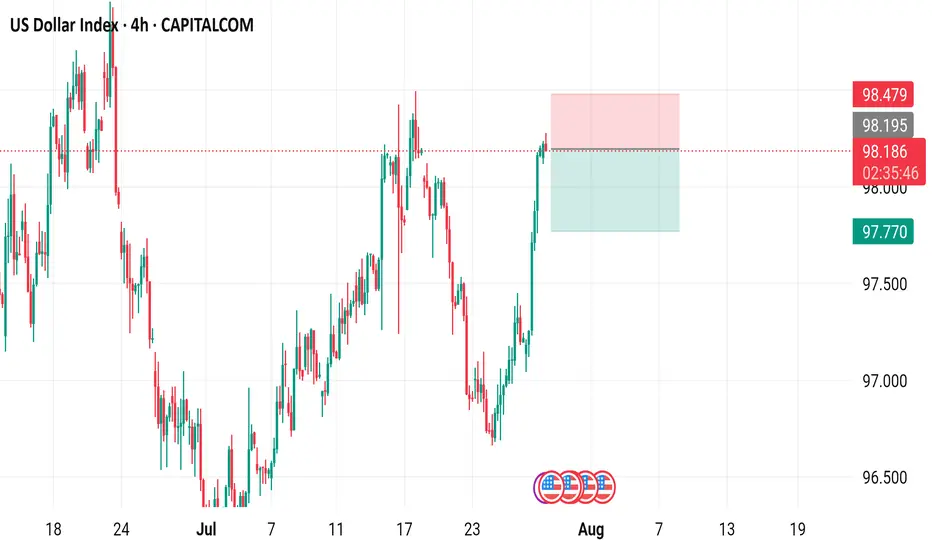
US Dollar Index (DXY) - 4 Hour Chart4-hour chart from CAPITALCOM displays the recent performance of the US Dollar Index (DXY), showing a current value of 98.190 with a slight decline of 0.009 (-0.01%). The chart highlights key price levels, including a recent sell signal at 98.189 and a buy signal at 98.243, with a resistance zone marked between 98.195 and 98.479. The index has experienced fluctuations, with notable drops and recoveries, and is currently trending near the 98.190 level as of July 29, 2025.
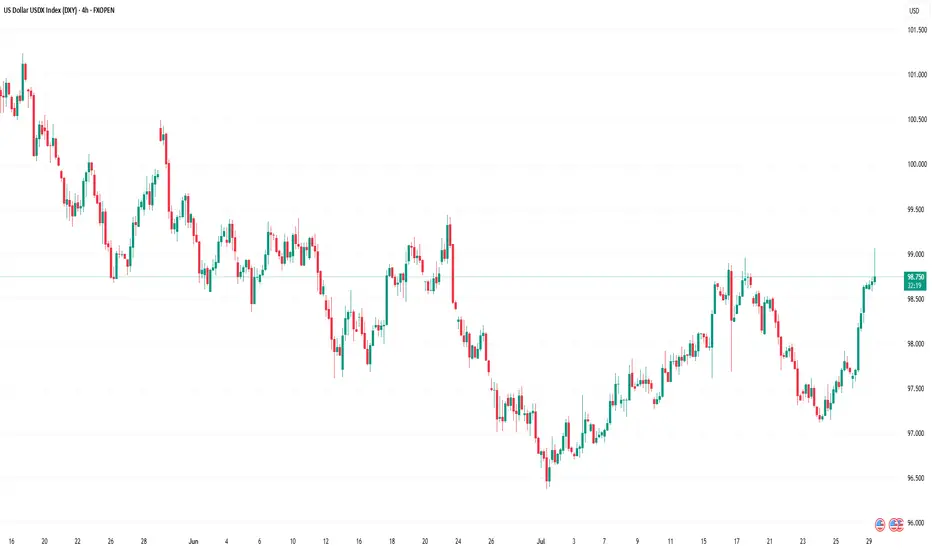
DXY forecast From weekly view the DXY is looking bearish at least till 95.123 key level the will see if we get a bullish power as the DXY is forming a reversal pattern. But of course many factors plays part in this economy, for example, global news like Tariffs and other factors.
So when DXY is trading on the 95.123 key level additional confluence will give us the right to put on trades, as the 95.123 key level is significant for what will take place next.
Take you all.......

US Dollar Index - 4h Chart (CAPITALCOM)4-hour chart of the US Dollar Index (DXY) from CAPITALCOM shows the index's recent price movements. The current value is 96.955, with a slight increase of 0.054 (+0.06%). Key levels include a support at 96.413 and resistance at 97.554. The chart highlights buy signals at 97.012 and sell signals at 96.958 and 96.955, with a notable downward trend breaking below a support zone around 97.150.

US Dollar Index 4-hour time frame, showcasing the US Dollar Index's performance over this period.
- The index is currently at 97.385, with a decrease of 0.636 (-0.65%) from its previous value.
- A red box indicates a "SELL" signal at 97.385, while a blue box suggests a "BUY" signal at 97.439.
- The chart includes various technical indicators, such as moving averages and relative strength index (RSI), to help traders analyze market trends.
US Dollar Index (DXY) - 4 Hour Chart4-hour performance of the US Dollar Index (DXY) from CAPITALCOM, showing a current value of 98.040 with a 0.23% increase (+0.222). The chart includes recent buy and sell signals at 98.094 and 98.040, respectively, with a highlighted resistance zone around 98.706-99.000 and a support zone around 97.291-98.040. The timeframe covers data from early July to mid-August 2025.
DXY Outlook: Bullish Move Fueled by Fundamentals & GeopoliticsTechnical Analysis (4H Chart & Broader Context) 📈🕓
The DXY 4H chart shows a clear bullish trend 🚀, with higher highs and higher lows since early July. DXY has caught a strong bid, breaking above short-term resistance near 98.40 and now eyeing the previous swing high 🎯. This matches the consensus among analysts: DXY remains in a bullish structure, with momentum supported by both technicals and macro factors.
Key resistance: Next upside target is the previous high (around 99.60 on the chart), with further resistance at the psychological 100 level 🏁.
Support: Immediate support at 98.20, then 97.60 🛡️.
Momentum: Strong bullish candles and no major bearish reversal signals on the 4H. Some analysts note positioning is stretched, so a short-term pullback or consolidation is possible before more upside (IG).
Fundamental Analysis 💹🌍
Why is DXY rallying?
Fed Policy & US Data: The US economy is resilient 💪, with robust services data, strong retail sales, and a recent uptick in core inflation. The Fed is less dovish, with markets now expecting a slower pace of rate cuts 🏦.
Interest Rate Differentials: The US keeps a yield advantage as the Fed is less aggressive in cutting rates compared to the ECB and BoJ, especially with Europe and Japan facing weaker growth and possible further easing 🌐.
Geopolitical Factors: Ongoing trade tensions (Trump’s tariff threats) and global uncertainty (including Middle East risks) are driving safe-haven flows into the dollar 🛡️🌏. DXY typically strengthens during periods of geopolitical stress.
Positioning: CFTC data shows USD long positioning at multi-month highs, which could mean the market is crowded and vulnerable to short-term corrections ⚠️ (IG).
Trade Idea (Bullish Bias, Targeting Previous High) 💡💵
Setup:
Bias: Bullish, in line with the prevailing trend and macro backdrop 🟢.
Entry: Consider buying on a minor pullback to the 98.20–98.40 support zone, or on a confirmed breakout above the recent high 🛒.
Target: Previous swing high near 99.60, with a stretch target at 100.00 🎯.
Stop: Below 97.60 (recent swing low/support) ⛔.
Risk Factors:
Overbought positioning could trigger a short-term pullback ⚠️.
Any dovish surprise from the Fed or rapid de-escalation in global tensions could cap further gains 🕊️.
In summary: The DXY’s bullish trend is underpinned by resilient US data, a hawkish Fed, and global risk aversion. Your bullish bias is well-supported, with the previous high as a logical target. Watch for short-term pullbacks, but the broader trend remains up unless key support is lost. 🚦
DXY (USD Basket) - 3 Month - Short Squeeze In Play?Technicals:
The last 3-month candle closed above the major resistance that tends to hold according to historic levels going back to the year 1967.
Golden Cross is almost complete (50 MA crossing the 200 MA).
Fundamentals:
The dollar has only been more shorted once in history (2018), setting things up for a potential "Short Squeeze" and triggering a "Risk Off" scenario. Tends to hurt risk assets quite hard—for example, tech stocks, crypto, and other leverage plays.
A rise in the DXY could potentially trigger a "Short Squeeze" for foreign countries, companies, and investors that borrow in USD, creating "economic panic" in other countries that get their currency devalued relative to their obligations.
Countries that need USD to service their debt. With the current tariffs, the flow of dollars in the world will change. The question is: what will the effect look like in August when these tariffs start to go live? Like I mentioned before, other countries need the dollars in order to service their debt. If it gets more expensive for US consumers to import (caused by the tariffs), the exporting countries won’t get those dollars—setting it up for a buying cycle that could potentially drive the USD (DXY) higher, even to all-time highs.
Current narrative:
The narrative right now is that the USD will get "worthless," setting the stage to take more risk and use more leverage, maybe without even hedging. A surprise variable to this narrative could be devastating to the financial markets—not just in the US, but even to the world. IF/When this happens, everyone will hunt the USD once again, creating a new bullish narrative for the USD, and everyone will be forced to return to the reserve currency.
Nothing in this post should be considered financial advice. Always do your own research and analysis before investing.

"DXY Bullish Setup – High Probability Trade!"🚨 "DXY DOLLAR BANK HEIST" – THIEF TRADING STYLE MASTER PLAN (HIGH-IMPACT TRADE ALERT!)
🔥 "Steal the Market Like a Pro – This DXY Heist Could Print Serious Cash!" 🔥
🌍 Greetings, Market Pirates & Profit Raiders! 🌍
🤑 "Money isn’t made… it’s TAKEN!" 💰💸
Based on the 🔥 Thief Trading Style 🔥 (a lethal mix of technical + fundamental + psychological warfare), we're executing a DXY Dollar Index Bank Heist—a high-stakes robbery where YOU get to keep the loot!
📜 THE HEIST BLUEPRINT (TRADE PLAN)
🎯 ENTRY ZONE – "BREAK THE VAULT DOOR!"
📍Key Trigger: Wait for price to SMASH through the Moving Average Wall (97.700) – then STRIKE!
🔪 Thief’s Entry Trick:
Buy Stop Orders above MA (aggressive)
Buy Limit Orders near recent swing low (smart pullback play)
DCA/Layering Strategy for max profit extraction (real robbers scale in!)
🚨 ALERT SETUP: "Don’t miss the breakout – set an ALARM!" ⏰
🛑 STOP LOSS – "DON’T GET CAUGHT!"
"Yo, rookie! If you’re entering on a breakout, WAIT for confirmation before placing SL!"
📍Thief’s SL Zone: 97.400 (30min swing low – adjust based on your risk appetite!)
⚠️ WARNING: "Place it wrong, and the cops (market) will lock YOU up!" 🚔
🎯 TARGET – "ESCAPE WITH THE LOOT!"
🏆 Primary Target: 98.350 (Take profits before the resistance police show up!)
🔄 Scalper’s Bonus: "Trail your SL, squeeze every pip!"
💡 Pro Tip: "If you’re underfunded, ride with the swing traders – teamwork makes the dream work!"
💣 WHY THIS HEIST WILL WORK (MARKET DYNAMICS)
✅ Bullish Momentum Building (DXY showing strength!)
✅ Overbought? Maybe… but thieves don’t wait for permission!
✅ Trend Reversal Potential (Big money shifting!)
✅ Police (Resistance) Trap Ahead (Escape before they catch you!)
📡 NEWS & RISK MANAGEMENT (DON’T GET BUSTED!)
🚨 High-Impact News? AVOID new trades! (Use trailing stops to lock profits!)
📊 Check COT Reports, Macro Data, Geopolitics (Smart thieves do their homework!)
💥 BOOST THIS HEIST – LET’S GET RICH TOGETHER!
👊 "Hit the LIKE & BOOST button to fuel our next heist!"
💖 "More boosts = More robberies = More FREE money for YOU!" 🚀
⚠️ DISCLAIMER (LEGAL SPEAK)
"This ain’t financial advice – just a damn good robbery plan. Trade at your own risk, and don’t cry if you ignore the SL!" 😎
🔔 Stay tuned for the next heist… The market’s our playground! 🏴☠️💰
🚀 "See you at the next breakout, thief!" 🚀
🔥 #DXY #Forex #Trading #BankHeist #ThiefTrading #ProfitPirates #MakeMoney #TradingView #SmartMoney 🔥

DXY Potential Bullish Reversal – Target 99.456 DXY Potential Bullish Reversal – Target 99.456 🎯
Technical Analysis Overview:
🔹 Trend Structure:
The chart illustrates a recent downtrend, which has been broken as price moved above the descending trendline, signaling a potential trend reversal.
🔹 Pattern Insight:
A bullish harmonic pattern is visible (possibly a bullish Bat or Gartley), with the price reacting from the PRZ (Potential Reversal Zone), aligning with key support near 96.500. The market has respected this zone multiple times, evident from the orange highlighted circles showing price rejections.
🔹 Support & Resistance:
Support Zone: ~96.500
Breakout Zone: ~96.985 (current consolidation near this resistance)
Target Zone: Marked at 99.456, which aligns with previous structure and fib projection.
🔹 Market Sentiment:
Price is consolidating after breaking the downtrend, forming a bullish rectangle (accumulation). The green arrows indicate bullish intent from buyers defending support levels.
🔹 Price Action Signal:
Formation of higher lows.
Break of structure and close above previous highs.
Possible breakout pending above consolidation box.
📊 Conclusion:
DXY shows bullish potential as it builds a base around strong support. A confirmed breakout above the rectangle could fuel a rally toward 99.456. Keep an eye on volume and confirmation candles for entry. ✅

“The Dollar Job: Break-In Strategy for 99+ Profits”💸 “DXY Heist Blueprint: Thieves’ Bullish Breakout Play” 🏴☠️
🌟Hi! Hola! Ola! Bonjour! Hallo! Marhaba!🌟
Welcome, Money Makers & Silent Robbers 🕶️💼✨
This is our next big Thief Trading Heist Plan targeting the 💵 DXY Dollar Index Vault. Armed with both technical precision 🔍 and fundamental insight 📊, we're ready to strike smart — not just fast.
🎯 THE MASTER HEIST PLAN:
🟢 ENTRY POINT – “Heist Entry Protocol”
🎯 Wait for price to break above Resistance @ 99.000 and candle to close ✅
💥 Plan A: Place Buy Stop Orders just above breakout
📥 Plan B: For Pullback Pros, use Buy Limit at recent swing low/high (15m–30m TF)
📌 Tip: Set alerts — don’t get caught napping while the vault opens! ⏰🔔
🛑 STOP LOSS – “Thief’s Escape Hatch”
🧠 Use 4H swing low at 98.100 as SL
⚖️ Adjust based on your lot size and number of open positions
🚨 Don't rush to set SL for Buy Stop entries before confirmation! Patience is part of the plan. 😎
🎯 TARGET – “Mission Objective”
💰 First Exit Target: 100.000
🏃♂️ Optional: Escape earlier near high-risk zones (Blue MA Line Trap Area)
⚔️ SCALPERS' CODE – Stay Sharp!
Only scalp on the Long side.
🔐 Use Trailing SL to guard your loot!
💸 Big wallets? Jump early.
🧠 Smaller stack? Follow the swing crew for coordinated execution.
🌐 MARKET OUTLOOK: WHY THE VAULT’S OPENING
💡 Currently seeing bullish momentum in the DXY
📈 Driven by macroeconomics, sentiment shifts, and intermarket pressure
📰 Want the full debrief? Check our analysis across:
COT Data
Geopolitics & News
Macro Trends & Sentiment
Fundamental Forces
📎🔗 See full breakdown
⚠️ TRADE MANAGEMENT ALERT
🚫 Avoid opening new trades during high-impact news
🔁 Always use Trailing Stops to lock in profits
❤️ Support The Heist – Boost the Plan!
Every boost powers our underground crew 🐱👤.
We rob the markets, not the people. 💼💰
Like & Boost to help grow the Thief Trading Gang 👊💥
Stay tuned, robbers – more heist plans dropping soon.
💸🚀📈🤑

DXY BANK VAULT BREAK-IN: Your Dollar Index Profit Blueprint🚨 DXY BANK HEIST: Dollar Index Breakout Robbery Plan (Long Setup) 🚨
🌟 Hi! Hola! Ola! Bonjour! Hallo! Marhaba! 🌟
Attention, Market Robbers & Dollar Bandits! 🏦💰💸
Using the 🔥Thief Trading Style🔥, we’re plotting a DXY (Dollar Index) bank heist—time to go LONG and escape near the ATR danger zone. Overbought? Yes. Risky? Absolutely. But the real robbery happens when weak hands panic. Take profits fast—you’ve earned this loot! 🏆💵
📈 ENTRY: BREAKOUT OR GET LEFT BEHIND!
Wait for DXY to cross 99.300 → Then strike hard!
Buy Stop Orders: Place above Moving Average.
Buy Limit Orders: Sneak in on 15M/30M pullbacks (swing lows/highs).
Pro Tip: Set a BREAKOUT ALARM—don’t miss the heist!
🛑 STOP LOSS: DON’T GET LOCKED UP!
For Buy Stop Orders: Never set SL before breakout—amateurs get caught!
Thief’s Safe Spot: Nearest swing low (2H chart).
Rebels: Place SL wherever… but your funeral! ⚰️
🏴☠️ TARGET: 102.300 (Bank Vault Cracked!)
Scalpers: Long only! Trail your SL like a pro thief.
Swing Traders: Ride this heist for maximum payout.
💵 MARKET CONTEXT: DXY IS BULLISH (But Traps Await!)
Fundamentals: COT Reports, Fed Plays, Geopolitics.
Intermarket Sentiment: Bonds, Gold, Stocks—all connected.
Full Analysis: Check our bio0 linkks 👉🔗 (Don’t trade blind!).
⚠️ ALERT: NEWS = VOLATILITY = TRAP ZONE!
Avoid new trades during high-impact news.
Lock profits with trailing stops—greed gets you caught!
💥 SUPPORT THE HEIST (OR GET LEFT BROKE!)
Smash that Boost Button 💖→ Stronger team = bigger scores!
Steal profits daily with the Thief Trading Style. 🎯🚀
Next heist coming soon… stay ready! 🤑🐱👤🔥

Free fall on DXY?With gap open at 97.66 level before the monthly close price has broken the monthly support and started to drop. We may see the price to drop to long term monthly support at 96.622 or further below to 95.66 as with the increased bearish pressure we may see the price to continue to drop to this longer term support level.
As with upcoming USD news we may see the price to move to this level with high probability bearish trend.

Dollar Index Analysis: Wedge + Powell Outlook – June 25, 2025📉 Technical Outlook: Bearish Rising Wedge + Liquidity Sweep Setup
TVC:DXY The Dollar Index (DXY) is currently trading within a rising wedge pattern, typically a bearish structure. We're anticipating a fake breakdown, potential sweep of the key demand zone, followed by a reversal move targeting key highs.
🔍 Key Technical Zones
📥 Demand Zone (Buy Area):
🔵 97.50 – 97.20 = Institutional accumulation + unfilled orders
🚫 Invalidation Level (Stop-Loss) :
❌ 96.70 = Clean break below confirms full bearish continuation
🎯 Target Projections (Upside Levels) :
TP1: 99.00
TP2: 100.00
TP3: 101.04 (HTF swing high liquidity cleanout)
🧠 Summary Setup :
Downtrend
Rising wedge formation
Sweep of 97.20 possible
Watch for fakeout & reversal play toward 101.04
🏛️ Fundamental Analysis – Powell’s Testimony Insights
Fed Chair Powell highlighted the following during his recent testimony:
🔄 “We’re not there yet on inflation” — Core services remain sticky
🛑 No immediate rate cuts — Growth is slowing but not crashing
🕰 Rate cuts likely postponed to Q4 2025
🔐 “Real rates are restrictive enough” = No more hikes expected
💡 Implication for DXY :
✅ Short-term bullish bias as higher U.S. yields remain attractive if rate cuts are delayed.
🌍 Macro Context Snapshot (as of June 25, 2025)
🇺🇸 US Disinflation: CPI & PCE easing, but not collapsing
🇪🇺 ECB Cut in June: Euro may weaken further
🇯🇵 BOJ Policy Unclear: USD/JPY likely volatile
🌐 Global Risk Appetite High: Volatility may return with geopolitical events
🔥 Watch This: Trade Tariff Narrative Heating Up
🚨 New U.S. Tariff Signals on Chinese tech and EU autos are resurfacing. This could:
Push inflation risk higher
Delay Fed’s easing timeline
Add support to USD short term as markets price in geopolitical tension and uncertainty
📌 Trading Strategy Recap :
Monitor wedge support near 97.20
Look for fakeout/sweep and bullish reversal
Target 99–101 zone on rebound
Stay alert to Powell/Fed rhetoric + tariff news
If you find this analysis helpful, Like, Comment, and Follow for more DXY, gold, and macro trades!

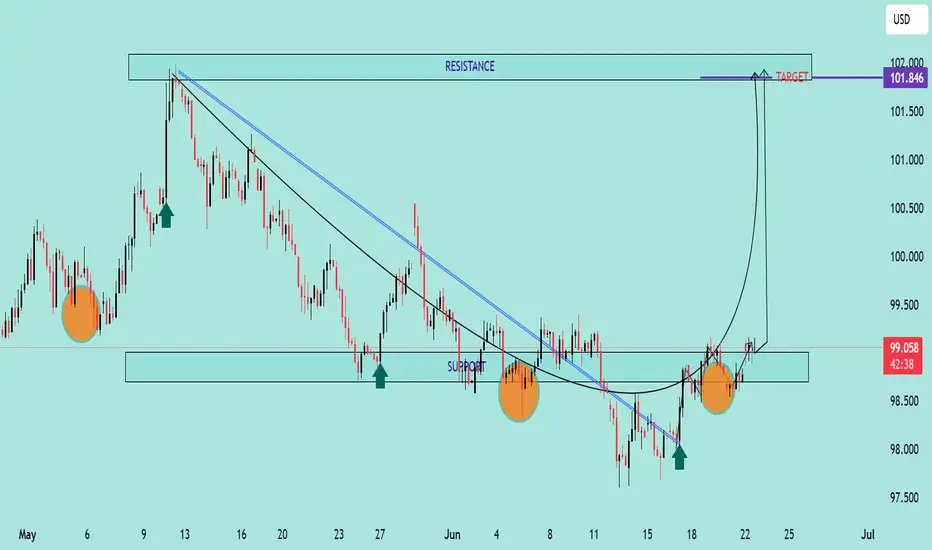
DXY Bullish Reversal & Cup Formation The DXY (US Dollar Index) is exhibiting a strong bullish reversal pattern, with multiple technical signals suggesting upward momentum:
🔍 Technical Analysis Summary:
✅ Support Holding Strong:
Price has respected the horizontal support zone around 98.00–98.50 on multiple occasions (highlighted by orange circles and green arrows), forming a solid base.
✅ Breakout from Downtrend:
A clear breakout above two descending trendlines (black and blue) indicates a shift from bearish to bullish sentiment.
✅ Cup Pattern Formation ☕:
A textbook Cup pattern is visible, where price formed a rounded bottom — a bullish continuation formation. The handle is minor and price has broken above the neckline (around 99.00), signaling a potential continuation toward the target.
✅ Bullish Target 🎯:
Based on the cup pattern and prior resistance, the projected target is around 101.846, aligning with previous major resistance.
📌 Key Levels to Watch:
Support Zone: 98.00 – 98.50
Immediate Resistance: 99.50 – 100.00
Major Resistance/Target: 101.846
🧭 Outlook:
As long as the price remains above the 98.50 zone, the bullish scenario remains intact. The cup breakout indicates strong buying pressure, and momentum could push DXY toward the 101.846 target in the coming sessions.
DXY: US dollar To Drop Further Around 95?The US dollar has been steadily declining since the new president was elected in the USA. This decline has been accompanied by the ongoing trade wars. Numerous economic indicators have supported this trend, and we anticipate further depreciation in the coming days or weeks. Before trading, it’s essential to conduct your own analysis and gain a comprehensive understanding of the market.
We wish you the best of success in trading. Good luck and trade safely.
Like and comment for more, and as always, happy trading!
Team Setupsfx_

Index/US) Bearish trend analysis Read The caption)SMC trading point update
Technical analysis of U.S. Dollar Index (DXY) on the 30-minute timeframe, with the price respecting a clear downtrend and repeatedly rejecting a resistance zone near the 200 EMA.
---
Analysis Breakdown
Key Technical Elements:
1. Downtrend Structure:
The price remains within a descending channel.
Multiple lower highs and lower lows signal sustained bearish pressure.
2. Resistance Zone:
Highlighted near 98.490–98.495, aligned with the EMA 200.
Multiple rejections from this level (indicated by red arrows), confirming strong supply.
3. EMA 200 (98.490):
Acts as dynamic resistance.
Price is below it, reinforcing the bearish bias.
4. Projected Move:
Bearish price path targets the 97.189 level (target point).
A measured move of approximately -1.30% is illustrated.
5. RSI (14):
RSI currently at 46.27, below the neutral 50 mark.
This confirms bearish momentum without being oversold, leaving room for further downside.
---
Bearish Thesis:
Repeated failure to break above key resistance + downward channel + RSI weakness suggests a continuation to the downside.
Short-term consolidation expected before breakdown continuation.
---
Trade Idea Concept:
Entry: Sell on a minor pullback near resistance (~98.300–98.490), or breakdown below the recent minor support.
Target: 97.189 zone.
Stop Loss: Above 98.500 or EMA 200 to invalidate the bearish setup.
Mr SMC Trading point
Risks to Watch:
A break and strong close above 98.500 would invalidate the bearish structure and could initiate a trend reversal.
Economic events (noted by calendar icons) may trigger volatility – ideal to monitor closely around those times.
plesse support boost 🚀 this analysis)

U.S. Dollar Index (DXY) Bearish Setup – Supply Zone Rejection & 🔹 Trend Overview
📊 Overall Trend: Bearish (Downtrend)
📉 Price is forming lower highs and lower lows within a descending channel.
🔻 Recently bounced off a support zone, now heading toward a potential pullback.
🔵 Supply Zone (Resistance Area)
📍 Zone Range: 100.049 – 100.601
🧱 Acts as a resistance block where sellers might step in.
📏 Confluent with EMA 70 at 100.178, strengthening its validity.
🔸 Trade Setup – Short Position
🟠 ENTRY POINT: 100.088
❌ STOP LOSS: 100.587 – 100.595 (Just above supply zone)
🎯 TARGET: 98.000 (With intermediate support levels)
📌 Support Levels
🔹 98.112 – First minor support
🔹 98.106 – Close-range confirmation
🔹 97.885 – Additional support zone
🟦 Main Target: 98.000
⚖️ Risk/Reward Ratio
🟧 Small risk above supply zone
🟩 Large reward to downside = Favorable R:R
📌 Summary
📈 Expecting a pullback into supply zone.
🧨 Look for bearish confirmation around 100.088.
🎯 Target the downside at 98.000 for profit.

DXY Analysis today : Possible reversal?With strong liquidity grab at 99.00 DXY, with monthly rejection to the upside, past week we have seen with gap open the market started to drop long term support level 99.000 which smart money zone price has got bounce back to the upside with strong momentum potentially forming a double bottom with series of higher low price may continue to move up to the 100.75 to long term monthly resistance with NFP we may see further rejection down again.
A bullish on support is high probability !

DXY Technical Outlook – Strong Support Test and Bullish Reversa Chart Summary
The DXY (U.S. Dollar Index) chart illustrates a significant technical structure between strong historical support and resistance zones, with potential for a bullish reversal after a key level retest.
🟢 Key Support Zone: 99.000 – 98.000
📍 Labeled as "STRONG SUPPORT", this zone has held multiple times:
Previous bounce: Early 2023 ✅
Mid-2024 rebound ✅
Current price action once again shows a reaction from this level with a bullish candle forming 🔥
📌 EMA Confluence:
The 200 EMA (blue) sits at 102.401
The 50 EMA (red) at 103.725
Price is currently below both EMAs but near the 200 EMA, suggesting potential for a mean reversion bounce 📈
🔴 Resistance Zones to Watch:
Resistance Zone: 109.000 – 110.000
⛔ Historically rejected in late 2023 and again in early 2025
🧱 Acting as a supply zone — watch for rejection or breakout
ATH Supply Zone: 113.000 – 114.000
🚨 This is a major psychological and technical barrier
🫡 Marked as “NEW ATH” – would need strong momentum and fundamentals for a breakout above this level
📈 Price Action Expectations:
With strong support respected again, a bullish reversal toward 109.000 – 110.000 appears likely (as illustrated by the arrow).
If momentum continues, a retest of ATH zone is on the cards 🔭
However, a failure to hold support could lead to breakdown below 98.000 – watch closely 🔍
🧭 Strategic Insight
Bullish Bias while above support (98.000 zone)
Reversal Confirmation needed above 102.401 (200 EMA) and 103.725 (50 EMA)
Watch for rejection near 110.000 resistance before ATH test
📌 Final Note:
🧊 World Eyes on this Level – As highlighted on the chart, the current support area is under global observation, reinforcing its importance.
🕵️♂️ Stay alert for breakout volume and fundamental catalysts (e.g., Fed decisions, CPI, jobs data).
