Watching the DXY for Bitcoin Direction...The DXY is at a pivotal point here, and potentially breaking higher into a new upward trend channel.
This would be bad for Bitcoin and crypto overall as the DXY has a strong inverse relationship.
If the DXY stays in this area and drifts lower we could see a short-term crypto rally including Bitcoin and Ethereum.
If it breaks up above the 103.5 to 104 level, then we're into a crypto pullback zone.
If we continue dropping back into the downward trending channel then we're in the crypto rally a zone, and possibly even down below 100 into the crypto super pump rally zone.
Hard to say here...
Dxytradingsetup

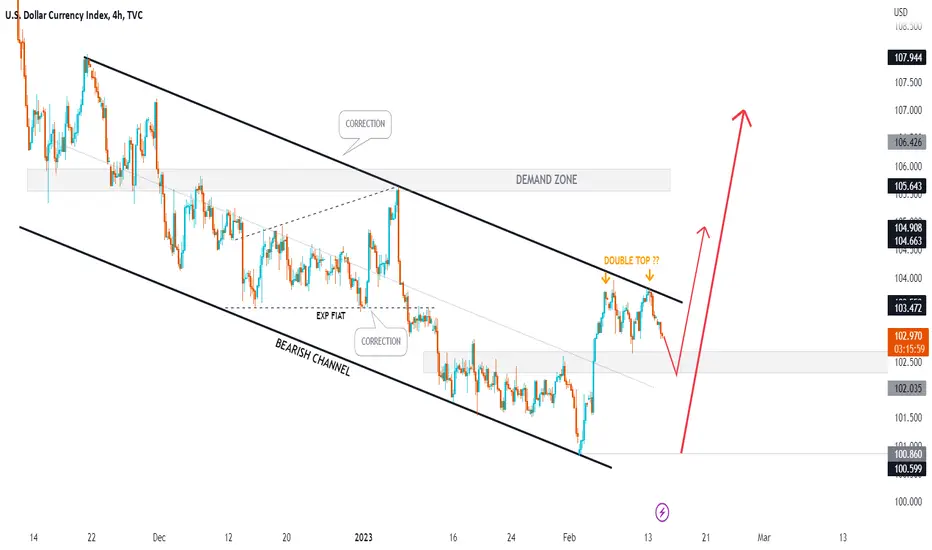
DXY INDEX Next Move Before CPI Pair : DXY Index
Description :
Bearish Channel as a Corrective Pattern and Rejecting from the Upper Trend Line #UTL
Double Top Pattern in Short Term
RSI Divergence
EMAs Crossing Each other and Indicating us the Sell in Short Time Frame
Break of Structure and Making its Retracement
Completed " 13245 " Impulsive Wave and Making " a " Corrective Wave
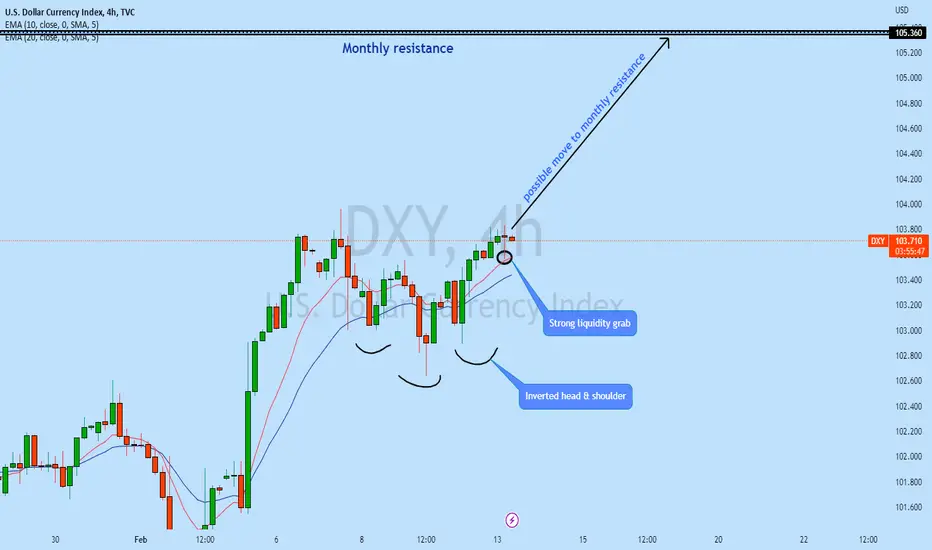
DXY is set for a rise!Currency Pair : DXY
Possible direction : Bullish
Technical Analysis : After market opening DXY has broken out the resistance with strong liquidity grab from the strong support zone. it is highly likely price will continue to rise as long term trend is bullish and we have seen multiple liquidity grab along the way
Possible trade recommendation : Bullish as per chart sketch
Press like button if you enjoy.
Risk Disclaimer: Trading foreign exchange on margin carries a high level of risk, and is not suitable for all investors. Past performance is not indicative of future results. The high degree of leverage is dangerous and can work against you as well as for you. Before deciding to invest in foreign exchange or any market you should carefully consider your investment goals, level of experience, and risk tolerance. It is EXTREMELY LIKELY that you will sustain a loss of some or all of your initial investment and therefore you should not invest money that you cannot afford to lose. No representation is being made that any account will or is likely to achieve profits or losses. Past performance is not indicative of future results. Individual results vary and no representation is made that clients will or are likely to achieve profits or incur losses comparable to those that may be shown. You acknowledge and agree that no promise or guarantee of success or profitability has been made between you, and Forex Trading Wizard. Do your own research and talk to a professional financial planner in order to be aware of all the risks associated with foreign exchange trading and investing and seek advice from an independent financial advisor before risking any capital.
DXY Index Monthly Move ??Pair : DXY Index
Description :
Bullish Channel as a Corrective Pattern
Break of Structure
Breakout the Consolidation Phase and Completed the Retracement
Rejecting from the Fibonacci Level - 50.00%
Divergence

DXY LONG PLAY 13-02-23 (Daily)I have been bullish on DXY for a few weeks now, I'm targetting consequent encouragement on the large upside wick on the weekly chart. The previous target was filled perfectly.

Dollar Index Chart Analysis....
In this situation DXY chart create Bullish Flag Pattern.So,If breakout @103.777
resistance level, then market Buy UP to 103:999 ; @ 104.720 and 105:600 resistance level.
Then market need seems sell correction to nearest Support 104.950 level.
AronnoFX will not accept any liability for loss or damage as a result of
reliance on the information contained within this channel including
data, quotes, charts and buy/sell signals.
If you like this idea, do not forget to support with a like and follow.
Traders, if you like this idea or have your own opinion about it,
write in the comments. I will be glad.

dxy sell limit orderdxy sell signal
It is located in the range of the ceiling of the descending channel and it seems that it will fall to the bottom of the channel after reaching the limit of losses
DXY Index Next Move ?Pair : DXY Index
Description :
Impulse Correction
Fibonacci Retracement
Bearish Channel as a Corrective Pattern in Short Time Frame
S / R Level
Rejecting from the Current Demand Zone
Divergence

#DXYWe are in a channelized space of a decreasing trend of daily time.
Currently, we are witnessing a negative reaction in dealing with the ceiling with a negative divergence. It is expected that by breaking the resistance zone of 102.808 based on a combination of static and pivot point, it can touch the target of 102.455, which is on the static ceilings from the previous wave. has it .
After that, if 102.455 breaks, you can expect to touch the midline of the channel.

DXY Index 6 Jan -10 Jan Move Bullish ??Pair : DXY Index
Description :
Symmetrical Triangle Pattern as a Corrective Pattern in Monthly Time Frame and we have a Breakout and Retracement
Break of Structure
Divergence
Bullish Channel
Fibonacci Level

DXY LONG PLAY 06-02-23 (H1)
The weekly close was very bullish, this is my first target next week. I am targeting the daily FVG and equilibrium of the FVG. My long-term play is the weekly volume imbalance as it has been for a few weeks but it may take months to play out.

DXY LONG PLAY 06-02-23 (H4)The weekly close was very bullish , this is my first target next week. I am targeting the daily FVG and equilibrium of the FVG. My long-term play is the weekly volume imbalance as it has been for a few weeks but it may take months to play out.

DXY LONG PLAY 06-02-23 (Daily)The weekly close was very bullish, this is my first target next week. I am targeting the daily FVG and equilibrium of the FVG. My long-term play is the weekly volume imbalance as it has been for a few weeks but it may take months to play out.

#DXY- LONG-After last week NFP data and recent CPI data has weaken DXY, however, we are expecting a smooth reversal at our area.
-The fear in the market has led DXY suffer heavily.


DXY Short Play 30-01-23 Weekly TargetWeekly Volume imbalance is the target, this has been the target for a few weeks now. Major news events later in the week should help price to the target.


DXY Short Play 23-01-23I'm expecting a bearish week for DXY, I believe we are heading for the weekly volume imbalance at 97.2.

DXY 23 Jan - 27 Jan Next MovePair : DXY Index
Description :
Impulse Correction Impulse - Completed " ABC " Corrective Wave after Long Impulse
Descending Triangle as a Corrective Pattern in Short Time Frame we need to Wait Until it Breaks the Upper / Lower Trend Line
Selling Divergence
If Breaks then Next Target Daily Support Level
Break of Structure

Plan A or Plan B on this index?Hello, my dear friends and fellow traders.
What we are going to look at today is the US dollar index. When looking at the daily chart this is a good setup for the price of this index to go up. if we see if this index can be taken long position, according to the daily time scale in this index, it is at the lower side. Very dangerous one to take a long position. But it has the potential to go up.
So, keep the trailing stop small in this. If you take it for a long time, there is a 1:2 RR chance of giving it. Also, it has a 1:8 chance of giving a good move to go up.
However, due to the current opposition, there are chances to stop this rally. So, the first profit target in this should be 1:2. Then if you want you can keep 1:8 but it depends on the system.
Till then wishing you a good luck on this strategy. See you in my next post.
It is wise to follow your risk management before taking entry.
I love to share my ideas. Feel free to revise the text and provide feedback. It makes it so personal and improve us in better ways.
CAPITALCOM:DXY
Thanks & regards,
Alpha Trading Station
Disclaimer: This view is for educational purpose only & any stock mentioned here should not be taken as a trading/investing advice. We may or may not have position in the stocks mentioned here. Please consult your financial advisor before investing. Because Price is the "King of Market".

DXY DAILY BIAS (HOURLY) 17-01-23I believe the next draw on liquidity is the FVG at 102.108 - 101.994.

Dollar Index (DXY) still in uptrendsAccording to the DXY market chart, the uptrend continues, as it has since 1981. According to the GDP growth data of 1980 to 1982. GDP was negative for six of the 12 quarters. The worst was Q2 1980 at -8.0%.24 Unemployment rose to 10.8% in November and December 1982. It was above 10% for 10 months.
From 2020 to 2022, the GDP was negative for four of the eleven quarters. Q4 of 2022 is pending, but the overall GDP situation is the same; the rate hikes are higher to combat inflation. In 2020, unemployment during the COVID period was 14%, but overall after COVID, it was around 3.7%.
The market structure of DXY says the recent decline of DXY is a market uptrend signal. The support level is from December 1981 and the resistance is the same as in August 1981.

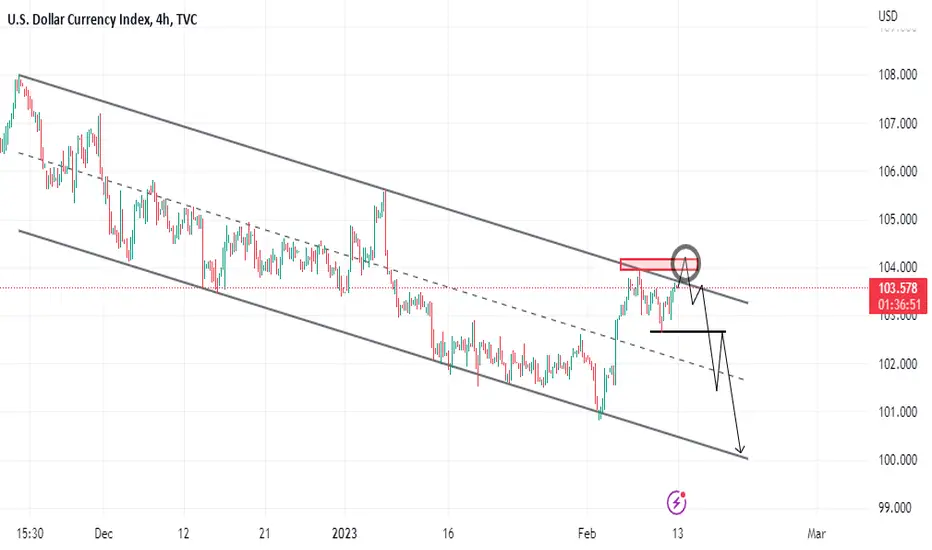
DXY set for big drop!DXY is in long term down trend. Currently price has broken out of the local resistance and grab strong liquidity and started to drop again giving us potential for further drop as the price has grabbed liquidity, highly likely DXY will continue to drop towards it's long term down trend
On the retest, of the resistance, a sell trade is high probable.
