DXY Bearish Setup: Sell from Supply Zone to 99.100 TargetTrend: 📉 Bearish Bias
Key Zones & Strategy:
🔶 Supply Zone (Sell Area)
📍 100.584 – 100.906
⚠️ Price may face selling pressure here
🔵 Entry Point:
🎯 100.584 (bottom of supply zone)
🔴 Stop Loss:
❌ 100.906 (just above resistance)
🟢 Target Point:
✅ 99.100
📉 Aligned with lower support line
Technical Indicators:
📏 Descending Channel
🔽 Price moving within parallel downward trend lines
📊 EMA (70) – Orange Line
🔁 Acting as dynamic resistance
Trade Setup Summary:
📌 Sell in the Supply Zone
🛑 Stop Loss: 100.906
🎯 Target: 99.100
⚖️ Good Risk-Reward Ratio
Warnings & Tips:
⚡ Watch for Breakouts:
If price breaks above 100.906 ➡️ 📈 Bearish idea invalid
📰 Check News Events:
FOMC, CPI, or other USD events may cause volatility
Dxytradingsetup

USD Index (DXY) Short Setup: Reversal Expected from Resistance Z1. Entry Point: ~102.430
The price is currently below this level at 101.583, suggesting a potential short setup once the entry level is reached or confirmed.
2. Stop Loss: ~103.196
This is the price level where losses are limited if the trade moves against the intended direction. It's placed above a strong resistance zone.
3. Resistance Point: ~100.580
This was a previous resistance level which has now been broken, indicating a bullish push. The current price is above this, which may signal a breakout.
4. EA Target Point: ~97.857
The take-profit level, significantly lower, indicating a bearish target. This suggests a short position is intended from the entry point.
Indicators and Signals
The chart uses moving averages (likely 50 EMA and 200 EMA), and the price has surged above them, often a bullish signal.
However, the analysis seems to anticipate a reversal from the 102.430 level, expecting a drop back down toward 97.857.
The move from the current price to the target would be a 4.40% decline, a significant move for an index.
Trade Plan Summary
Trade Type: Likely a short/sell from the 102.430 level.
Risk: ~0.77 (103.196 - 102.430)
Reward: ~4.57 (102.430 - 97.857)
Risk-to-Reward Ratio: Approx. 1:6, which is favorable if the setup works out.

DXY USD INDEX FORECAST Q2 W18 Y25DXY USD INDEX FORECAST Q2 W18 Y25
Professional Risk Managers👋
Welcome back to another FRGNT chart update📈
Diving into some Forex setups using predominantly higher time frame order blocks alongside confirmation breaks of structure.
✅ U.S. dollar index is a measure of the value of the dollar against a basket of six foreign currencies.
✅The currencies are the Euro, Swiss franc, Japanese yen, Canadian dollar, British pound, and Swedish krona.
💡Here are some trade confluences📝
✅ Break an d close below July 2023 key 100.00 levels.
✅ Foresee a pull back to, weekly imbalance, daily order block, daily 50ema, weekly order block and or weekly 50 ema.
✅ Awaiting to identify a significant break of structure bullish to use the DXY as confluence for our trading week 18 of Q2 toward key points of interest mentioned above.
✅ Forecasting continued bearish pressure long term.
✅Initially bullish outlook however upon price turn around. DXY to break 100.000 level again.
🔑 Remember, to participate in trading comes always with a degree of risk, therefore as professional risk managers it remains vital that we stick to our risk management plan as well as our trading strategies.
Pairs to look out for -
EURUSD
USDCHF
USDJPY
USDCAD
GBPUSD
📈The rest, we leave to the balance of probabilities.
💡Fail to plan. Plan to fail.
🏆It has always been that simple.
❤️Good luck with your trading journey, I shall see you at the very top.
🎯Trade consistent, FRGNT X

DXY "Dollar Index" Market Bullish Heist Plan (Day or Swing)🌟Hi! Hola! Ola! Bonjour! Hallo! Marhaba!🌟
Dear Money Makers & Robbers, 🤑 💰💸✈️
Based on 🔥Thief Trading style technical and fundamental analysis🔥, here is our master plan to heist the DXY "Dollar Index" Market. Please adhere to the strategy I've outlined in the chart, which emphasizes long entry. Our aim is the high-risk ATR Line. Risky level, overbought market, consolidation, trend reversal, trap at the level where traders and bearish robbers are stronger. 🏆💸"Take profit and treat yourself, traders. You deserve it!💪🏆🎉
Entry 📈 : "The heist is on! Wait for the MA breakout (99.900) then make your move - Bullish profits await!"
however I advise to Place Buy stop orders above the Moving average (or) Place buy limit orders within a 15 or 30 minute timeframe most recent or swing, low or high level for Pullback entries.
📌I strongly advise you to set an "alert (Alarm)" on your chart so you can see when the breakout entry occurs.
Stop Loss 🛑: "🔊 Yo, listen up! 🗣️ If you're lookin' to get in on a buy stop order, don't even think about settin' that stop loss till after the breakout 🚀. You feel me? Now, if you're smart, you'll place that stop loss where I told you to 📍, but if you're a rebel, you can put it wherever you like 🤪 - just don't say I didn't warn you ⚠️. You're playin' with fire 🔥, and it's your risk, not mine 👊."
📍 Thief SL placed at the nearest/swing low level Using the 1H timeframe (98.900) Day / Swing trade basis.
📍 SL is based on your risk of the trade, lot size and how many multiple orders you have to take.
🏴☠️Target 🎯: 101.400 (or) Escape Before the Target
🧲Scalpers, take note 👀 : only scalp on the Long side. If you have a lot of money, you can go straight away; if not, you can join swing traders and carry out the robbery plan. Use trailing SL to safeguard your money 💰.
💰💵💸DXY "Dollar Index" Market Heist Plan (Swing/Day Trade) is currently experiencing a Bullish trend.., driven by several key factors.☝☝☝
📰🗞️Get & Read the Fundamental, Macro, COT Report, Geopolitical and News Analysis, Sentimental Outlook, Intermarket Analysis, Index-Specific Analysis, Future trend targets with Overall outlook score... go ahead to check 👉👉👉🔗🔗
⚠️Trading Alert : News Releases and Position Management 📰 🗞️ 🚫🚏
As a reminder, news releases can have a significant impact on market prices and volatility. To minimize potential losses and protect your running positions,
we recommend the following:
Avoid taking new trades during news releases
Use trailing stop-loss orders to protect your running positions and lock in profits
💖Supporting our robbery plan 💥Hit the Boost Button💥 will enable us to effortlessly make and steal money 💰💵. Boost the strength of our robbery team. Every day in this market make money with ease by using the Thief Trading Style.🏆💪🤝❤️🎉🚀
I'll see you soon with another heist plan, so stay tuned 🤑🐱👤🤗🤩

Bearish sentiment on the USD index (DXY)TVC:DXY
On this trading week (April 14-18), we have not seen much volatility in the USD index, with its highest trading point at approximately 100.3 and lowest 99.2, partly due to a long bank holiday for Good Friday and Easter on the following Monday. On last week's Friday, price briefly tapped into the weekly demand zone and gave a quick reaction upwards to the 4-hour supply zone, which then quickly rejected and cooled price back down. Currently, price is still sitting at the lower point of the weekly range, we can expect DXY to have a very short-term push back to this strong 4-hour swap zone above, possibly creating a higher high, before pushing it back down. Price is very likely to take out the weekly lows and continue to push towards the bottom of the weekly demand zone.
On fundamentals, Bank of America's analysts had identified close relationship of its depreciating USD, with its falling US asset and equities values. Economic activities have also declined due to trade wars and huge uncertainty of the upcoming policy changes by the Trump administration; asset managers and central banks may also continue to sell USD. Besides, the US is very likely to continue reducing its interest rates in order to boost its economic activity. One of the reasons why Trump imposed high tariffs into many countries was to reduce international dependency on the manufacturing sector and trade deficits, and to attract foreign investments to set up factories in the US, in order to sell to consumers at the 'good price'. However, it is still very controversial on how effective it is, business owners abroad may perceive Trump's policies as bipolar, which changes depending on his mood, therefore, majority of businesses would rather partner elsewhere than to put themselves through this hassle. USD has also dropped 10% since the start of 2025 and has reached its lowest in three years.
References:
www.investing.com
www.cbsnews.com

DXY / Dollar Index Market Heist Plan (Scalping / Day Trade)🌟Hi! Hola! Ola! Bonjour! Hallo! Marhaba!🌟
Dear Money Makers & Robbers, 🤑 💰💸✈️
Based on 🔥Thief Trading style technical and fundamental analysis🔥, here is our master plan to heist the DXY / Dollar Index Market. Please adhere to the strategy I've outlined in the chart, which emphasizes long entry. Our aim is the high-risk Red Zone. Risky level, overbought market, consolidation, trend reversal, trap at the level where traders and bearish robbers are stronger. 🏆💸"Take profit and treat yourself, traders. You deserve it!💪🏆🎉
Entry 📈 : "The heist is on! Wait for the MA breakout (104.550) then make your move - Bullish profits await!"
however I advise to Place Buy stop orders above the Moving average (or) Place buy limit orders within a 15 or 30 minute timeframe most recent or swing, low or high level.
📌I strongly advise you to set an alert on your chart so you can see when the breakout entry occurs.
Stop Loss 🛑:
Thief SL placed at the recent/swing low level Using the 1H timeframe (103.800) Day trade basis.
SL is based on your risk of the trade, lot size and how many multiple orders you have to take.
🏴☠️Target 🎯: 105.400 (or) Escape Before the Target
🧲Scalpers, take note 👀 : only scalp on the Long side. If you have a lot of money, you can go straight away; if not, you can join swing traders and carry out the robbery plan. Use trailing SL to safeguard your money 💰.
DXY / Dollar Index Market Heist Plan (Scalping / Day Trade) is currently experiencing a bullishness,., driven by several key factors.
📰🗞️Get & Read the Fundamental, Macro, COT Report, Quantitative Analysis, Sentimental Outlook, Intermarket Analysis, Index-Specific Analysis, Positioning and future trend targets.. go ahead to check 👉👉👉
⚠️Trading Alert : News Releases and Position Management 📰 🗞️ 🚫🚏
As a reminder, news releases can have a significant impact on market prices and volatility. To minimize potential losses and protect your running positions,
we recommend the following:
Avoid taking new trades during news releases
Use trailing stop-loss orders to protect your running positions and lock in profits
💖Supporting our robbery plan 💥Hit the Boost Button💥 will enable us to effortlessly make and steal money 💰💵. Boost the strength of our robbery team. Every day in this market make money with ease by using the Thief Trading Style.🏆💪🤝❤️🎉🚀
I'll see you soon with another heist plan, so stay tuned 🤑🐱👤🤗🤩

DXYDXY Index
- Completed " 12345 " Impulsive Waves
- Break of Structure
- RSI - Divergence
- Bullish Channel as an corrective pattern in Short Time Frame
- Support Level

U.S. Dollar Index (DXY) – Key Resistance & Bearish Target Analys📊 Key Observations:
🔵 Resistance Zone (📍~103.5 Level)
A strong resistance area (🔵 blue box) is marked, indicating potential selling pressure if the price reaches this level.
The price is moving upwards (📈) towards this resistance, so watch for rejection or breakout.
🔵 Support/Target Zone (📍~101.5 Level)
A lower support zone (🔵 blue box) is marked as the bearish target 🎯.
If the price fails at resistance, it may head downwards (📉) to this level.
📉 Recent Price Action:
🚀 Sharp drop followed by a rebound (📈).
The price is currently moving back up (🔼), possibly forming a lower high before another drop.
📌 Exponential Moving Average (DEMA 9 - 102.488)
The price is hovering above the 9-period DEMA (📏), showing short-term bullish momentum.
If the price rejects resistance and falls below the DEMA, a bearish continuation (📉) is likely.
🚀 Potential Scenarios:
✅ Bullish Breakout: If price breaks above 🔵 resistance, it may continue rising (📈) to higher levels.
❌ Bearish Rejection: If price fails at resistance, expect a drop (📉) towards 101.5 🎯.

U.S. Dollar Index (DXY) - Bearish Breakdown or Reversal?📊 U.S. Dollar Index (DXY) - 4H Chart Analysis
🔵 Supply Zone (104.400 - 104.683)
🟦 Resistance area where sellers may step in 📉
🟡 Key Level (~104.200)
🟧 Decision point – price struggling to hold this level
📉 Trend Line (Broken) 🔻
❌ Previous uptrend is broken, signaling potential bearish momentum
🟢 Demand Zone (103.200 - 103.400)
🟩 Support area where buyers may get active 📈
🚀 Potential Market Movement:
1️⃣ Bearish Breakdown Expected ⬇️
🔹 Price broke below trendline ➡️ selling pressure increasing
🔹 Possible pullback to key level (~104.200) before more downside
🔹 Targeting demand zone (~103.200-103.400) 🎯
2️⃣ Invalidation/Stop-Loss 🚫
🔺 If price moves back above 104.683, bearish setup is invalid
🔺 Stop-loss placed at 104.683 for risk management
🎯 Trading Strategy:
✅ Short Entry: After pullback near 104.200
🎯 Target: 103.200 demand zone
⚠️ Stop Loss: Above 104.683

Dollar Index at Risk: Key Support Holds the Fate of the TrendThe U.S. Dollar Index (DXY) has broken down from a Head & Shoulders pattern, confirming a bearish reversal after a successful retest of the neckline. The price is currently near a key support area, and if it fails to hold, a drop toward the lower strong support zone is likely.
Additionally, RSI is showing bearish divergence and is below the neutral 50 level, indicating weakening momentum.
DYOR, NFA

"DXY/Dollar Index" Bull Money Heist Plan (Scalping / Day Trade)🌟Hi! Hola! Ola! Bonjour! Hallo! Marhaba!🌟
Dear Money Makers & Robbers, 🤑 💰💸✈️
Based on 🔥Thief Trading style technical and fundamental analysis🔥, here is our master plan to heist the "DXY/Dollar Index" Indices Market. Please adhere to the strategy I've outlined in the chart, which emphasizes long entry. Our aim is the high-risk Red Zone. Risky level, overbought market, consolidation, trend reversal, trap at the level where traders and bearish robbers are stronger. 🏆💸"Take profit and treat yourself, traders. You deserve it!💪🏆🎉
Entry 📈 : "The heist is on! Wait for the MA breakout (104.100) then make your move - Bullish profits await!"
however I advise to Place Buy stop orders above the Moving average (or) Place buy limit orders within a 15 or 30 minute timeframe most recent or swing, low or high level.
📌I strongly advise you to set an "alert (Alarm)" on your chart so you can see when the breakout entry occurs.
Stop Loss 🛑:
Thief SL placed at the recent/swing low level Using the 1H timeframe (103.500) Scalping/Day trade basis.
SL is based on your risk of the trade, lot size and how many multiple orders you have to take.
🏴☠️Target 🎯: 105.000 (or) Escape Before the Target
🧲Scalpers, take note 👀 : only scalp on the Long side. If you have a lot of money, you can go straight away; if not, you can join swing traders and carry out the robbery plan. Use trailing SL to safeguard your money 💰.
"DXY/Dollar Index" Indices Market Heist Plan (Scalping / Day Trade) is currently experiencing a bullishness,., driven by several key factors.
📰🗞️Get & Read the Fundamental, Macro Economics, COT Report, Geopolitical and News Analysis, Sentimental Outlook, Intermarket Analysis, Index-Specific Analysis, Positioning and future trend targets... go ahead to check 👉👉👉🔗
⚠️Trading Alert : News Releases and Position Management 📰 🗞️ 🚫🚏
As a reminder, news releases can have a significant impact on market prices and volatility. To minimize potential losses and protect your running positions,
we recommend the following:
Avoid taking new trades during news releases
Use trailing stop-loss orders to protect your running positions and lock in profits
💖Supporting our robbery plan 💥Hit the Boost Button💥 will enable us to effortlessly make and steal money 💰💵. Boost the strength of our robbery team. Every day in this market make money with ease by using the Thief Trading Style.🏆💪🤝❤️🎉🚀
I'll see you soon with another heist plan, so stay tuned 🤑🐱👤🤗🤩

DXY Update – Two Possible Scenarios! 📢 DXY Update – Two Possible Scenarios! 📢
1️⃣ Bearish Scenario: Looking for sell from the Bearish OB 🎯
2️⃣ Bullish Scenario: If price doesn’t reach the Bearish OB, we shift focus to the Bullish OB for a potential buy ✅
📌 Waiting for price to approach key zones & using confirmations for entry!
📊 Stay updated with our latest analysis – Follow our TradingView page! 🚀

DXY Dollar Index Market Bearish Heist Plan🌟Hi! Hola! Ola! Bonjour! Hallo!🌟
Dear Money Makers & Robbers, 🤑 💰🐱👤🐱🏍
Based on 🔥Thief Trading style technical and fundamental analysis🔥, here is our master plan to heist the DXY Dollar Index Market. Please adhere to the strategy I've outlined in the chart, which emphasizes short entry. Our aim is the high-risk Green Zone. Risky level, oversold market, consolidation, trend reversal, trap at the level where traders and bullish thieves are getting stronger. 🏆💸Book Profits Be wealthy and safe trade.💪🏆🎉
Entry 📈 : "The heist is on! Wait for the breakout (37800) then make your move - Bearish profits await!"
however I advise placing Sell Stop Orders below the breakout MA or Place Sell limit orders within a 15 or 30 minute timeframe. Entry from the most recent or closest low or high level should be in retest. I Highly recommended you to put alert in your chart.
Stop Loss 🛑: Thief SL placed at 38500 (swing Trade Basis) Using the 4H period, the recent / swing high or low level.
SL is based on your risk of the trade, lot size and how many multiple orders you have to take.
Target 🎯: 36500 (or) Escape Before the Target
🧲Scalpers, take note 👀 : only scalp on the Short side. If you have a lot of money, you can go straight away; if not, you can join swing traders and carry out the robbery plan. Use trailing SL to safeguard your money 💰.
📰🗞️Fundamental, Macro, COT, Sentimental Outlook:
DXY Dollar Index Market is currently experiencing a Bearish trend., driven by several key factors.
⚡Fundamental Analysis
Fundamental factors driving DXY focus on U.S. economic conditions, Fed policy, and global currency dynamics.
Interest Rates:
U.S. Federal Reserve: Rates steady at 3-3.5%, down from 2024’s 4.5-5%. Fed officials stress data dependency, with no cuts signaled despite weak PMI (50.4) and jobless claims (219,000 vs. 215,000 forecast). Real yields (10-year Treasury at 3.8%, ~1% inflation-adjusted) support USD.
Other Countries: ECB at 2.5%, BoJ at 0.25-0.5%, BoE at 4-4.5%—U.S. yield advantage persists, though narrowing.
Impact: Bullish for DXY, tempered by global easing.
Inflation:
U.S.: PCE at 2.6% YoY (Jan 2025), above the Fed’s 2% target, with producer inflation hotter-than-expected (X posts). Inflation fears linger, supporting USD.
Other Countries: Eurozone at 2.8%, Japan at 2.5%, UK at 2.5-3%—global inflation pressures USD rivals less.
Impact: Bullish, as U.S. inflation sustains Fed hawkishness.
Economic Growth:
U.S.: Mixed signals—PMI at 50.4 (near stagnation), jobless claims up, but ADP jobs beat at 183,000 (Jan 2025). Tariffs add uncertainty.
Other Countries: China at 4.5% (slowing), Eurozone at 1.2%, Japan at 1%—U.S. outperforms peers.
Impact: Mildly bullish, U.S. resilience aids USD.
Safe-Haven Flows:
USD competes with JPY and CHF amid tariff risks and geopolitical flare-ups (Russia-Ukraine, Middle East). Recent yen strength (X posts) pressures DXY.
Impact: Mildly bearish, global risk-off challenges USD dominance.
Trade Balance:
U.S. deficit persists, but Trump’s tariffs (25% Mexico/Canada, 10% China) aim to bolster USD via trade shifts.
Impact: Bullish long-term, short-term neutral.
⚡Macroeconomic Factors
U.S.-focused with global context:
U.S. Policy: Fed’s tighter stance vs. global easing (ECB, BoJ) favors USD. Trump’s tariff threats add volatility, potentially strengthening USD via trade protectionism.
Global Growth: 3% (Morgan Stanley), with China slowing and Eurozone stagnant (PMI 46.2). U.S. relative strength supports DXY.
Commodity Prices: Oil at $70.44 pressures import-heavy peers (Japan), mildly weakening JPY vs. USD.
Currency Dynamics: Yen strength and EUR softness (EUR/USD below 1.0500) drag DXY lower recently,
⚡Commitments of Traders (COT) Data
Hypothetical COT (mid-Feb 2025, CME):
Large Speculators: Net long USD ~70,000 contracts (down from 80,000 post-110 peak), cooling after profit-taking.
Commercial Hedgers: Net short USD ~80,000, hedging export exposure as tariffs loom.
Open Interest: ~150,000 contracts, stable, reflecting U.S. trader engagement.
Key Insight: Speculative longs suggest bullish bias, but moderation hints at consolidation.
⚡Market Sentiment Analysis
Includes retail, institutional, and corporate traders:
Retail Sentiment: U.S. retail traders likely 60% short DXY at 106.000 (hypothetical broker data), betting on yen/CHF gains. Contrarian upside risk if shorts unwind.
Institutional Traders: U.S. funds (e.g., Citi, HSBC) mixed—bearish short-term (DXY to 96.87, Citi Hong Kong), bullish long-term (WalletInvestor to 119.193). Sentiment leans cautious.
Corporate Traders: U.S. exporters hedge at 106.50-107.00, neutral as tariffs loom; European firms favor EUR weakness.
Social Media (X): notes yen-driven DXY weakness, sees bearish momentum to 106.15—trending bearish.
Broker Data: U.S. IG sentiment ~55% long—balanced positioning.
⚡Quantitative Analysis
Moving Averages: 50-day SMA (106.30), 200-day SMA (105.50)—price below 50-day, above 200-day, neutral signal.
RSI: 45 (daily), bearish momentum fading, room for reversal.
Bollinger Bands: 105.80-106.80 range, 106.000 at midpoint—consolidation likely.
Fibonacci: 38.2% retracement from 110.00-102.50 at 105.62—key support holds.
Volatility Model: Implied volatility (1-month) at 7%, suggesting 0.75-point monthly range (±0.7%).
⚡Intermarket Analysis
USD/JPY: At 150.00, yen strength pressures DXY; drop to 145 could accelerate declines.
EUR/USD: Below 1.0500, EUR weakness supports DXY mildly.
Gold: XAU/USD at 2940 (risk-off proxy) inversely pressures USD.
Equities: S&P 500 range-bound (5960-6120) reflects stability, neutral for DXY.
Bonds: U.S. 10-year yield at 3.8% vs. JGB at 0.9%—yield gap aids USD.
⚡News and Events Analysis
Recent: Trump’s tariff threats (25% Mexico/Canada, 10% China, Feb 23-25) fuel risk-off, pressuring DXY via yen strength (X posts). Weak U.S. PMI and jobless claims offset by PCE at 2.6% (Jan 2025).
Upcoming: U.S. PCE data (Feb 28) critical—hotter data could lift DXY, softer data bearish. Fed rhetoric pending.
Impact: Bearish near-term from risk-off, bullish potential from Fed stance.
⚡Overall Summary Outlook
DXY at 106.000 balances U.S. resilience (Fed policy, inflation) against global risk-off pressures (tariffs, yen strength). Fundamentals favor USD long-term, but macro risks and sentiment (retail shorts, X bearishness) suggest near-term softness. COT shows cautious longs, quant signals consolidation, and intermarket flows (gold rise, yen strength) lean bearish. Short-term dip to 105.50-105.91 likely, medium-term range-bound with a bullish tilt if Fed holds firm.
⚡Future Prediction
Bullish Case: DXY to 108.00-110.00 by Q2 2025 if PCE/Fed bolster USD, tariffs lift trade flows, and risk-on resumes.
Bearish Case: Drop to 103.50-105.00 if yen/CHF surge, tariffs falter, or Fed dovishness emerges.
Prediction: Mildly bearish short-term to 105.50, then bullish to 108.00 by mid-2025, driven by Fed policy divergence.
⚠️Trading Alert : News Releases and Position Management 📰 🗞️ 🚫🚏
As a reminder, news releases can have a significant impact on market prices and volatility. To minimize potential losses and protect your running positions,
we recommend the following:
Avoid taking new trades during news releases
Use trailing stop-loss orders to protect your running positions and lock in profits
💖Supporting our robbery plan will enable us to effortlessly make and steal money 💰💵 Tell your friends, Colleagues and family to follow, like, and share. Boost the strength of our robbery team. Every day in this market make money with ease by using the Thief Trading Style.🏆💪🤝❤️🎉🚀
I'll see you soon with another heist plan, so stay tuned 🤑🐱👤🤗🤩

DXY Dollar Index at Key Support: Is a Major Retrace Coming? 💹📉
In this video, we dive deep into the DXY and analyze the current market conditions. 📊 At the moment, the pair is overextended and trading into a critical weekly support level. 🔄 Join me as we break down the trend, price action, and market structure, and explore a potential trade idea based on these insights. 🧠💡 Whether you're a seasoned trader or just starting out, this analysis will give you valuable perspectives on how to approach key levels in the market. ⚠️ This is not financial advice—always trade responsibly! ⚠️ Don't forget to comment, and boost my video if you find value in the content! 👍📈✨

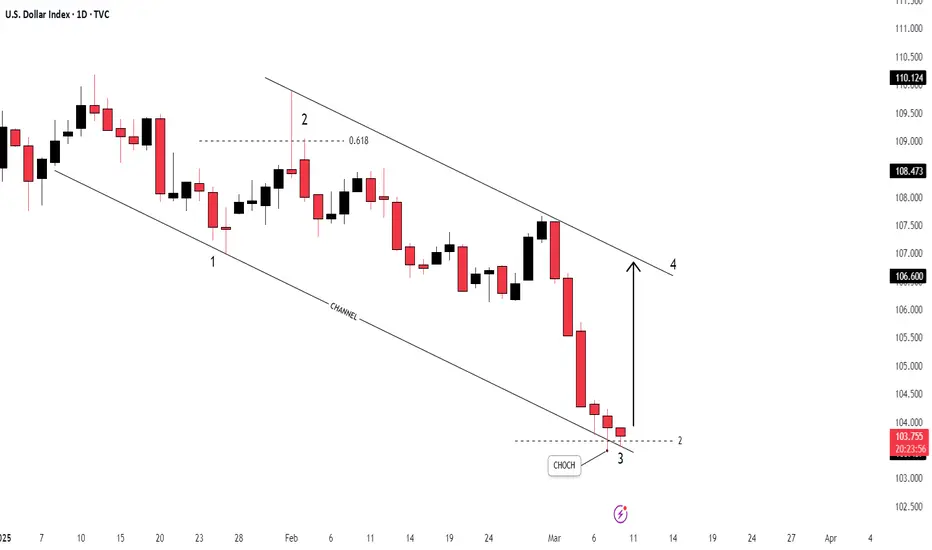
dxyDXY - U.S Dollar Index
Key Points in this Chart :
1. Change of Characteristics ( CHOCH )
2. Bearish Channel
3. Elliot Waves
4. RSI - Divergence
5. Support / Resistance
DXY|LONG UPDATEHello to everyone checking out this post!
Drop your thoughts in the comments! My outlook on the Dollar Index (DXY) is bullish. I believe it could start its upward move from the current level and continue its rally over the next few weeks. 📈🔥
Let me know what you think! 👇

DXY (Dollar Index) Ready to BUY? | Monthly FVG in Focus! 💰 Smart Money Preparing for a Bullish Move on DXY!
The US Dollar Index (DXY) is approaching a key Monthly Fair Value Gap (FVG), which could act as a strong demand zone. If price reaches this level, we will look for confirmation on lower timeframes (H4/M15) before entering buys.
🔍 Why is this Important?
✅ Monthly FVG as a High-Probability Buy Zone
✅ Institutional Order Flow Aligning for a Bullish Reversal
✅ Strong Demand Expected at FVG
✅ DXY Strength = Bearish Pressure on Gold & Majors
📊 Key Market Levels:
🔹 Monthly FVG Buy Zone:
🔹 First Target:
🔹 Breakout Confirmation Above:
🔹 Invalidation Below:
⚡ Trading Plan:
📌 Wait for price to reach the Monthly FVG
📌 Look for Bullish Confirmation on H4/M15 (BOS, CHoCH, Liquidity Grab)
📌 Enter Buys Once Institutional Reversal is Confirmed
📌 Manage Risk – Watch CPI & FOMC Events
💥 Stronger DXY = Weak Gold & Bearish Pressure on Majors!
💬 Are you buying DXY at the Monthly FVG? Drop your thoughts below! 👇
#DXY #DollarIndex #Forex #SmartMoney #ICT #SMC #Liquidity #TradingView #OrderFlow

Dollar idex is ready to drop next week are you ready ?This week, the market was slow with little movement. However, starting next week, keep an eye on the dollar. The order flow is showing a strong sell, and the daily chart reveals an FVG that indicates a sell from this level. Additionally, the current low aligns with the monthly FVG level. Trading next week should be exciting!

US Dollar Index Short Term Sell IdeaH4 - Strong bearish momentum
Lower lows
Until the two strong resistance zones hold my short term view remains bearish here.

DXY|LONG SETUPHello, I hope you have a great week ahead. This is my outlook for the Dollar Index, and please feel free to leave your comments and share your own perspective with me.
Initially, on the lower timeframes, I expect a rise to the 108.570 level and a potential breakout into this resistance zone. Afterward, I anticipate a drop to 105.888, which could mark the start of a sharp upward trend from this level. This is just my analysis, not a signal.

DXY Dollar Index Market Bearish Heist Plan (Day/Swing Trade)🌟Hi! Hola! Ola! Bonjour! Hallo!🌟
Dear Money Makers & Robbers, 🤑 💰🐱👤🐱🏍
Based on 🔥Thief Trading style technical and fundamental analysis🔥, here is our master plan to heist the DXY Dollar Index Market. Please adhere to the strategy I've outlined in the chart, which emphasizes short entry. Our aim is the high-risk Green Zone. Risky level, oversold market, consolidation, trend reversal, trap at the level where traders and bullish thieves are getting stronger. 🏆💸Book Profits Be wealthy and safe trade.💪🏆🎉
Entry 📈 : "The vault is wide open! Swipe the Bearish loot at any price - the heist is on!
however I advise to Place Sell limit orders within a 15 or 30 minute timeframe. Entry from the most recent or closest low or high level should be in retest.
Stop Loss 🛑: Thief SL placed at 108.500 (swing Trade Basis) Using the 4H period, the recent / swing high or low level.
SL is based on your risk of the trade, lot size and how many multiple orders you have to take.
Target 🎯: 105.500 (or) Escape Before the Target
🧲Scalpers, take note 👀 : only scalp on the Short side. If you have a lot of money, you can go straight away; if not, you can join swing traders and carry out the robbery plan. Use trailing SL to safeguard your money 💰.
📰🗞️Fundamental, Macro, COT, Sentimental Outlook:
DXY Dollar Index Market is currently experiencing a Bearish trend., driven by several key factors.
💠Fundamental Analysis
Weakening US Economy: The US economy's growth is slowing down, which could lead to a decline in the dollar's value.
Falling Interest Rates: The US Federal Reserve's decision to cut interest rates could weaken the dollar.
💠Macroeconomic Analysis
The US economy's growth, inflation rates, and employment numbers influence the dollar's strength.
Global economic trends, such as trade tensions and geopolitical events, also impact the dollar's value.
💠COT Data Analysis
Net Short Positions: Institutional traders and large banks have increased their net short positions in the DXY Dollar Index, indicating a bearish sentiment.
COT Ratio: The COT ratio has fallen to 1.2, indicating a bearish trend.
💠Market Sentimental Analysis
Bearish Sentiment: 55% of client accounts are short on this market, indicating a bearish sentiment.
Option Skew: The 25-delta put option skew has increased to 15, indicating a bearish sentiment.
💠Positioning Data Analysis
Institutional Traders: Institutional traders and large banks are positioning themselves for a bearish trend, with some predicting a decline to 105.50.
Corporate Traders: Corporate traders are also monitoring the index's performance, considering factors like interest rates and global economic trends.
💠Overall Outlook
Bearish Trend: The DXY Dollar Index is experiencing a bearish trend, with a potential decline to 105.50.
Key Support Levels: 106.57, 105.50.
💠Technical Analysis
Moving Averages: The 50-day MA is indicating a bearish trend.
Relative Strength Index (RSI): The RSI has fallen to 40, indicating oversold conditions.
Bollinger Bands: The lower band breakout indicates a bearish trend.
⚠️Trading Alert : News Releases and Position Management 📰 🗞️ 🚫🚏
As a reminder, news releases can have a significant impact on market prices and volatility. To minimize potential losses and protect your running positions,
we recommend the following:
Avoid taking new trades during news releases
Use trailing stop-loss orders to protect your running positions and lock in profits
📌Please note that this is a general analysis and not personalized investment advice. It's essential to consider your own risk tolerance and market analysis before making any investment decisions.
📌Keep in mind that these factors can change rapidly, and it's essential to stay up-to-date with market developments and adjust your analysis accordingly.
💖Supporting our robbery plan will enable us to effortlessly make and steal money 💰💵 Tell your friends, Colleagues and family to follow, like, and share. Boost the strength of our robbery team. Every day in this market make money with ease by using the Thief Trading Style.🏆💪🤝❤️🎉🚀
I'll see you soon with another heist plan, so stay tuned 🤑🐱👤🤗🤩

DXY Weekly BiasMy bias for this index is bearish and the price might target the Sellside Liquidity at 105.4. My Optimum Trade Entry would be around the 107.28 Zone.

Scenario on DXY 13.2.2025I would see the dollar index like this if I was considering going short I would first consider going above the monthly level of 108.048 if the market continued then I have one more SFP at a price around 108.6 if I was going to talk about a long position then first around the monthly level of 107.053 then the next one below the daily level of 106.724.
