DXY "DOLLAR INDEX" Bank Bullish Robbery Plan To Steal MoneyHola! My Dear Robbers / Money Makers & Losers, 🤑 💰
This is our master plan to Heist DXY "DOLLAR INDEX" Bank based on Thief Trading style Technical Analysis.. kindly please follow the plan I have mentioned in the chart focus on Long entry. Our target is Red Zone that is High risk Dangerous level, market is overbought / Consolidation / Trend Reversal / Trap at the level Bearish Robbers / Traders gain the strength. Be safe and be careful and Be rich.
Entry : Can be taken Anywhere, What I suggest you to Place Buy Limit Orders in 15mins Timeframe Recent / Nearest Swing Low
Stop Loss 🛑 : Recent Swing Low using 2h timeframe
Attention for Scalpers : If you've got a lot of money you can get out right away otherwise you can join with a swing trade robbers and continue the heist plan, Use Trailing SL to protect our money 💰.
Warning : Fundamental Analysis news 📰 🗞️ comes against our robbery plan. our plan will be ruined smash the Stop Loss. Don't Enter the market at the news update.
Loot and escape on the target 🎯 Swing Traders Plz Book the partial sum of money and wait for next breakout of dynamic level / Order block, Once it is cleared we can continue our heist plan to next new target.
Support our Robbery plan we can easily make money & take money 💰💵 Follow, Like & Share with your friends and Lovers. Make our Robbery Team Very Strong Join Ur hands with US. Loot Everything in this market everyday make money easily with Thief Trading Style.
Stay tuned with me and see you again with another Heist Plan..... 🫂
Dxytradingsetup

DXY IndexDXY Index
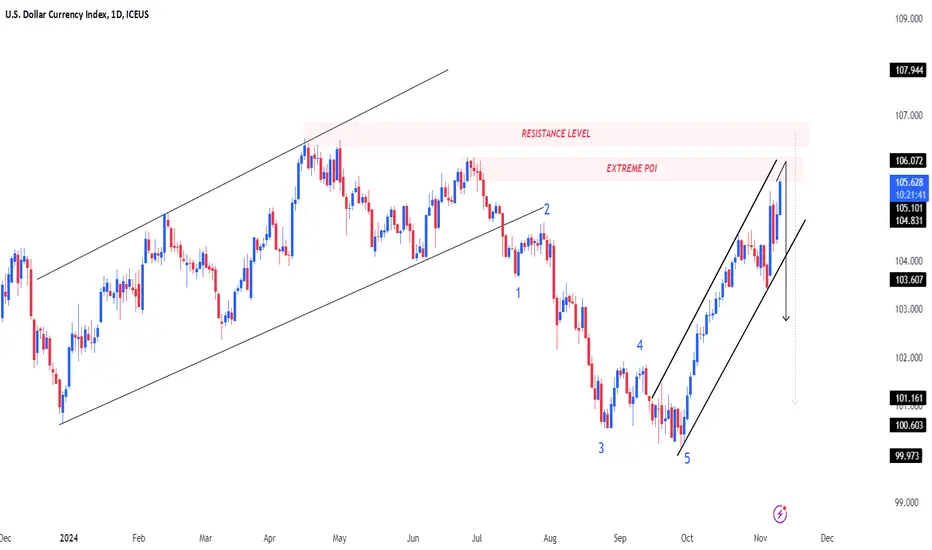
Completed " 12345 " Impulsive Waves and " ABC " Corrective Waves at Extreme Point of Interest ( POI ). Bullish Channel as an Corrective pattern in Short Time Frame and Rejection from Resistance Level with a Strong Divergence
DXY Trade Idea👀👉 The US Dollar Index (DXY) has retraced and showing signs of upward momentum. We are looking to buy on this 4H pullback. Disclaimer: This is not financial advice. Always do your own research and consult a licensed financial advisor before making any trading decisions.📊✅

DXY Index at Critical Resistance: Possible Clues for USD Pairs👀👉 The US Dollar Index (DXY) is nearing a key resistance zone, repeatedly tested on both the monthly and weekly timeframes, which often signals a potential market reaction or rejection. While the US dollar has maintained a strong bullish trend, these factors suggest a possible near-term reversal, offering potential opportunities in both correlated and inversely correlated currency pairs. Disclaimer: This is not financial advice. Always do your own research and consult a licensed financial advisor before making any trading decisions.
📊✅

DXY New Week Pair : DXY Index
Description :
Bearish Channel as an Corrective Pattern in Short Time Frame with the Breakout of Upper Trend Line
Fibonacci Level - 61.80%
Demand Zone
Completed " 1234 " Impulsive Waves
Break of Structure

DXY IndexPair : DXY Index
Description :
Elliot Waves 12345 Impulsive Waves and A Corrective Waves
Fibonacci Level 50.00 / 61.80
CHOCH
Breakout and Retracement of Bearish Channel
Demand Zone

DXY IndexPair : DXY Index
Description :
Completed " 12345 " Impulsive Waves and " A " Corrective Waves
Break of Structure
RSI - Divergence
Bearish Channel as an Corrective Pattern in Short Time Frame
Fibonacci Level - 38.20%

DXY (Dollar Index) Technical Analysis and Day Trade Idea👀 👉 The DXY (Dollar Index) recently shifted into a bullish structure on the 4H timeframe, with price now approaching a key resistance level. This could present a potential short day trade opportunity. In this video, we analyse the DXY in detail, reviewing the trend, market structure, and price action, while exploring a possible trade setup. Disclaimer: Forex trading carries significant risk, and market conditions can change rapidly. The information provided is for educational purposes only and does not constitute financial advice. 📉✅

DXY Pair : DXY Index
Description :
Completed " 12345 " Impulsive Waves
Break of Structure
Resistance Level
Bearish Channel as an Corrective Pattern in Short Time Frame
Fibonacci Level - 38.20 / 50.00

DXY Pair : DXY Index
Description :
Resistance Level
Completed " 12345 " Impulsive Waves
Break of Structure
RSI - Divergence
Double Bottom Pattern as an Corrective Pattern in Short Time Frame

Watch Out For DOLLAR Reversals I expect the dollar to complete its correction by month's end so prepare for reversals on pairs correlating with it. (GBPUSD, EURUSD & XAUUSD)

DXY IndexPair : DXY Index
Description :
Completed " 12345 " Impulsive Waves
Consolidation Phase
RSI - Divergence
Bearish Channel as an Corrective Pattern in Short Time Frame
Triple Bottom

DXY "Dollar Index" Bank Money Heist Plan on Bullish SideHola ola My Dear,
Robbers / Money Makers & Losers,
This is our master plan to Heist DXY "Dollar Index" Bank based on Thief Trading style Technical Analysis.. kindly please follow the plan I have mentioned in the chart focus on Long entry. Our target is Red Zone that is High risk Dangerous level, market is overbought / Consolidation / Trend Reversal at the level Bearish Robbers / Traders gain the strength. Be safe and be careful and Be rich.
Note: If you've got a lot of money you can get out right away otherwise you can join with a swing trade robbers and continue the heist plan, Use Trailing SL to protect our money.
Entry : Can be taken Anywhere, What I suggest you to Place Buy Limit Orders in 15mins Timeframe Recent / Nearest Swing Low
Stop Loss : Recent Swing Low using 1h timeframe
Warning : Fundamental Analysis comes against our robbery plan. our plan will be ruined smash the Stop Loss. Don't Enter the market at the news update.
Loot and escape on the target 🎯 Swing Traders Plz Book the partial sum of money and wait for next breakout of dynamic level / Order block, Once it is cleared we can continue our heist plan to next new target.
Support our Robbery plan we can easily make money & take money 💰💵 Follow, Like & Share with your friends and Lovers. Make our Robbery Team Very Strong Join Ur hands with US. Loot Everything in this market everyday make money easily with Thief Trading Style.

DXY INDEXPair : DXY INDEX
Description :
Completed " 12345 " Impulsive Waves
Break of Structure
CHoCH
RSI - Divergence
Consolidation Phase

DXY USD 1WDXY ~ NSE:DOLLAR ~ 1W
#DXY Movement is always in the opposite direction of #Bitcoin.
Looking at this Chart, #DXY Loss of Momentum and breakdown of this support line.
Send Bitcoin price $100,000+ in 2025 Q1

DXY "Dollar Index" Bank Money Heist Plan on Bullish SideHola ola My Dear,
Robbers / Money Makers & Losers,
This is our master plan to Heist DXY "Dollar Index" Bank based on Thief Trading style Technical Analysis.. kindly please follow the plan I have mentioned in the chart focus on Long entry. Our target is Red Zone that is High risk Dangerous level, market is overbought / Consolidation / Trend Reversal at the level Bearish Robbers / Traders gain the strength. Be safe and be careful and Be rich.
Note: If you've got a lot of money you can get out right away otherwise you can join with a swing trade robbers and continue the heist plan, Use Trailing SL to protect our money.
Entry : Can be taken Anywhere, What I suggest you to Place Buy Limit Orders in 15mins Timeframe Recent / Nearest Swing Low
Stop Loss : Recent Swing Low using 1h timeframe
Warning : Fundamental Analysis comes against our robbery plan. our plan will be ruined smash the Stop Loss. Don't Enter the market at the news update.
Loot and escape on the target 🎯 Swing Traders Plz Book the partial sum of money and wait for next breakout of dynamic level / Order block, Once it is cleared we can continue our heist plan to next new target.
Support our Robbery plan we can easily make money & take money 💰💵 Follow, Like & Share with your friends and Lovers. Make our Robbery Team Very Strong Join Ur hands with US. Loot Everything in this market everyday make money easily with Thief Trading Style.

$ RATE CUT IN THE AIR, WILL IT BOUNCE BEFORE THE DESCENT?The recent decline in the U.S. dollar can be attributed to several economic factors. Firstly, recent inflation data indicates that inflation in the United States is slowing down. The annual inflation rate for June 2024 was 3.0%, down from previous months. This slowdown has strengthened expectations of a less restrictive monetary policy from the Federal Reserve. Investors now anticipate a rate cut in September, possibly followed by another cut in November or December, which tends to weaken a country's currency.
Despite positive data from the Producer Price Index (PPI) for June 2024, the dollar continued to fall. The PPI showed a 0.1% year-over-year increase, with a 0.1% rise in goods and a 0.2% rise in services, both better than analysts' expectations.
The critical question now is whether the dollar will rebound before further declines. We are in a crucial zone, and a short-term rise might occur before any further drop, but much depends on Powell's speech scheduled for Monday. If the Federal Reserve Chair hints at a rate cut in September, the dollar could take another hit. Conversely, if Powell does not confirm this expectation, the dollar might benefit from the positive PPI data and rise temporarily.
Be careful!

DXY DOLLAR INDEX - LONG TERM TARGET Bearishness AheadHello this is my forcast on DXY. i see the Dollar taking Previous Year Low .
elections coming up trade safe feel free to share with me your opinions.

DXY INDEXPair : DXY Index
Description :
Completed " 1234 " Impulsive Waves
CHoCH
Bearish Channel as an Corrective Pattern in Short Time Frame
Fibonacci Level - 50.00%
Impulse Correction

DXY "Dollar Index" Bank Money Heist Plan on Bullish SideMy Dear Robbers / Money Makers & Newbies,
This is our master plan to Heist DXY "Dollar Index" Bank based on Thief Trading style Technical Analysis.. kindly please follow the plan I have mentioned in the chart focus on Long entry. Our target is Red Zone that is High risk Dangerous level, market is overbought / Consolidation / Trend Reversal at the level Bearish Robbers / Traders gain the strength. Be safe and be careful and Be rich.
Note: If you've got a lot of money you can get out right away otherwise you can join with a swing trade robbers and continue the heist plan, Use Trailing SL to protect our money.
Entry : Can be taken Anywhere, What I suggest you to Place Buy Limit Orders in 15mins Timeframe Recent / Nearest Swing Low
Stop Loss : Recent Swing Low using 30 mins timeframe
Warning : Fundamental Analysis comes against our robbery plan. our plan will be ruined smash the Stop Loss. Don't Enter the market at the news update.
Loot and escape on the target 🎯 Swing Traders Plz Book the partial sum of money and wait for next breakout of dynamic level / Order block, Once it is cleared we can continue our heist plan to next new target.
Support our Robbery plan we can easily make money & take money 💰💵 Follow, Like & Share with your friends and Lovers. Make our Robbery Team Very Strong Join Ur hands with US. Loot Everything in this market everyday make money easily with Thief Trading Style.

DXY IndexPair : DXY Index
Description :
Completed " 12345 " Impulsive Waves and " AB " Corrective Waves
Break of Structure
RSI - Divergence
Bullish Channel as an Corrective Pattern in Short Time Frame
Resistance Level

DXY - somewhere in high time frame demand zone 101.700 - 100.600 is the demand zone on weekly time TF
price has pierce down in the demand zone to its mid's
the last 4 days of downfall was sharp that it has left only one resistance that could be noted on 103.250
what are the sign to start building long >>>
* just on the top of demand zone we have a daily bearish fvg marked (in red) if we have any coming day break that zone with one strong bullish candle will grab the confidence of the bulls
* meanwhile with 100.900 low could be sweeped or tested
* if that one candle breach that bearish fvg we likely see new daily Order block which will like fuel station to built one by one instead of putting full quality at once
---------------------------------------------------------------------------------------------------------------------
yellow line = prediction line
red zone = bearish fvg
green zone = high time frame demand
orange zone = time time frame supply
more updates will be done on the comment as per the action goes further

DXY IndexPair : DXY Index
Description :
Falling Wedge in Short Time Frame
Completed " 12345 " Impulsive Waves and " ABC " Corrective Waves
Demand Zone
RSI - Divergence
Symmetrical Triangle as an Corrective Pattern in Long Time Frame
