#DYDX/USDT#DYDX
The price is moving within a descending channel on the 1-hour frame, adhering well to it, and is on its way to breaking strongly upwards and retesting it.
We have support from the lower boundary of the descending channel, at 0.640.
We have a downtrend on the RSI indicator that is about to be broken and retested, supporting the upside.
There is a major support area in green at 0.638, which represents a strong basis for the upside.
Don't forget a simple thing: ease and capital.
When you reach the first target, save some money and then change your stop-loss order to an entry order.
For inquiries, please leave a comment.
We have a trend to hold above the 100 Moving Average.
Entry price: 0.650
First target: 0.669
Second target: 0.690
Third target: 0.717
Don't forget a simple thing: ease and capital.
When you reach your first target, save some money and then change your stop-loss order to an entry order.
For inquiries, please leave a comment.
Thank you.
Dydxlong

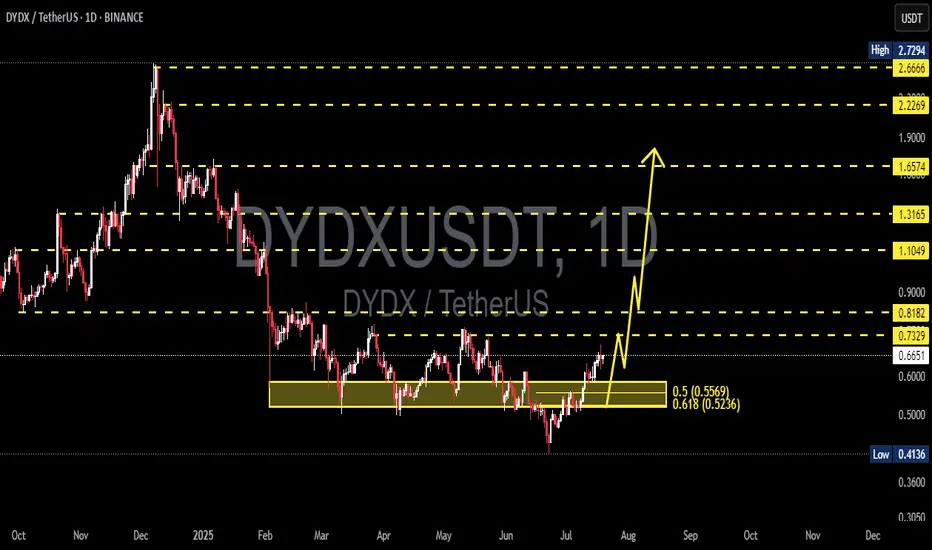
DYDX/USDT Poised for a Massive Breakout – Is a Rally Toward $2+?✨ Comprehensive and Engaging Technical Analysis:
DYDX/USDT is entering a highly compelling technical phase, showing signs of a potential trend reversal after breaking out from a prolonged accumulation zone that lasted nearly 5 months. This breakout on the daily timeframe (1D) is a classic early signal for a major upward move — often favored by swing traders and mid-term investors.
🔍 Accumulation Zone & Fibonacci Golden Pocket
The range between $0.52 and $0.56 represents the Fibonacci retracement levels of 0.5 and 0.618 — commonly referred to as the "golden pocket".
This area historically acts as a strong accumulation zone, where institutional players often enter the market.
Multiple rejections and support confirmations within this zone reinforce its significance.
📈 Structure Breakout:
DYDX has officially broken above the horizontal structure near $0.6566 and further confirmed momentum beyond $0.7329.
The price action is forming a Double Bottom Pattern and potentially an Inverted Head & Shoulders, both of which are high-conviction bullish reversal patterns.
✅ Bullish Scenario (Primary Bias):
As long as DYDX holds above the $0.66–$0.73 breakout range, it remains on track for a significant bullish impulse. Key upside targets include:
Target (Resistance) Significance
$0.8182 Minor horizontal resistance
$1.1049 Key level from prior supply zone
$1.3165 Previous major reaction area
$1.6574 Multi-timeframe major resistance
$2.2269 – $2.6666 Fibonacci extension & historical distribution zone
$2.7294 Previous all-time high
💡 This structure offers a potential upside of over +200% if fully played out.
❗ Bearish Scenario (Alternative):
A failed retest and drop below $0.6566 would suggest a false breakout.
A breakdown below $0.52 would invalidate the bullish setup and could send DYDX back to $0.41, its previous macro support.
In this case, the market may re-enter a range-bound or sideways phase.
⚙️ Conclusion & Trading Strategy:
DYDX/USDT is at a technically critical moment. The recent breakout could mark the beginning of a major reversal trend after months of consolidation. A healthy pullback to the $0.66–$0.73 zone could offer an ideal entry opportunity with tight stop-losses.
For swing traders and trend followers, this may be one of the best risk/reward setups on DYDX in recent months.
#DYDXUSDT #DYDXBreakout #CryptoBullish #AltcoinSeason #CryptoAnalysis #FibonacciLevels #SmartMoney #DYDXRally #TechnicalBreakout
#DyDx Superb opportunity#DYDX
The price is moving within a descending channel on the 1-hour frame, adhering well to it, and is on its way to breaking it strongly upwards and retesting it.
We have a bounce from the lower boundary of the descending channel. This support is at 0.470.
We have a downtrend on the RSI indicator that is about to be broken and retested, supporting the upside.
There is a major support area in green at 0.445, which represents a strong basis for the upside.
Don't forget a simple thing: ease and capital.
When you reach the first target, save some money and then change your stop-loss order to an entry order.
For inquiries, please leave a comment.
We have a trend to hold above the 100 Moving Average.
Entry price: 0.500.
First target: 0.522.
Second target: 0.537.
Third target: 0.559.
Don't forget a simple thing: ease and capital.
When you reach your first target, save some money and then change your stop-loss order to an entry order.
For inquiries, please leave a comment.
Thank you.

#DYDX/USDT#DYDX
The price is moving within a descending channel on the 1-hour frame, adhering well to it, and is heading towards a strong breakout and retest.
We are experiencing a rebound from the lower boundary of the descending channel. This support is at 0.566
We are experiencing a downtrend on the RSI indicator, which is about to break and retest, supporting the upward trend.
We are heading towards stability above the 100 moving average.
Entry price: 0.575
First target: 0.584
Second target: 0.592
Third target: 0.602

DYDXUSDT 1D AnalysisDYDX ~ 1D Analysis
#DYDX Buy gradually from here with a short term target of at least 15%+.

Free signal todayHello friends
Given the good growth, now the price is correcting and we can buy within the support ranges with capital and risk management and move with it to the specified targets.
*Trade safely with us*

#DYDX#DYDX
The price is moving within a descending channel on the 1-hour frame, adhering well to it, and is heading for a strong breakout and retest.
We are seeing a bounce from the lower boundary of the descending channel, which is support at 0.
We have a downtrend on the RSI indicator that is about to break and retest, supporting the upside.
We are looking for stability above the 100 moving average.
Entry price: 0.706
First target: 0.741
Second target: 0.766
Third target: 0.800

#DYDX/USDT#DYDX
The price is moving within a descending channel on the 1-hour frame, adhering well to it, and is on its way to breaking it strongly upwards and retesting it.
We are seeing a bounce from the lower boundary of the descending channel, which is support at 0.5000.
We have a downtrend on the RSI indicator that is about to break and retest, supporting the upward trend.
We are looking for stability above the 100 moving average.
Entry price: 0.543
First target: 0.563
Second target: 0.590
Third target: 0.623

DYDXUSDT - a real oppurtunity!the coin is currently in a deep bottom compared to its December peak, having dropped over 80%.
Buying now is a rare opportunity that may not come again in the future.
On the 3-day chart there is a nicly breakout of a 4 months downtrend ...
the most important resistance is at the key level—once it breaks, the price will pump insanely.
best regards Ceciliones🎯

DYDXUSDT – Key Resistance Zones Marked!I’ve identified blue boxes as critical resistance areas—these are the levels where price could face heavy selling pressure. But remember, we don’t short blindly—we wait for confirmations.
📊 How I’m Trading This:
✅ Step 1: Watch for CDV confirmation is volume decreasing while price climbs?
✅ Step 2: Look for LTF breakouts downward a clean market structure shift signals entry.
✅ Step 3: If resistance holds + volume supports = I take the trade. If not, I step aside.
💡 Why This Matters:
Most traders short too early and get wrecked. I wait for clear signs of rejection before entering. That’s the difference between guessing and executing.
🔥 Final Thought:
If price suddenly breaks upwards and holds, I will not insist on a short. But if we see rejection + a retest? Then it’s go time. 🚀
📈 Follow for precision trades—because smart traders wait for the perfect moment. 🔥
A tiny part of my runners:
🎯 ZENUSDT.P: Patience & Profitability | %230 Reaction from the Sniper Entry
🐶 DOGEUSDT.P: Next Move
🎨 RENDERUSDT.P: Opportunity of the Month
💎 ETHUSDT.P: Where to Retrace
🟢 BNBUSDT.P: Potential Surge
📊 BTC Dominance: Reaction Zone
🌊 WAVESUSDT.P: Demand Zone Potential
🟣 UNIUSDT.P: Long-Term Trade
🔵 XRPUSDT.P: Entry Zones
🔗 LINKUSDT.P: Follow The River
📈 BTCUSDT.P: Two Key Demand Zones
🟩 POLUSDT: Bullish Momentum
🌟 PENDLEUSDT.P: Where Opportunity Meets Precision
🔥 BTCUSDT.P: Liquidation of Highly Leveraged Longs
🌊 SOLUSDT.P: SOL's Dip - Your Opportunity
🐸 1000PEPEUSDT.P: Prime Bounce Zone Unlocked
🚀 ETHUSDT.P: Set to Explode - Don't Miss This Game Changer
🤖 IQUSDT: Smart Plan
⚡️ PONDUSDT: A Trade Not Taken Is Better Than a Losing One
💼 STMXUSDT: 2 Buying Areas
🐢 TURBOUSDT: Buy Zones and Buyer Presence
🌍 ICPUSDT.P: Massive Upside Potential | Check the Trade Update For Seeing Results
🟠 IDEXUSDT: Spot Buy Area | %26 Profit if You Trade with MSB
📌 USUALUSDT: Buyers Are Active + %70 Profit in Total
🌟 FORTHUSDT: Sniper Entry +%26 Reaction
🐳 QKCUSDT: Sniper Entry +%57 Reaction
📊 BTC.D: Retest of Key Area Highly Likely
📊 XNOUSDT %80 Reaction with a Simple Blue Box!
📊 ORCAUSDT %29 Reaction with a Simple Blue Box!
I stopped adding to the list because it's kinda tiring to add 5-10 charts in every move but you can check my profile and see that it goes on..

#DYDX/USDT#DYDX
The price is moving in a descending channel on the 1-hour frame and is adhering to it well and is heading to break it strongly upwards and retest it
We have a bounce from the lower limit of the descending channel, this support is at a price of 0.760
We have a downtrend on the RSI indicator that is about to be broken and retested, which supports the rise
We have a trend to stabilize above the moving average 100
Entry price 0.770
First target 0.800
Second target 0.820
Third target .842

#DYDX/USDT#DYDX
The price is moving in a descending channel on the 1-hour frame and is expected to continue upwards
We have a trend to stabilize above the moving average 100 again
We have a descending trend on the RSI indicator that supports the rise by breaking it upwards
We have a support area at the lower limit of the channel at a price of 0.633
Entry price 0.647
First target 0.662
Second target 0.675
Third target 0.691

#DYDX/USDT#DYDX
The price is moving within a descending channel on the 1-hour frame, adhering well to it, and is on its way to breaking it strongly upwards and retesting it.
We are seeing a rebound from the lower boundary of the descending channel, which is support at 0.5050.
We have a downtrend on the RSI indicator that is about to break and retest, supporting the upward trend.
We are looking for stability above the 100 moving average.
Entry price: 0.7529
First target: 0.6467
Second target: 0.6932
Third target: 0.7529

DydxusdtSince Bit had to make a pullback and they did this under the pretext of news so that they could create good liquidity, dydx also made a pullback and is ready to rise very high, which may hit my target of 0.965 next week.

#DYDX/USDT #DYDX
The price is moving in a descending channel on the 1-hour frame and is adhering to it well and is heading to break it upwards strongly
We have a bounce from the lower limit of the descending channel, this support is at a price of 1.00
We have a downtrend on the RSI indicator that is about to be broken, which supports the rise
We have a trend to stabilize above the moving average 100
Entry price 1.04
First target 1.08
Second target 1.35
Third target 1.20

DYDX - Fear before unlockBINANCE:DYDXUSDT
DYDX and upcoming 15% total supply unlock.
Psychology of retail investors always the same! Now everyone see the unlock date and ready to sell their coins because majority think in a same day all funds drop the price. But usually it works in opposite way.
To sell big amount of coins funds and earlier investors need liquidity, so they will sell it step by step.
Now ill not be impress if we will see some big media posts about DYDX and future of this DEX. So after
over 250 days in a range everyone who want it accumulate a lot.
Possible Targets and explanation idea
➡️By ADZ big players accumulate a lot on Weekly timeframe and we can see huge divergency.
➡️ Long time period accumulation in a range.
➡️We got FVG on monthly timeframe in red block zone (full fill will be exactly at 0.23 level by FIb)
➡️We trade in a range exactly at -0.27 zone
➡️3rd Feb day of 15% unlock. But we hypothetically can see moves where funds start sell at 4, 6, 10$ in 3 waves
Hope you enjoyed the content I created, You can support with your likes and comments this idea so more people can watch!
✅Disclaimer: Please be aware of the risks involved in trading. This idea was made for educational purposes only not for financial Investment Purposes.

DYDX correction to 5.20$BINANCE:DYDXUSDT
Dydx now underrated. Where ill start buy Dydx again? Where ill take a profit on local correction? And why Dydx can pump to 5.20$?
✅Before we start to discuss, I would be glad if you share your opinion on this post's comment section and hit the like button if you enjoyed it.
Thank you.
Possible Targets and explanation idea
➡️Fib since drop in April.
➡️Perfect call to sell by "Trade On" indicator
➡️Accumulation phase between -0.18 and -0.618 levels
➡️Forming lower low in June and took liquidity. Correction to drop can be at least to 0.5 level by fib 5.20$
➡️2 signals Strong Buy in May and June
➡️Rejected at "Take profit" line. If we capitulate one more time we can drop to 1.05 (now its a "Buy line")
Hope you enjoyed the content I created, You can support with your likes and comments this idea so more people can watch!
✅Disclaimer: Please be aware of the risks involved in trading. This idea was made for educational purposes only not for financial Investment Purposes.
* Look at my ideas about interesting altcoins in the related section down below ↓
* For more ideas please hit "Like" and "Follow"!

#DYDX/USDT Ready to go higher#DYDX
The price is moving in a descending channel on the 1-hour frame and sticking to it well
We have a bounce from the lower limit of the descending channel, this support is at 1.20
We have a downtrend on the RSI indicator that is about to be broken, which supports the rise
We have a trend to stabilize above the 100 moving average
Entry price 1.32
First target 1.38
Second target 1.45
Third target 1.55

DYDXUSDT 1WDYDX ~ 1W
#DYDX If you still have Conviction on this coin,. This support block would be a very good buying place for now,. Buy from here with a minimum target of 20%++

#DYDX/USDT Ready to go higher#DYDX
The price is moving in a descending channel on the 30-minute frame and is sticking to it well
We have a bounce from the lower limit of the descending channel, this support is at 1.30
We have a downtrend on the RSI indicator that is about to be broken, which supports the rise
We have a trend to stabilize above the 100 moving average
Entry price 1.34
First target 1.36
Second target 1.40
Third target 1.44

DYDX usdt"🌟 Welcome to Golden Candle! 🌟
We're a team of 📈 passionate traders 📉 who love sharing our 🔍 technical analysis insights 🔎 with the TradingView community. 🌎
Our goal is to provide 💡 valuable perspectives 💡 on market trends and patterns, but 🚫 please note that our analyses are not intended as buy or sell recommendations. 🚫
Instead, they reflect our own 💭 personal attitudes and thoughts. 💭
Follow along and 📚 learn 📚 from our analyses! 📊💡"

DYDXUSDT: Precision Trading – Blue Box Demand Zone Identified! DYDXUSDT is offering an exceptional opportunity for traders with the blue box carefully identified as a high-potential demand zone . This level represents the most rational entry point for those seeking a balance of precision and risk management.
Why Focus on the Blue Box?
Meticulous Analysis: The blue box has been selected using volume footprint, volume profile, cumulative delta volume (CDV), and liquidity heatmaps , ensuring it highlights a key area of demand.
Strategic Confirmation: Before trading, I’ll validate the setup using CDV, liquidity heatmaps, volume profiles, volume footprints (to confirm buyers are present), and upward market structure breaks in lower time frames . This ensures only high-probability trades are taken.
Calculated Risk Management: In a market with heightened uncertainty, the blue box stands out as the most logical and calculated entry zone.
The Path Forward:
By focusing on this demand zone, we position ourselves for a well-timed entry, reducing risk while maximizing potential returns.
Engage & Elevate:
If this analysis resonates with you, please boost and share your thoughts in the comments! Your engagement inspires me to continue providing actionable insights.
Learn to Trade Like This – For Free!
Interested in learning how to identify such precise demand zones? DM me to discover how I use CDV, liquidity heatmaps, volume profiles, and volume footprints for these setups. I’m happy to share my methods completely free – let’s succeed together!
If you think this analysis helps you, please don't forget to boost and comment on this. These motivate me to share more insights with you!
I keep my charts clean and simple because I believe clarity leads to better decisions.
My approach is built on years of experience and a solid track record. I don’t claim to know it all, but I’m confident in my ability to spot high-probability setups.
If you would like to learn how to use the heatmap, cumulative volume delta and volume footprint techniques that I use below to determine very accurate demand regions, you can send me a private message. I help anyone who wants it completely free of charge.
My Previous Analysis (the list is long but I think it's kinda good : )
🎯 ZENUSDT.P: Patience & Profitability | %230 Reaction from the Sniper Entry
🐶 DOGEUSDT.P: Next Move
🎨 RENDERUSDT.P: Opportunity of the Month
💎 ETHUSDT.P: Where to Retrace
🟢 BNBUSDT.P: Potential Surge
📊 BTC Dominance: Reaction Zone
🌊 WAVESUSDT.P: Demand Zone Potential
🟣 UNIUSDT.P: Long-Term Trade
🔵 XRPUSDT.P: Entry Zones
🔗 LINKUSDT.P: Follow The River
📈 BTCUSDT.P: Two Key Demand Zones
🟩 POLUSDT: Bullish Momentum
🌟 PENDLEUSDT.P: Where Opportunity Meets Precision
🔥 BTCUSDT.P: Liquidation of Highly Leveraged Longs
🌊 SOLUSDT.P: SOL's Dip - Your Opportunity
🐸 1000PEPEUSDT.P: Prime Bounce Zone Unlocked
🚀 ETHUSDT.P: Set to Explode - Don't Miss This Game Changer
🤖 IQUSDT: Smart Plan
⚡️ PONDUSDT: A Trade Not Taken Is Better Than a Losing One
💼 STMXUSDT: 2 Buying Areas
🐢 TURBOUSDT: Buy Zones and Buyer Presence
🌍 ICPUSDT.P: Massive Upside Potential | Check the Trade Update For Seeing Results
🟠 IDEXUSDT: Spot Buy Area | %26 Profit if You Trade with MSB
📌 USUALUSDT: Buyers Are Active + %70 Profit in Total
🌟 FORTHUSDT: Sniper Entry +%26 Reaction
🐳 QKCUSDT: Sniper Entry +%57 Reaction
📊 BTC.D: Retest of Key Area Highly Likely
I stopped adding to the list because it's kinda tiring to add 5-10 charts in every move but you can check my profile and see that it goes on..

#DYDX/USDT Ready to launch upwards#DYDX
The price is moving in a descending channel on the 1-hour frame and sticking to it well
We have a bounce from the lower limit of the descending channel, this support is at a price of 1.37
We have a downtrend on the RSI indicator that is about to be broken, which supports the rise
We have a trend to stabilize above the moving average 100
Entry price 1.46
First target 1.57
Second target 1.72
Third target 1.89
