DYDX - DYDXUSDT #DYDX $DYDX #BTC $BTC
- BAT Pattern 🦇
- Daily Frame
# 🎧
#This is my technical opinion and not a recommendation to buy or sell
DYDXUSD


dYdX (DYDX) formed bullish Shark | A good long opportunityHi dear friends, hope you are well and welcome to the new trade setup of dYdX (DYDX) token with Bitcoin pair.
On a 4-hr time frame, DYDX has formed a bullish Shark pattern. Right now the priceline is slightly moved up, therefore, we can wait for some price correction to catch it from the buying zone.

Trading opportunity for DYDXUSDTBased on technical factors there is a Long position in :
📊 DYDXUSDT
🔵 Long Now 2.370
🧯 Stop loss 2.080
🏹 Target 1 2.720
🏹 Target 2 3.100
🏹 Target 3 3.750
💸Capital : 1%
We hope it is profitable for you ❤️
Please support our activity with your likes👍 and comments📝

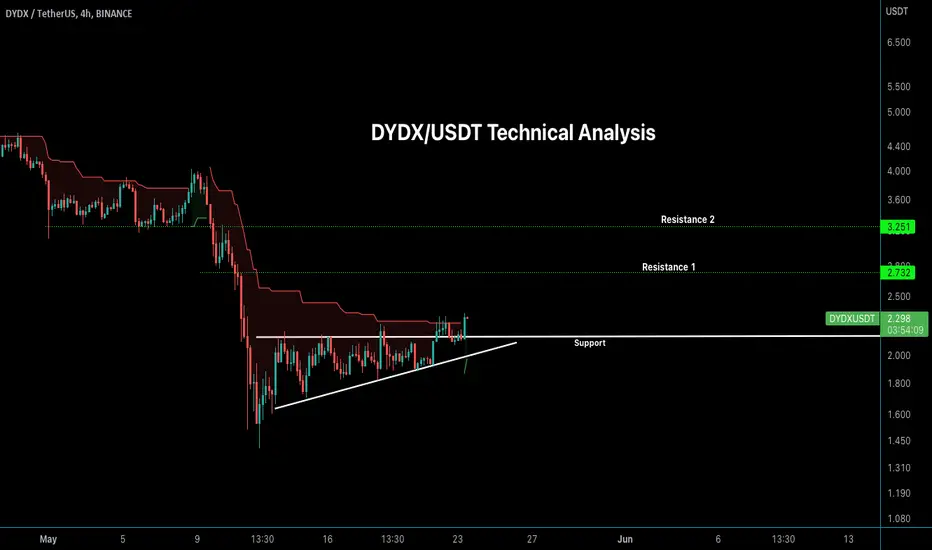
DYDXUSDT Looks Bearish!DYDXUSDT Technical analysis update
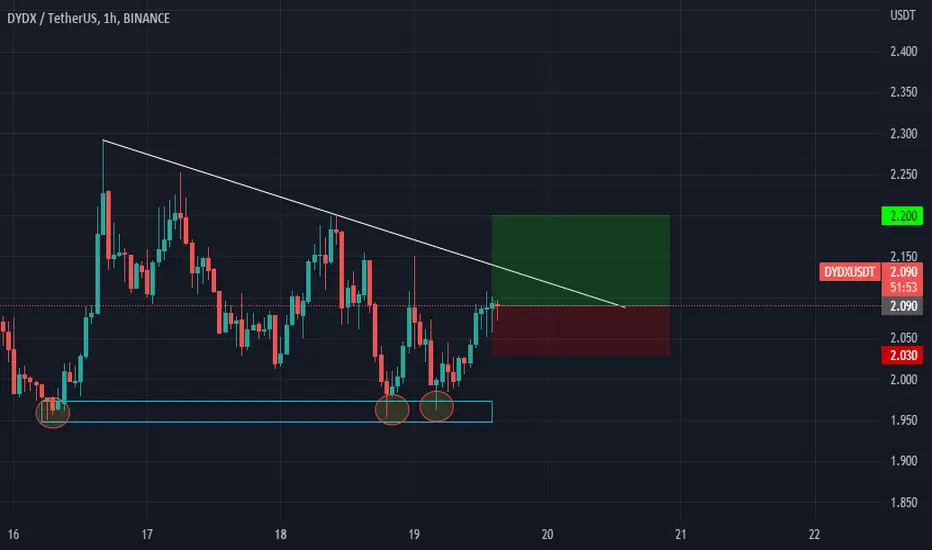
DYDX is breaking its trend support line
Short level : $2.240 - $2.30
Stop loss : $2.50
TP 1 : $2.05
TP 2 : $1.85
TP 3 : $1.68
Always keep stop loss
Thanks
Hexa

DYDX/USDT - Market Update 07.08.22Hello Traders!
DYDX completed the fall phase, after which the consolidation range of $1.00 - $3.17 was formed.
Based on the analysis of the smaller timeframes and the current state of the market, we can assume the continuation of the local growth to the upper border of the consolidation range - the level of $3.17. Further, we can expect the beginning of descending price formation with the purpose of liquidity gathering to the lower border of the range - the level of $1.00.
Specifically interesting will be the purchases in the range of $1.00 - $1.44. The targets will be the levels of $2.44 and $3.17
Good luck and watch out for the market
P.S. This is an educational analysis that shall not be considered financial advice

DYDX/USDT : Correction is must before the next leg upBINANCE:DYDXUSDT
Hello everyone 😃
Before we start to discuss, I'll be so glad if you share your opinion on this post's comment section and hit the like button if you enjoyed it!
Our Last call on $DYDX has been got stop-hunted and today we'll enter positions based on invalidation and hold triggers only.
Currently, $DYDX has formed an ascending channel, And based on the data we have, There's a bearish divergence formed from 29th July to 1st August.
Also, it could be a good entry zone to locate Longs towards the higher bearish base, As $DYDX has formed a bullish order-block below at $2.00
So, In terms of using both scenarios;
- There's a Short opportunity to $2.20 with an invalidation as hold above $2.84.
With a local Long position with an entry zone from $2.30 to $2.10 with an invalidation as hold below $2.00.
- There's also an aggressive Long setup after getting the invalidation above $2.84 with the Same stop-loss below $2.00.
You can have your bullish run from the current market price or lower, But you have to manage the Risk/Reward Ratio too!
Hope you enjoyed the content I created, You can support us with your likes and comments!
Attention: this isn't financial advice we are just trying to help people with their vision.
Have a good day!
@Helical_Trades

Quickpost: Inverted head and shoulders on DYDXUSDTThe formation is pretty obvious, and the target setting is pretty easy as well. This is alt-season and the end of a bear market. You can almost throw a dart at the board and make some gains. This trade is a layup.
Linked ideas show general bullishness and reversals in the market.

DYDX/USDT 1HOUR UPDATE LONG TRADE SETUP!!hello, members welcome to DYDX/USDT 1Hr chart update by CRYPTOSANDERS.
I have tried my best to bring the best possible outcome in this chart.
As we can see from the above-mentioned chart the DYDX/USDT brackout the chanel and retested the green zone now, at the current scenario we are expecting that DYDX will go up all the way to $1.98 means almost 15%.
So if it moves to the green zone again then it will be the zone to go long on DYDX/USDT
Remember:-This is not a piece of financial advice. All investment made by me is at my own risk and I am held responsible for my own profit and losses. So, do your own research before investing in this trade.
Sorry for my English it is not my native language.
Do hit the like button if you like it and share your charts in the comments section.
Thank you.

DYDXUSDT Looks Bearish!DYDXUSDT Technical analysis update
DYDX Currently trading at 2.04
DYDX price breaks its support trend line, we can expect a slow drop.
Short level : $2.00 - $2.05
Stop loss : $2.30
Target 1 : $1.84
Target 2 : $1.60
Target 3 : $1.30
Always keep stop loss
Thanks
Hexa

DYDX/USDT 70% growth potentialDYDX continues to move within the ascending channel. Price bounced off the support trendline while holding the previous LL.
It seems we are about to initiate the next upside swing, which can result in a 70% growth. Let's see how it will turn out.

dYdX (DYDX) formed bullish BAT for another upto 13% pumpHi dear friends, hope you are well and welcome to the new trade setup of dYdX (DYDX) token with the US Dollar pair.
In the previous trade DYDX slightly move below than potential reversal zone, however, it then pumped well:
Now on a 4-hr time frame, DYDX has formed bullish BAT pattern.
Note: Above idea is for educational purpose only. It is advised to diversify and strictly follow the stop loss, and don't get stuck with trade

DYDX/USDT : Located above the Demand zoneBINANCE:DYDXUSDT
Hello everyone 😃
Before we start to discuss, I'll be so glad if you share your opinion on this post's comment section and hit the like button if you enjoyed it!
$DYDX is currently moving above the 2H's Demand zone and the lower lows (Based on the current wave) are located nearly below the Demand zone.
Looking good if we sweep out the Demand below!
Trade is based on invalidation, So I made the Stop-loss quite near to the lower low...
You can enter on partial entries at $2.20 - $2.15 - $2.10
- Set stop-loss as an active close below on the 4H time-frame.
Hope you enjoyed the content I created, You can support us with your likes and comments!
Attention: this isn't financial advice we are just trying to help people with their vision.
Have a good day!
@Helical_Trades

DYDXDYDX/USDT we are looking on this coin make Triple Bottom and we have a Resistance Zone now we are PUSHING LONG this coin ENJOY
Disclamer:
We are not financial advisors. The content that we share on this website are for educational purposes and are our own personal opinions
dYdX (DYDX) formed bullish Gartley for upto 13% moveHi dear friends, hope you are well and welcome to the new trade setup of dYdX (DYDX) token with Bitcoin pair.
On a 4-hr time frame, DYDX has formed a bullish Gartley pattern:
Note: Above idea is for educational purpose only. It is advised to diversify and strictly follow the stop loss, and don't get stuck with trade

DYDX Long 20220711DYDX is in Demand Zone
Risk Reward: 4
DYDX, DYDXUSD, DYDXUSDT, CRYPTO,CRYPTOCURRENCY
DISCLAIMER
This is only a personal opinion and does NOT serve as investing NOR trading advice.
Please make your own decisions and be responsible for your own investing and trading Activities.

DYDX 6H BUYDYDX 6H support is at ~$1.39
Enter 50% at the current price
and try to set some buy orders near the support zone
If DYDX holds above the trendline,
the Take-Profit target would be 5%, 10%, and 15% from your entry
Cheers

DYDXDYDX/USDT after Reach Resistance Zone now moving nicely to pushing down im selling if break and Support zone target is 1.700

DYDXUSDT: SHORTIt is in a descending channel, it can grow up to 1.6, then it is suitable for a short position.

DYDXUSDTHello everyone
According to the chart and our previous serial analysis we publish that the price need to have more correction from 15$ price and now the price is how much ??
Be patient to hunt the hunter :D
As you can see on chart we expect that the price can drop to stop hunt the orderbok then its ready to move upwards to complete the correction and we think that the price is moving in bearish market in a year but just a prediction.
And in this chart we put a point, if anyone can guess at first we wanna give 500$ prize for find it and tell at first.
If you have any question send us messages
Good Luck
Abtin
Previous analysis :

DYDX/USDT Scalp Trade setup#DYDXUSDT Scalp Chart:-
#dydx Breaking Resistance and It will be Good Entry.
We can see $2.70 and $3.25 in Short term.
Stop Loss = $2.15
DYDX Will Revisit the Bottom one more timeDYDX Formed a Bearish triangle and here we can clearly see that the price has formed a bearish breakout on the trend line formed. While we have a chances of seeing another dip and retest the recent lows formed on the H4 timeframe.
