DYDX Update | dydxusdtDYDX Idea | DYDXUSDT
✅ ✅ Risk warning, disclaimer: the above is a personal market judgment and analysis based on published information and historical chart data on The trading view,
And only some of these analyzes are my actual real trades.
I hope Traders consider I am Not responsible for your trades and investment decision.
DYDXUSDT

DYDX Idea | DYDXUSDTDYDX Idea | DYDXUSDT
✅ ✅ Risk warning, disclaimer: the above is a personal market judgment and analysis based on published information and historical chart data on The trading view,
And only some of these analyzes are my actual real trades.
I hope Traders consider I am Not responsible for your trades and investment decision.

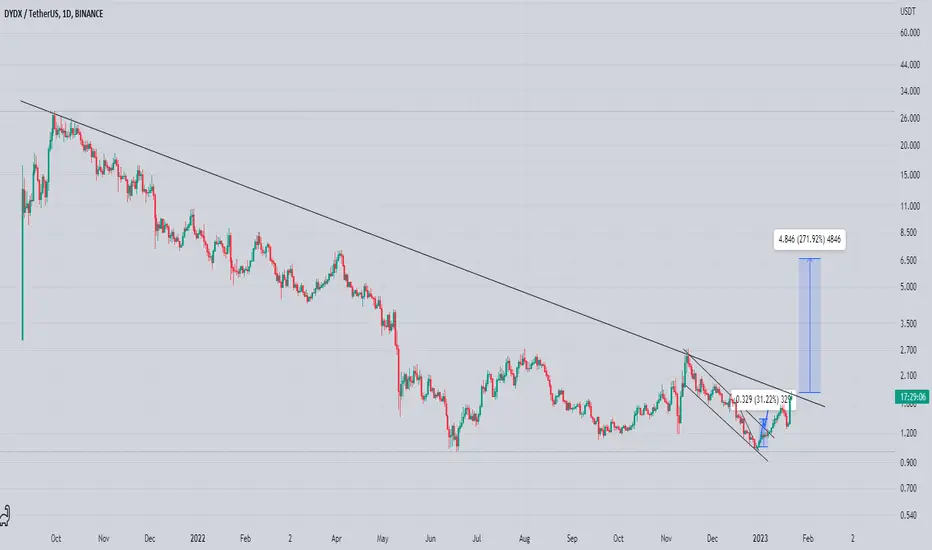
long DYDX$DYDX broke through the major resistance level. Bullish movement to 4.29$ is likely to happen.


$DYDX - sitting on the IMPORTANT levelHello my Fellow TraderZ,
$DYDX was an absolute Beast in this leg up. Broke out of the Months long Ranging Zone. Currently can say it is retesting the Breakout.
I always beleive MAs or EMAs act as the MAGNET. So, if the level gets break it would attract the price towards an important Confluence Zone ( Daily EMA 50 & 200 + TrendLine Support + FIB Golden Ratio ).
So, can place a bid around $1.9-2.0 as I am seeing a quick bounce in that area for quick 16-25% profit. Never forget SL.
CHEERS!!!

DYDX/USDT SignalDYDX Coins' price of $3.075 may experience a slowdown. It is important to note that the cryptocurrency market can be highly volatile and prices can fluctuate rapidly. It is recommended to conduct thorough research and seek financial advice before making any investment decisions.
It is possible that the price of DYDX Coin, currently at $3.357, may decrease in the future. As with any investment, it is important to consider the potential risks and to conduct thorough research before making a decision.


DYDX/USDT RELOADED CHARTTHIS is the chart i am publishing again coz moderators did hide my previous published chart coz of house rules violation.
All targets achieved as mentioned above.

Dydxusdt Testing Major Trendline Testing Major Trendline In daily timeframe
Incase Of breakout Expecting 200%+ Bulish Move
Always Wait For confirmed breakout Place Sl according YOur Risk Reward
DYDX (Y23.P1.Video1) #WYCKOFF Alignment spot onHi Traders,
This is a cointinuation of the previous post on DYDX.
I talk about targets and how they are aligned to some fibs and if it correlates well with BTC, then this makes sense.
I also give a #BTC update on this.
Please give me a like and share,
Regards,
S.SAri

DYDX (Y23.P1.E1).WYCKOFF Alignment spot onHi Traders,
Hope all is well.
The schematic tells the story., so far aligned and likely targets are the fib 1, then a pause to only continue to fib 1.414 and 1.618.
Please give me a like and share,
Regards,
S.SAri
We need to close above the TL and 618 to go long


DYDXUSDT Elliott Waves AnalysisHello friends.
Please support my work by clicking the LIKE button👍(If you liked). Also i will appreciate for ur activity. Thank you!
Everything on the chart. (update)
im still in pos, targets is relevant
Entry: market and lower
Target: 3 - 4 - 5
after first target reached move ur stop to breakeven
Stop: under 1 (depending of ur risk). ALWAYS follow ur RM .
risk is justified
Good luck everyone!
Follow me on TRADINGView, if you don't want to miss my next analysis or signals.
It's not financial advice.
Dont Forget, always make your own research before to trade my ideas!
Open to any questions and suggestions.

DYDXUSDT Triple Bottom!What is the triple bottom?
The triple-bottom reversal pattern has three roughly equal lows and indicates an opportunity to take a bullish position. Before the triple bottom occurs, the bears are usually in control of the market, forming a prolonged downtrend. The first bottom does not indicate anything out of the ordinary. Still, the second and third bottoms show a change in direction where buyers (bulls) may push the price action higher after the price breaks through the resistance.
Dydx is currently trading at 2.89
The DYDXUSDT has broken its triple bottom resistance line after 8 months of ranging market, indicating a strong bullish sentiment. and you can see high trading volume in the daily chart, expecting a potential up move.
Thanks
Hexa

DYDX/USDT Chart DYDX/USDT Chart
Entry Point: $2.957
Stop Loss: $3.125
Target 1: $2.806
Target 2: $2.598
Target 3: $2.302

Dydxusdt(based on NEo wave)Wait for the correction,I will update that when I see its finished.it will surprise you after the correction ends.
Has it on your watchlist.
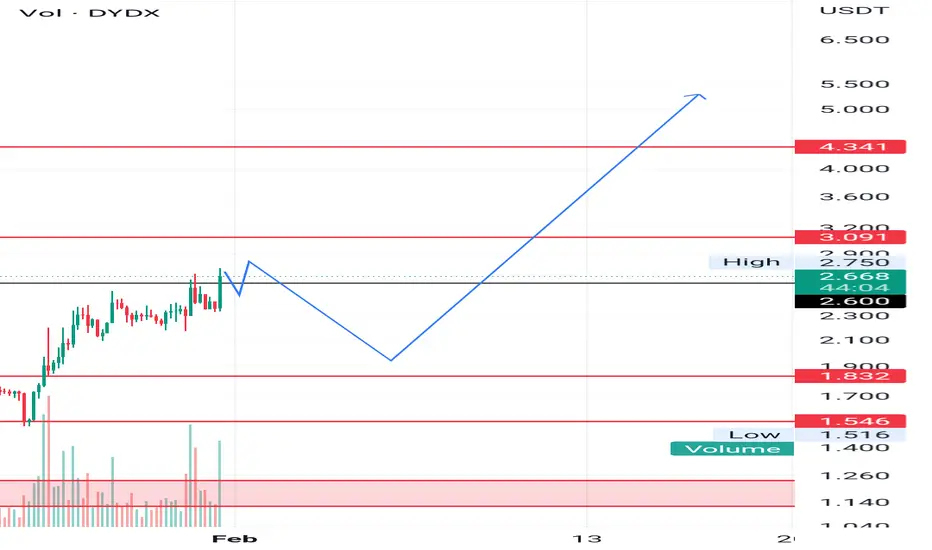
DYDXUSDT Resistance Zone Breakout!DYDXUSDT Technical analysis update
Buy zone: Below $2.65
Stop loss: $2.15
Take Profit 1: $3.05
Take Profit 2 : $3.70
Take Profit 3 : $4.20
Max leverage: 1x
Always keep stop loss

DYDX BOTTOM ACCUMULATION? DYDX is forming a nice accumulation base, potential bottom.
One to look out for!

DYDXUSDT idea✅ ✅ Risk warning, disclaimer: the above is a personal market judgment and analysis based on published information and historical chart data on The trading view,
And only some of these analyzes are my actual real trades.
I hope Traders consider I am Not responsible for your trades and investment decision.


#Dydx | #UsdtI think #Dydx is bullish (15M)
Targets : Green lines
Don't risk more tha 3% of capital.
____________________________________

DYDX USDT SHORT DYDX Trading in uptrend for few days now breaking down uptrend in 4 hour's time frame clear move for correction or retest to 200MA
DYOR
HAPPY TRADING
