DYDX - my favorite, ready to blow up.Hello Friends,
Look at this gem. Nice consolidation done, ready to blow up.
Target 1: 36-40,
Target 2 - 63
Target 3: $100
DYDXUSDT


DYDX/USDT Hello friends, I am happy to comment on this analysis below this post. ⭕📌Please like this post to support us and follow us. Thank

Closing in on a pump to upside or a small drop in next hours Bullish scenario.
BB bands are squeezing tightly and going horizontally, signaling a move up or down at any moment.
Forming a bullish pennant or flag by shape, that could be bullish sign and signal the next leg to upside to 29$
RSI is kind of showing bullish divergence on hourly and 4 hour chart.
MACD levels on 4 hourly are really low, signaling it could move a bit up now.
Bearish scenario.
volume is getting lower.
RSI on daily is moving down signaling a bearish divergence. and MACD levels have crossed to downside, which is bearish.
180 day exponential moving average is located at around 19$ , and it has to touch it at some point.
So it is a possible drop to 18$ - Drop to 18$ is not that low and would be healthy and from there we could start moving up again.
I don't see it going any lower than that for now.
Hit a like if this is useful and best of luck to you all! Keep a positive outlook and have a great day! :)

DYDXUSDTI missed this the first time around and have been watching it for the last few weeks. As it often happens in crypto, you get a second chance.
I think we have hit bottom. This looks like an inverse head and shoulders formation within a descending broadening wedge.
There was so much hype around this coin that has now died down; I think the second coming will be here imminently.
Buying in the $15-$16 range. Seems like a solid bet to me. Ranked just inside of the top 100 coins.
Are people actually using this exchange? Will it be the next FTX or Binance? Who knows.

DYDXUSDTDYDXUSDT OutLook Take LONG Swing
The information shared on this channel is not a guarantee of your investment, we recommend that you re-research what we have to say, so that you can make relevant decisions.
KEEP DESCLAIMER ON

🧮dYdX- Bottom is in? FIB 1.618 & 0.618(Forgive me the messy chart, but there's no other way I can present this)
The chinas ban on crypto and temporary hype on decentralized exchanges pushed DYDX to #1 spot in terms of 24h volume. But the hype didn't last long, so the price suffered 50% decline.
Now it looks like the bottom is in. The price has sat on 15.00 level creating potential double bottom. There's a confluence of 1.618 & 0.618 fib levels. Bullish divergence is visible on both MFI and RSI indicators.
Entry: buy at current price(green box) -- or wait for the confirmation: the price to break the neckline of this potential double bottom (watch lower timeframes)
Long-term targets:
TP1: 16.76
TP2: 18.42
TP3: 19.47
TP4: 25.09
-----------------------
About DYDX:
dYdX is a non-custodial decentralized exchange that allows users to leverage trade via Ethereum smart contracts. This gives traders the ability to trade on margin while also benefiting from the security provided by Ethereum. dYdX also partnered with StarkWare to build a layer 2 protocol for the exchange. This allows traders to deposit funds and trade instantly without paying gas fees for every transaction.
Source: yahoo

dydx to moon ^_^The possibility of ascending is through the penetration of the triangle, as I said, and also the penetration of the descending channel with a correction, then we move towards the 27-30


dydx broke the resistance DYDX is about to pump after throw back .
cci is broken
adx about to golden cross
price is above ichi cloud


$DYDX going to coinbaseHi guys,
Now you can deposit your dydx to coinbase.
I will buy more here and hodl.
If you don't buy here dydx you have to buy on 20-30$


DYDX-USDT price predictionWe never know when is the exact top or bottom, so the best way is to ladder.
This wedge will break sooner or later, so it makes sense to start buying on the way down.
RSI shows divergence in 4h TF.
So this would be a high probability trade to enter. I'm laddering from the $19.3 area.
DYDXUSDT LONGThis currency is ready to climb and in the best place, the best entry point in my opinion is 14 to 15, but to ensure that the downtrend is broken, the best way to

DyDx is Set to Rain PipsApply Caution......
PPPDirhams.
Disclaimer: This is just my idea. Am not liable for the end results if adapted by anyone. Trade cautiously as there are chances that you will lose your investment..
BINANCE:DYDXUSDT

DYDXUSDTHello Crypto Lovers,
Mars Signals team wishes you high profits.
We are in a 4-hour time frame.
As you can see, if the price does not drop below our support line, we can see a bullish bat pattern, and the price can reach the previous ceiling over time.
Warning: This is just a suggestion and we do not guarantee profits. We advise you analyze the chart before opening any position.
Wish you luck

DYDX - Bullish FlagWaiting for break confirmation.
Entry and TP will update later.
Nothing more, don't be hurry, we buy high then sell higher.

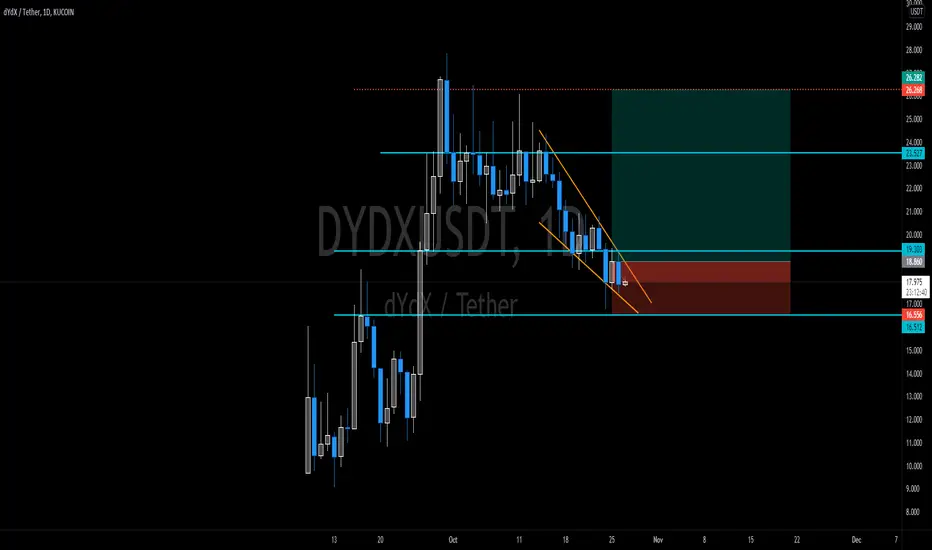
DYDXUSDT AnalysisHello friends.
Please support my work by clicking the LIKE button(If you liked).Thank you!
Everything on the chart.
open pos: market
target: 26 - 30 - 32
after first target reached move ur stop to breakeven
stop: ~16(depending of ur risk). ALWAYS follow ur RM .
risk/reward 1 to 3.5
Good luck everyone!
Follow me on TRADINGView, if you don't want to miss my next analysis or signals.
It's not financial advice.
Dont Forget, always make your own research before to trade my ideas!
Will be very APPRECIATE FOR UR DONAT/coins :)
Open to your questions or suggestions(Looking for investors!).

Defeat the descending flagIf the DYDX breaks its downward flag and pulls back, it will experience good growth.

DYDX AnalysisDYDX is a governance token that allows the dYdX community to truly govern the dYdX Layer 2 Protocol. By enabling shared control of the protocol, DYDX allows traders, liquidity providers, and partners of dYdX to work collectively towards an enhanced Protocol.
DYDX enables a robust ecosystem around governance, rewards, and staking — each designed to drive future growth and decentralization of dYdX, resulting in a better experience for users.
