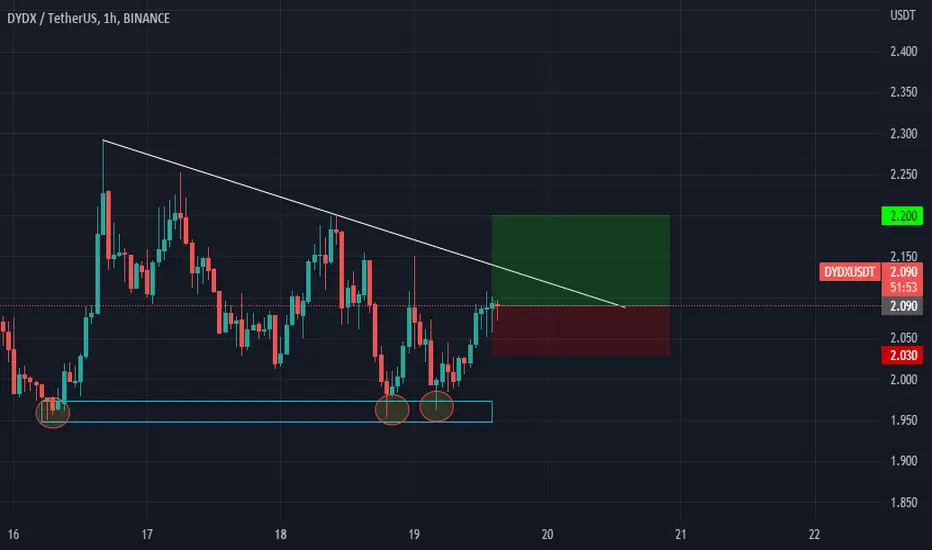
DYDX/USDT 1HOUR UPDATE LONG TRADE SETUP!!hello, members welcome to DYDX/USDT 1Hr chart update by CRYPTOSANDERS.
I have tried my best to bring the best possible outcome in this chart.
As we can see from the above-mentioned chart the DYDX/USDT brackout the chanel and retested the green zone now, at the current scenario we are expecting that DYDX will go up all the way to $1.98 means almost 15%.
So if it moves to the green zone again then it will be the zone to go long on DYDX/USDT
Remember:-This is not a piece of financial advice. All investment made by me is at my own risk and I am held responsible for my own profit and losses. So, do your own research before investing in this trade.
Sorry for my English it is not my native language.
Do hit the like button if you like it and share your charts in the comments section.
Thank you.
Dydxusdtlong

dYdX (DYDX) formed bullish BAT for another upto 13% pumpHi dear friends, hope you are well and welcome to the new trade setup of dYdX (DYDX) token with the US Dollar pair.
In the previous trade DYDX slightly move below than potential reversal zone, however, it then pumped well:
Now on a 4-hr time frame, DYDX has formed bullish BAT pattern.
Note: Above idea is for educational purpose only. It is advised to diversify and strictly follow the stop loss, and don't get stuck with trade

DYDXDYDX/USDT we are looking on this coin make Triple Bottom and we have a Resistance Zone now we are PUSHING LONG this coin ENJOY
Disclamer:
We are not financial advisors. The content that we share on this website are for educational purposes and are our own personal opinions
dYdX (DYDX) formed bullish Gartley for upto 13% moveHi dear friends, hope you are well and welcome to the new trade setup of dYdX (DYDX) token with Bitcoin pair.
On a 4-hr time frame, DYDX has formed a bullish Gartley pattern:
Note: Above idea is for educational purpose only. It is advised to diversify and strictly follow the stop loss, and don't get stuck with trade


DYDXDYDX/USDT after Reach Resistance Zone now moving nicely to pushing down im selling if break and Support zone target is 1.700

DYDXUSDT Analysis (LOCAL VISION)Hello friends.
Please support my work by clicking the LIKE button👍(If you liked). Also i will appreciate for ur activity. Thank you!
Everything on the chart.
Entry: market and lower
Target: 2.4 and 2.6
after first target reached move ur stop to breakeven
Stop: ~1.6 (depending of ur risk). ALWAYS follow ur RM .
Risk/Reward: 1 to 4
risk is justified
Good luck everyone!
Follow me on TRADINGView, if you don't want to miss my next analysis or signals.
It's not financial advice.
Dont Forget, always make your own research before to trade my ideas!
Open to any questions and suggestions.

DYDXUSDT AnalysisHello friends.
Please support my work by clicking the LIKE button👍(If you liked). Also i will appreciate for ur activity. Thank you!
Everything on the chart.
Entry: market and lower
Target: 5.2 - 6 - 7.5
after first target reached move ur stop to breakeven
Stop: ~3.8 (depending of ur risk). ALWAYS follow ur RM .
Risk/Reward: 1 to 4.5
risk is justified
Good luck everyone!
Follow me on TRADINGView, if you don't want to miss my next analysis or signals.
It's not financial advice.
Dont Forget, always make your own research before to trade my ideas!
Open to any questions and suggestions.

DYDX Retest long signalNice to meet you, everyone
I'm an alt trader
I am a South Korean soldier
I'm analyzing and recommending things that are similar to my personality among many alt coins
DYDX Retest long signal

DYDXUSDT Analysis (LOCAL VISION)Hello friends.
Please support my work by clicking the LIKE button👍(If you liked). Also i will appreciate for ur activity. Thank you!
Everything on the chart.
Entry: market and lower
Target: 5.5
after first target reached move ur stop to breakeven
Stop: ~4.2 (depending of ur risk). ALWAYS follow ur RM .
Risk/Reward: 1 to 2
risk is justified
Good luck everyone!
Follow me on TRADINGView, if you don't want to miss my next analysis or signals.
It's not financial advice.
Dont Forget, always make your own research before to trade my ideas!
Open to any questions and suggestions.

DYDXUSDT, We can go up until now Hello everyone
Did you check our last analysis of DYDX ??
DYDX is for the future not now but for years later its amazing because ...
In here, as you can see we were broke the key point level and this event gave chance to the price to start new rally because the trend can be change from this level , according to the chart in daily time that we have 100% correction for the last breakwave we can but one step in this zone and if the price rises up we can take profit but if the price drop more from here we can buy more .
Put your stop loss if you wanna trade it below the blue box ( prz level ) but if you wanna hold it you can delete your stop loss and buy in lower price.
Good Luck
Abtin
Previous analysis :

#DYDX/USDT LONG TERM VIEW , 275% POSSIBLE !!Hello, members welcome to this DYDX/USDT 4hr chart analysis by CRYPTOSANDERS.
I have tried my best to bring the best possible outcome to this chart.
DYDX/USDT looks bullish here, As we can see in the above-mentioned chart that DYDX broke the falling wedge pattern and retested.
In the current scenario, it's still trading at the green zone which is also the buy zone.
I am expecting a 275% potential rally in the upcoming weeks.
So we can hold it at the spot for upcoming 2 to 3 months for some good profit.
Entry:- $4.50,$4.90
Traget:- 275%
Stoploss:- $4.30
Remember:-This is not a piece of financial advice. All investment made by me is at my own risk and I am held responsible for my own profit and losses. So, do your own research before investing in this trade.
Happy trading.
Sorry for my English it is not my native language.
Do hit the like button if you like it and share your charts in the comments section.
Thank you...

DYDXUSDT Analysis (LOCAL VISION)Hello friends.
Please support my work by clicking the LIKE button👍(If you liked). Also i will appreciate for ur activity. Thank you!
Everything on the chart.
Entry: market and lower
Target: 6.3 - 8 - 9.5
after first target reached move ur stop to breakeven
Stop: ~4.1 (depending of ur risk). ALWAYS follow ur RM .
Risk/Reward: 1 to 6
risk is justified
Good luck everyone!
Follow me on TRADINGView, if you don't want to miss my next analysis or signals.
It's not financial advice.
Dont Forget, always make your own research before to trade my ideas!
Open to any questions and suggestions.

DYDXUSDT - SETUPDYDXUSDT:
Price again reached a critical support zone and bounced. We can see there is a breakout retest of the falling trendline. Now expecting a good pullback in upcoming sessions.


DYDXUSDT, The price broke the trendline resistance ...Hello everybody
DYDX is one the most powerful project that is working on DeFi ...
According to the chart and last analysis that we published all of the zone exactly done its duty and now at this time we are going to make new uptrend and we need more correction to have a nice R/r and then you can take position but check the chart in lower time frame and check, and take signal after that take position or buy in spot.
Exactly our last analysis was done and we expect after the price pullback to the trendline that was broken it has new power to reach to the new target and continue its moving to the up.
BUT BECAREFUL EVERYTHING AT THIS TIME OF MARKET IS DEPEND TO THE BITCOIN
Previous analysis :
Good Luck
Abtin

DYDX TA UPDATE (Requested chart)Hi guys, This is CryptoMojo, One of the most active trading view authors and fastest-growing communities.
Do consider following me for the latest updates and Long /Short calls on almost every exchange.
I post short mid and long-term trade setups too.
Let’s get to the chart!
I have tried my best to bring the best possible outcome in this chart, Do not consider it as financial advice.
LONG #DYDX breakout this Adam&Eve pattern currently it is retesting.
ENTRY: $6.15 to $5.920
SELL- 40% to 50%
LEVERAGE: 5X
STOP LOSS: $5.7
This chart is likely to help you in making better trade decisions, if it did do consider upvoting this chart.
Would also love to know your charts and views in the comment section.
Thank you

DYDXUSDT Analysis!!DYDXUSDT (1D Chart) Technical analysis
DYDXUSDT (1D Chart) Currently trading at $6.85
Buy level: Above $6.70
Stop loss: Below $5
Target 1: $8.4
Target 2: $10.5
Target 3: $15
Target 4: $25
Max Leverage 2x / Spot Market
Always keep Stop loss
Follow Our Tradingview Account for More Technical Analysis Updates, | Like, Share and Comment Your thoughts

DYDX Had Just Broked The ResistenceI think DYDX make a Huge Jump From Here. so we can try to make a huge Profit with Small Stoploss. Lets Try....
I am Not A Financial Adviser. And This Is not A Financial Advice. And All Cherts Are Just My Study. So Please Do Your Own Search before open Any Trade.
Aprox. All Crypto Currencies are Correlated to BTC . So If There is a Big Dump in BTC . All alt coin go down with it. Without Respecting any Technical Analysis
If You Like My Work Just Come and Join Me.

DYDX (dYdX) | DYDX/USDT Targets Hi , DYDX (dYdX) is testing the 4h resistance at the 0.5 Fibonacci level and is trying to break the resistance in the daily time frame after passing several times.
The price of liquidity from the demand area received $4.6 , Stop loss is a must as always. little risky, but highly potential 🚀 Good luck everyone & Be profitable🤘🏼
📌 It's not financial advice 📌


DYDXUSDT, Did you bought ???Hello guys
I hope you re in profit in these days of market, the condition of market is not stable and we should conscious and becareful about our capital.
Do you know about DYDX ?? Do you know why is the first and most poweful exchange on defi base ? Do you know anything about Zk-Rollups ??
If you wanna learn Fundamental & Technical analysis you can send us messages in private ---> Our id is in profile
According to the chart and our serial previous analysis of DYDX : Both of our buy zone area activated and now because of the consolidation the price in support zone area that rise the expectation that the price can rise up to test resistance zone trendline .
We shown sensitive zone that can drop the price if the price can break this level successfully the price can reach to the new target that we try to update that very soon.
If you have any question send us messages in private
Good Luck
Abtin
Previous analysis :

DYDX/USDT 2HOUR UPDATE BY CRYPTOSANDERS Welcome to this quick DYDX/USDT analysis.
I have tried my best to bring the best possible outcome in this chart.
Reason of trade:-DYDX/USDT tringle pattern conform and retest buy the green zone
Entry:-CMP and BUY THE DIP
Target:- 15% to 20%
Stop loss:- 5.748
Remember:-This is not a piece of financial advice. All investment made by me is under my own risk and I am held responsible for my own profit and losses. So, do your own research before investing in this trade.
Happy trading.
Sorry for my English it is not my native language
Do hit the like button if you like it and share your charts in the comments section.
Thank you.
