DYDXUSDT, We impact to the resistance and ...Good Night everyone
DYDX is one the most powerful project that is amazing for futures and use Zk-Rollups and ...
If you want to learn Fundamental & Technical analysis send us messages in private ---> Our id is in profile
According to the chart and previous analysis, we expect in days ago that the price ready to drop and ... but its not happend and one time our SL was activated and now we expect the price should drop another time because of the condition of market because of the drop of BITCOIN because of the reach to the trendline heavy resistance zone because of ...
All of the reason show us that the chance of the drop is more than other scenario.
If you have any question send us meesages
Good Luck
Abtin
Previous analysis :
Dydxusdtlong

DYDXUSDT, We should sell nowHello everybody
If you wanna learn Fundamental & technical analysis send us messages in private (Our id is in profile)
According to the chart, we wanna publish it very soon to dont this opportunity loss
Take it guys just it
Good Luck
Abtin
Previous analysis :

DYDXUSDT, Exactly buy zone area activatedHello everybody
According to the chart and our serial analysis of DYDX, After the crazy dump from 9$ was happend we shown on chart PRZ level that can change trend and it can be the point of the swing trend.
Exactly our 2 buy zone area was activated and now we think we should re-test again the zone and be sure that is the heavy support area after some rise and ...
You can buy guys in these buy zone and reduce your average purchase.
We will update the target after be sure that the price is ready to move upwards but until their time happen you can buy with your own capital management in these zone that we shown.
Good Luck
Abtin
Previous analysis :

DYDXUSDT, Exactly our first ...Hello everybody
Accoding to the chart, exactly the price came to reach to our first buy zone area and activated that and now we expect the price can drop another time to reach to the second buy zone area but the price can move upwards from here.
If you are not bought anything i suggest you buy one step in here in this price and if the price drop more you can buy another step for reduce average purchase.
DYDX is one the token of hearing many about it in future and we should have some of them in our portfolio.
If you have any question send us messages in private
Good Luck
Abtin
Previous analysis :

💡Don't miss the great buy opportunity in DYDXUSDTTrading suggestion:
". There is a possibility of temporary retracement to the suggested support line (6.4).
. if so, traders can set orders based on Price Action and expect to reach short-term targets."
Technical analysis:
. DYDXUSDT is in an uptrend, and the continuation of the uptrend is expected.
. The price is above the 21-Day WEMA, which acts as a dynamic support.
. The RSI is at 35
Take Profits:
TP1= @ 8.519
TP2= @ 8.995
TP3= @ 10.725
TP4= @ 12.978
TP5= @ 14.256
TP6= @ 16.555
TP7= @ 20.568
SL= Break below S4.8

DYDXUSDT Analysis (LOCAL VISION)Hello friends.
Please support my work by clicking the LIKE button(If you liked).Thank you!
Everything on the chart.
If, after breaking through 10$ on retest, this level show strong, then in the medium term our goals will be 15$ and 20$, if not, then we will go to update the local bottom to the 5$ area.
Entry: market and lower
TP short term: 10 and 12
after first target reached move ur stop to breakeven
Stop: under 7 (depending of ur risk). ALWAYS follow ur RM .
Risk/Reward 1 to 4
risk is justified
Good luck everyone!
Follow me on TRADINGView, if you don't want to miss my next analysis or signals.
It's not financial advice.
Dont Forget, always make your own research before to trade my ideas!
Open to any questions and suggestions.

DYDXUSDT , This route can be happen Hello everybody
According to the chart , the price made pattern price and we this this movement can be happen .
But the important things is the trend of the market in DYDX is downward in this time frame and its risky position for buying but it has nice R/r to buy .
Previous analysis :
If you have any question, send us messages
Good Luck
Abtin

DYDXUSDT , We are going to ...Hello everybody
According to the price that impact to the support trendline, we expect the price to be supported as the price approaches again and this support rise the price again.
Previous analysis :
Good Luck
Abtin

DYDXUSDT , Market give another opportunitiesHello everybody
Did you check our last analysis of DYDX ?
Again the market give us opportunity to buy in buy zone area , this is the most important level of supporting , and the key point of trend .
According to the chart that the price is supporting in here we expect this time to break the resistance level that is long time on our way ( trendline resistance ) , and after that we can reach to the new target
We shown another zone that you can buy if the price dump of shadow to it
Previous analysis :
If you have any question send us message
Good Luck
Abtin

Dydx really!hey traders, there is Dydx ,as we see at the chart, we need closing above the blue line for 1D bar to get the green lines (short term's targets)
the yellow lines (long term's targets) and the stop loss is a close under the red line for 1D bar
.
trade carefully guys and don't forget the risk management.
.
.
.
.
.
.
.

DYDX/USDT - Potential 84% SetupHello Traders!
The DYDX completed the correction, the price returned to the trading range of $11.68 - $14.00.
At the moment, the price is testing the downtrend and trying to consolidate above the resistance level of $14.00
You may consider purchases between $13.05 & $14.25
It is better to place a stop loss below the level of $11.68 near the level of $10.50
Targets will be price levels of
$18,00
$21,45
$25,90
Good luck and watch out for the market
P.S. This is an educational analysis that shall not be considered financial advice

longHi, I think this is the best time to buy, because the price has dropped to the bottom of the ascending channel and your whale movements have increased. What is your opinion? The fundamentals of this currency are also excellent.

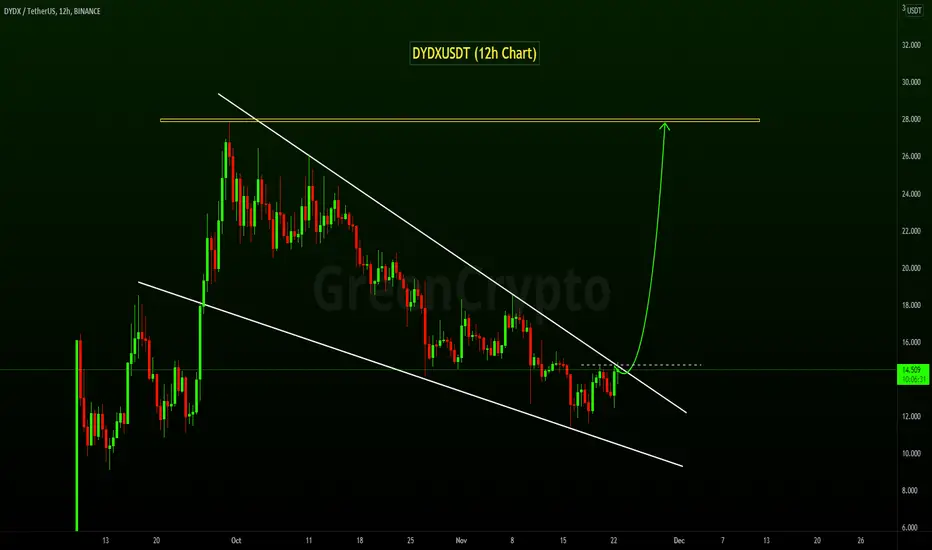
DYDXUSDT Falling Wedge Pattern!!DYDXUSDT (12h chart) Technical analysis
DYDXUSDT (12h chart)Currently trading at $14.4
Buy level : Above $15
Stop loss: Below $11
TP1: $18
TP2: $20
TP3: $24
TP4: $27
Max Leverage 3x
Always keep Stop loss
Follow Our Tradingview Account for More Technical Analysis Updates, | Like, Share and Comment Your thoughts.
DYDX Buy Setup Dydx is more under rated coin but it will pump now. Now it's time for #Dydx..
Buy below 14.500
Targets.
16.00
17.00++
24.00.
Stop loss= hold..

DYDXUSDT , Exactly our buy zone area works :D :D :DHello everybody
According to our last analysis in correction wave we shown on chart buy zone area that can work and support the price
We wanna publish this idea last night but we got alert from the tradingview team that we only can publish 10 chart in a day
And this happend and we can publish this amazing situation for buying for you traders
At this time because of the movement of the candle its not good time to take in position but if you wanna have dydx in your portfolio or ... you can enter in position after some correction
Previous analysis :
Dont forget manage your position
Good Luck
Abtin

DYDXUSDThey traders
check the chart and levels
what u think about DYDX ?
Share ur chaer and leave a comment

Buy dydx/usdtAs you see, #dydxusdt has broken a descending trend line.
The trend line is so important to me, and I strongly believe that the horizontal resistance can not stop the movement.
We will get a bounce very soon.
#dyor
Manage your risks.
Good luck,
Median Eagle.

DYDXUSDT AnalysisHello friends.
Please support my work by clicking the LIKE button(If you liked).Thank you!
Everything on the chart.
open pos: market
target: 26 - 30 - 32
after first target reached move ur stop to breakeven
stop: ~16(depending of ur risk). ALWAYS follow ur RM .
risk/reward 1 to 3.5
Good luck everyone!
Follow me on TRADINGView, if you don't want to miss my next analysis or signals.
It's not financial advice.
Dont Forget, always make your own research before to trade my ideas!
Will be very APPRECIATE FOR UR DONAT/coins :)
Open to your questions or suggestions(Looking for investors!).

DYDX goin BULL🤑🤑🤑Another altcoin making its move
But be always be sure to wait for a retest, for every trade you take.
Remember your risk management. Finally Goodluck in your trade.

DYDX on it's major support* DYDX is trading on it's major support of $19, even the below trendline is working as support for the price.
* We can expect bounce from the support or if the price breaks the $19 support we can see a drop till $15.

$DYDX UPDATE The $DYDX pump gonna be super huge. Are you ready?
If you didn't enter yet, then enter between $22.4 and $22.2. S/L : $21.7

NeutralHi guys, it looks like we are moving in a downtrend and in case of failure you can see the price falling until the uptrend. Wait and enter after the failure.

DYDXUSDT - Flag PatternDYDXUSDT (4H Chart) Technical analysis
DYDXUSDT (4H Chart) Currently trading at $24.5
Buy level :Above $24.9
Stop loss: Below $20.7
TP1: $27.4
TP2: $32.2
TP3: $37.3
TP4: $43.6
Max Leverage 3x
Always keep Stop loss
Follow Our Tradingview Account for More Technical Analysis Updates, | Like, Share and Comment Your thoughts.
