DYDX/USDT Poised for a Massive Breakout – Is a Rally Toward $2+?✨ Comprehensive and Engaging Technical Analysis:
DYDX/USDT is entering a highly compelling technical phase, showing signs of a potential trend reversal after breaking out from a prolonged accumulation zone that lasted nearly 5 months. This breakout on the daily timeframe (1D) is a classic early signal for a major upward move — often favored by swing traders and mid-term investors.
🔍 Accumulation Zone & Fibonacci Golden Pocket
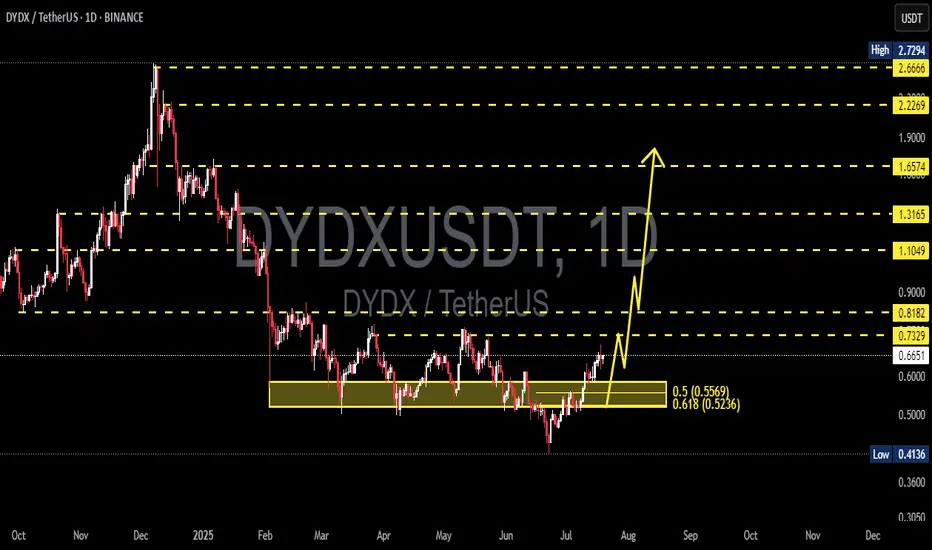
The range between $0.52 and $0.56 represents the Fibonacci retracement levels of 0.5 and 0.618 — commonly referred to as the "golden pocket".
This area historically acts as a strong accumulation zone, where institutional players often enter the market.
Multiple rejections and support confirmations within this zone reinforce its significance.
📈 Structure Breakout:
DYDX has officially broken above the horizontal structure near $0.6566 and further confirmed momentum beyond $0.7329.
The price action is forming a Double Bottom Pattern and potentially an Inverted Head & Shoulders, both of which are high-conviction bullish reversal patterns.
✅ Bullish Scenario (Primary Bias):
As long as DYDX holds above the $0.66–$0.73 breakout range, it remains on track for a significant bullish impulse. Key upside targets include:
Target (Resistance) Significance
$0.8182 Minor horizontal resistance
$1.1049 Key level from prior supply zone
$1.3165 Previous major reaction area
$1.6574 Multi-timeframe major resistance
$2.2269 – $2.6666 Fibonacci extension & historical distribution zone
$2.7294 Previous all-time high
💡 This structure offers a potential upside of over +200% if fully played out.
❗ Bearish Scenario (Alternative):
A failed retest and drop below $0.6566 would suggest a false breakout.
A breakdown below $0.52 would invalidate the bullish setup and could send DYDX back to $0.41, its previous macro support.
In this case, the market may re-enter a range-bound or sideways phase.
⚙️ Conclusion & Trading Strategy:
DYDX/USDT is at a technically critical moment. The recent breakout could mark the beginning of a major reversal trend after months of consolidation. A healthy pullback to the $0.66–$0.73 zone could offer an ideal entry opportunity with tight stop-losses.
For swing traders and trend followers, this may be one of the best risk/reward setups on DYDX in recent months.
#DYDXUSDT #DYDXBreakout #CryptoBullish #AltcoinSeason #CryptoAnalysis #FibonacciLevels #SmartMoney #DYDXRally #TechnicalBreakout
Dydxusdtsignal


DYDXUSDT 1D AnalysisDYDX ~ 1D Analysis
#DYDX Buy gradually from here with a short term target of at least 15%+.

DYDXUSDT 1DDYDX ~ 1D Analysis
#DYDX If this is valid. This will be a double bottom. Buy gradually from here with a short -term target of at least 15%+.

DYDXUSDT 1DDYDX ~ 1D Analysis
#DYDX High risk trading, buy after successfully penetrating this resistant line with a short -term target of at least 10%+.

DYDXUSDT 1WDYDX ~ 1W Analysis
#DYDX In this time frame 1W the lowest support for now. Buy from here if you still have a Conviction on this coin with a minimum target of 20%++

DYDX correction to 5.20$BINANCE:DYDXUSDT
Dydx now underrated. Where ill start buy Dydx again? Where ill take a profit on local correction? And why Dydx can pump to 5.20$?
✅Before we start to discuss, I would be glad if you share your opinion on this post's comment section and hit the like button if you enjoyed it.
Thank you.
Possible Targets and explanation idea
➡️Fib since drop in April.
➡️Perfect call to sell by "Trade On" indicator
➡️Accumulation phase between -0.18 and -0.618 levels
➡️Forming lower low in June and took liquidity. Correction to drop can be at least to 0.5 level by fib 5.20$
➡️2 signals Strong Buy in May and June
➡️Rejected at "Take profit" line. If we capitulate one more time we can drop to 1.05 (now its a "Buy line")
Hope you enjoyed the content I created, You can support with your likes and comments this idea so more people can watch!
✅Disclaimer: Please be aware of the risks involved in trading. This idea was made for educational purposes only not for financial Investment Purposes.
* Look at my ideas about interesting altcoins in the related section down below ↓
* For more ideas please hit "Like" and "Follow"!

DYDXUSDT 1WDYDX ~ 1W
#DYDX If you still have Conviction on this coin,. This support block would be a very good buying place for now,. Buy from here with a minimum target of 20%++

DYDX usdt"🌟 Welcome to Golden Candle! 🌟
We're a team of 📈 passionate traders 📉 who love sharing our 🔍 technical analysis insights 🔎 with the TradingView community. 🌎
Our goal is to provide 💡 valuable perspectives 💡 on market trends and patterns, but 🚫 please note that our analyses are not intended as buy or sell recommendations. 🚫
Instead, they reflect our own 💭 personal attitudes and thoughts. 💭
Follow along and 📚 learn 📚 from our analyses! 📊💡"

DYDXUSDT 1WdYdX Update ~ 1W
#dYdX At 1W Time Frame, #dYdX Again, it was rejected from this resistance line. The best way for now. Buy gradually after breaking this resistance line with a Full Candel,. Or you can place a buy on this support block..
these two scenarios with a minimum target of 20%+

DYDXUSDTDYDX ~ 1D
#DYDX Forming a descending pattern. If you are interested in this coin, Maybe buying from here is not so bad.

DYDX LONG IDEA - DYDX TRADING IDEA - DYDXUSDTPERPDYDX Buy zone is $1.35 , $2 for me and I think I will buy from there if it falls. Stay tuned. fibonacci levels are very important.

DYDXUSDT Elliott Waves Analysis (Investment Idea)Hello friends.
Please support my work by clicking the LIKE button👍(If you liked). Also i will appreciate for ur activity. Thank you!
Everything on the chart. (update)
Everything according plan, we got downward movement in 2.3 - 2$ zone, im already in pos.
Closest Targets: 3.3 - 5 - 7.5 - 11
Main(investment) target zone: 10-12$
RR: 1 to 10
Cancellation of setup - decreasing under ~1.1
notes: it's also possible to see 15-17-20$ targets, but for me it's speculative position and i will sell everything by 10-12$
It's not financial advice.
DYOR!

DYDXUSDT incoming bull trendHello traders, DYDX is currently at the best price to buy, it has hit the Daily low again (1.8 - 2.0 )
I am expecting for a bullish trend again towards the high of 4.5 or maybe even breaking it to 7.0 - 7.5
enjoy trading!

DYDXUSD 5DDYDX ~ 5D 📈
#DYDX Make purchases gradually in this Support zone, make purchases with small trades, with a minimum target of 20%++

📈DYDX is going to retest or fall further📉 BINANCE:DYDXUSDT
KUCOIN:DYDXUSDT
Hello traders.
I believe in DYDX, why? Because this all-season (before or after halving) DEX (decentralized exchanges) are going to be under more attention.
right now, there are 3 scenarios in front of the traders.
in 1 & 2, the price can retest the 2- or 4-hour Bollinger midline and then retest the lower level of the pitchfork.
in 3, due to the heavy sell pressure, the price can sorely decrease below the 3.498 level. In that case, the bearish target would be $3.153.
✌💥If you are satisfied with my analytical content, please share my ideas💥✌
✍🐱👤Otherwise, make sure you leave comments and let me know what you think.🐱👤✍
🍾Thank you for your support. I hope you will gain profit by following my analyses.🍾

DYDX/USDT: Bullish Signals on the Horizon!The DYDX/USDT chart is showing two interesting technical indicators suggesting a potential uptrend:
Double Bottom Pattern: This formation often precedes a price increase.
Touchdown at 60-Day Moving Average: Support from this key moving average can signal a bounce.
Potential Long Trade Opportunity:
Based on these indicators, a long trade entry above the 60-day moving average (around $3.97-$3.98) could be an interesting possibility. However, remember, this is not financial advice.
Target Levels:
Here are some potential profit targets based on Fibonacci retracements:
Target 1: Fibonacci 0.5 - $4.44
Target 2: Fibonacci 0.618 - $4.48
Target 3: Fibonacci 1.0 - $5.00
Stop-Loss Recommendation:
Consider placing a stop-loss order below the double bottom's price range (around $3.75) to manage potential risk.
Key Takeaways:
This analysis highlights potential opportunities, but it's not a guarantee of future performance.
Do your own research before making any trades.
Consider using stop-loss orders to manage risk.
By understanding these factors, you can make informed decisions about your DYDX/USDT trading strategy.
Good luck!


DYDX/USDT Could DYDX Breakout the Falling wedge ?? Keep On EYE!💎 DYDX, a prominent player in the cryptocurrency market, has recently shown strong performance. It exhibited a robust bounce off a key support area and is currently on an upward trajectory toward a pivotal resistance trendline within a falling wedge pattern.
💎 A successful breach of this pattern could catalyze DYDX's continued rise, possibly leading it to challenge and break through the bearish OB area.
💎 However, should DYDX encounter resistance at this trendline and fail to break out of the pattern, there could be a reversal in momentum. This scenario might see DYDX retrace its steps back to the support zone around the $2.26 mark, where it would need to gather new momentum.
💎 The support zone at $2.26 becomes critical in this context. DYDX must demonstrate resilience at this level to maintain its bullish stance. A failure to hold above this support, marked by a breakdown, could signal a shift towards a bearish trend.
💎 Such a development would likely result in DYDX descending further, potentially towards a stronger demand area, underlining the significance of its ability to maintain support levels.

"DYDX/USDT Long Alert 🚀: Potential Rebound from Strong SupportLONG #DYDX/USDT
"DYDX is currently trading above the long-term established support level, and there is anticipation of a significant rebound from this point."
📈Entry Point: CMP). Additionally, be prepared to add more positions if the price drops to $2.652
💹 Targets: $2.860 $2.992 $3.143 $3.627 $4.3
⛔️ Stop Loss (SL): $2.556 to limit potential losses.
📊 Leverage: 5x to 10x
R:R :- 1:6 (Lucrative)
Use leverage cautiously and in accordance with your risk appetite. It's advisable to be conservative with leverage to mitigate the risk of significant losses.
Remember, This is not Financial Advice!

"CFX/USDT Long Setup: Bullish Breakout from Falling Wedge PatterTrade Setup for #DYDX/USDT: Long Position
Analysis:
DYDX has broken out of a falling wedge pattern, indicating a potential upward trend.
The current price (CMP) serves as the entry point.
The breakout is being retested, suggesting a potential confirmation of the bullish move.
Entry Point: Current Market Price (CMP)
Additional Positions: Consider adding more if the price drops to $2.870
Targets:
$3.4
$3.9
$4.35
$5.2
$5,8
Stop Loss (SL):
Set the Stop Loss at $2.825 to limit potential losses.
Leverage:
Use leverage cautiously: 5x to 10x.
DYOR

DYDXUSDTBINANCE:DYDXUSDT next move can start from here? we should wait and see
⛔"Daily crypto market analyses I provide are personal opinions & not financial advice. Trading carries risks, so do your own research & seek advisor's help.#DYOR"
Don't forget to like and comment
