ZECUSD ZCASH Entry On Retest at 96.56Break out candle on horizontal support resistance and dynamic support resistance at price area 96.56. Entry on retest at 96.56 price area.
Dynamicsupportandresistance

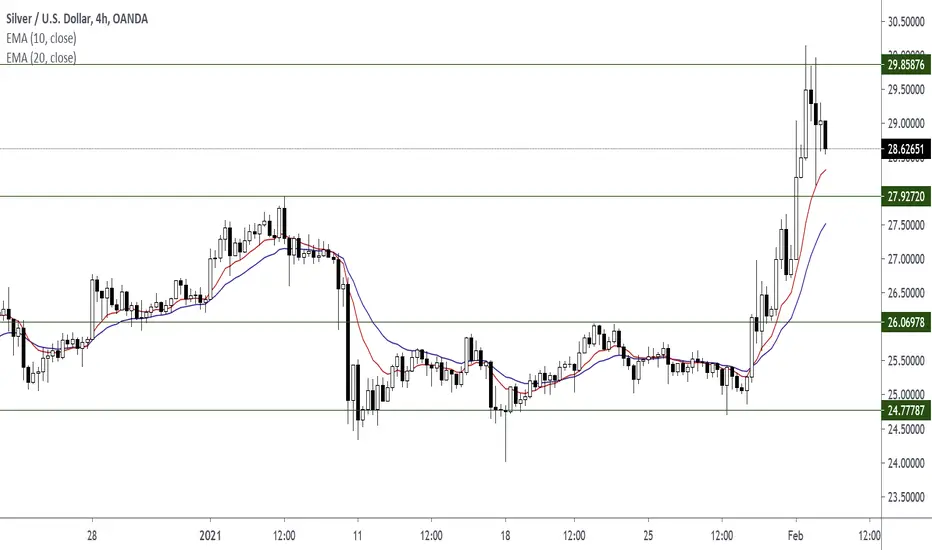
Wait for a price action signal at price level 27.92720 (XAGUSD)Silver XAGUSD. Wait for a pull back to dynamic support resistance and horizontal support and resistance.
EUR/USD - We got the break of structure!Good morning traders!
Check back to last week where we predicted a break of structure on the pair. Well, we've seen that.
Look at price now respecting and finding support at our already marked key level in the market. With bears looking pretty strong will we see a break of this level and further movement to the downside this week?
Look closely, and you can see our ascending trendline has been used as dynamic resistance. Price broke the line to the downside, came back to retest the line before falling. This is a great bearish confirmation to enter a long term short position.
Happy Trading!


Wait For A Pullback For an Entry (Target Price 146.00)Wait For A Pullback and Pin Bar For an Entry.
Wait for price to pull back to the exponential moving averages. Look for price to pull back to horizontal support resistance line and dynamic support resistance (exponential moving averages). Next, watch for a bullish price action signal like a pin bar at horizontal and dynamic support resistance levels.

NWC/USDT is going to be bullishNWC is going to be bullish while the cup formation is going to be completed and the ladder structure highly supports the trend

AAPL 4h highly probable to be bullishAAPL in Nasdaq is going to be bullish due to bullish signs in volume - RSI - ADX - MACD and other classic indicators so we just need a confirmation from crossing the dynamic resistance from the trend

PAXG/USDT 4h is still bearish so still not profitable to investPAX gold is bearish as the overall trend obviously shows it and it crossed dynamic support plotted in the chart so its going to be either neutral for next days or bearish, no signs of bullish for now so still not profitable as we expect

"BAC"k and Forth in Bank of AmericaAgainst a backdrop of the broader stock indices that don't seem to want to spend ANY time, at ANY level (w/ the possible exception of the Russell 2000), today we forayed BACk into Bank of America using a dynamic support level that printed at 25.5. When breakouts or fades get tricky, we like to fall BACk (okay, stop me) to names that are staying inside a well defined channel.
We have additional confluence, or strength of signal (SOS), at the 233 EMA (T-Line) on the 1H timeframe.
Expressed trade as Oct 25/28 Bull Call for $1.15db A $1.15 debit sounds familiar - maybe check out our SPY Put idea while you're here. See Related Idea.
Risk is the usual 50%-ish of premium paid.

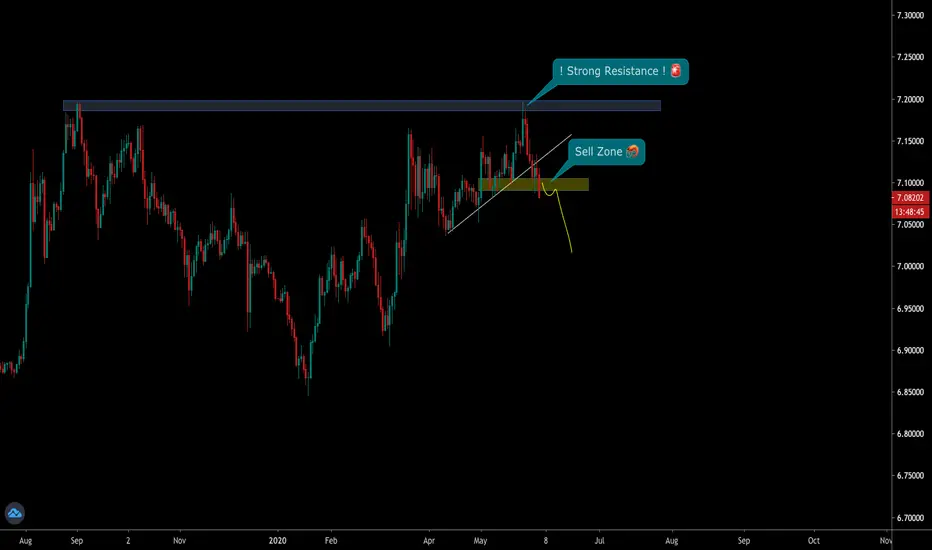
USDCNH Broke the support 🦐Hello traders, After a nice bullrun, the price hit on huge resistance (see our previous idea) . The price retested even the dynamic resistance and broke the recent support. We will wait another retest and according to
According to Plancton strategy, we can set a nice order
–––––
Here is the Plancton0618 technical analysis, please comment below if you have any question.
The ENTRY in the market will be taken only if the condition of Plancton0618 strategy will trigger.
LIVIDITIUM Channel. Major top and bottom indicator/predictor.Look at historical levels for ATH and local highs, as well as ATL and local lows, etc.
Candle lengths and other parameters optimized for BTC, but can be adjusted for any charts.
Link to Script:
