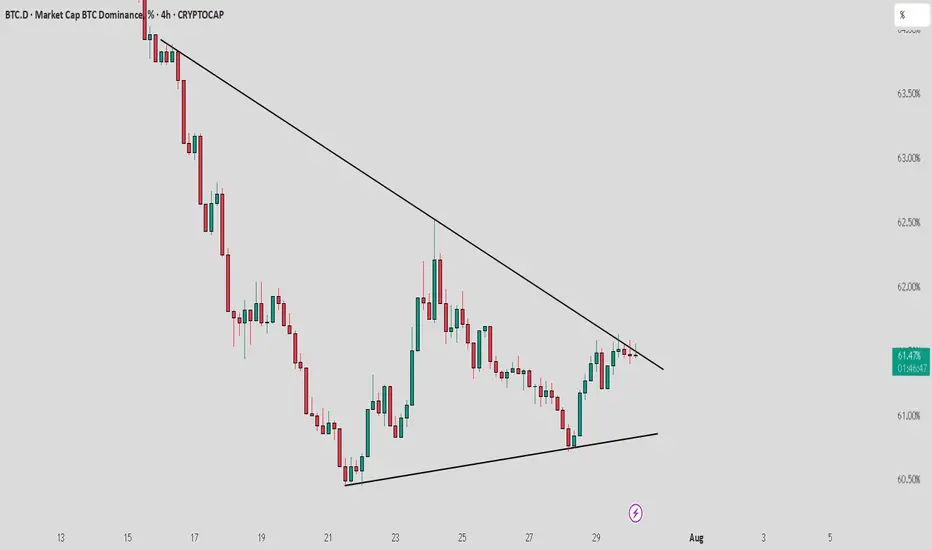
BTCDOM : Near to breakout from trendline resistanceBitcoin dominance is nearing a breakout from trend line resistance. Keep a close watch as a breakout from here could lead to a short-term market correction, negatively affecting altcoins. Stay cautious with your long positions and use proper stop loss strategies.
KEEP A CLOSE WATCH ON IT
Dyor
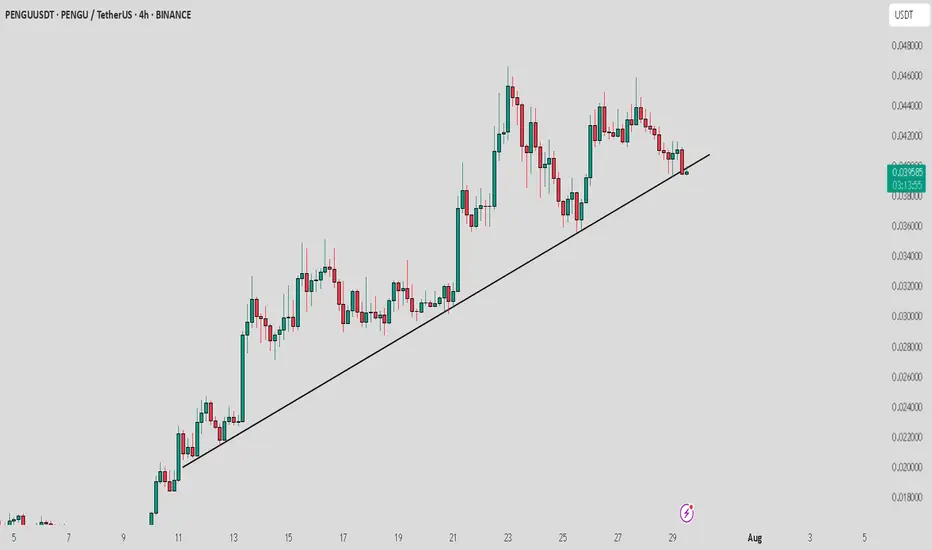
PENGU / USDT : Breaking down from Trendline supportPENGU/USDT is breaking down from the trend line support, but the retest is still in progress. Watch for rejection at key levels.
Pro Tip: Wait for confirmation of rejection before entering the trade and always apply proper risk management to safeguard your position.
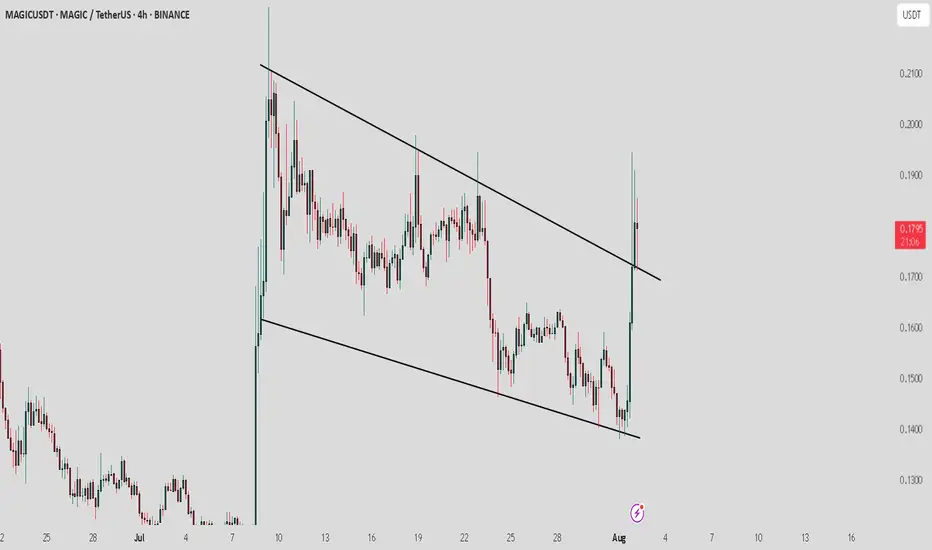
MAGIC/ USDT: Retest is in progress, keep a watch on confirmationMAGIC / USDT has broken out from the Trendline resistance and retest is still in progress . However, the market conditions are not ideal right now.
Bullish scenario : If the price holds above the breakout level and the retest is confirmed, the next target could be 0.19–0.21.
Bearish scenario : A failure to maintain above the breakout level may lead to a drop back to 0.15 or 0.13.
Pro Tip: Use tight stop-losses below the breakout point. Wait for confirmation before committing larger positions. Keep an eye on BTC dominance
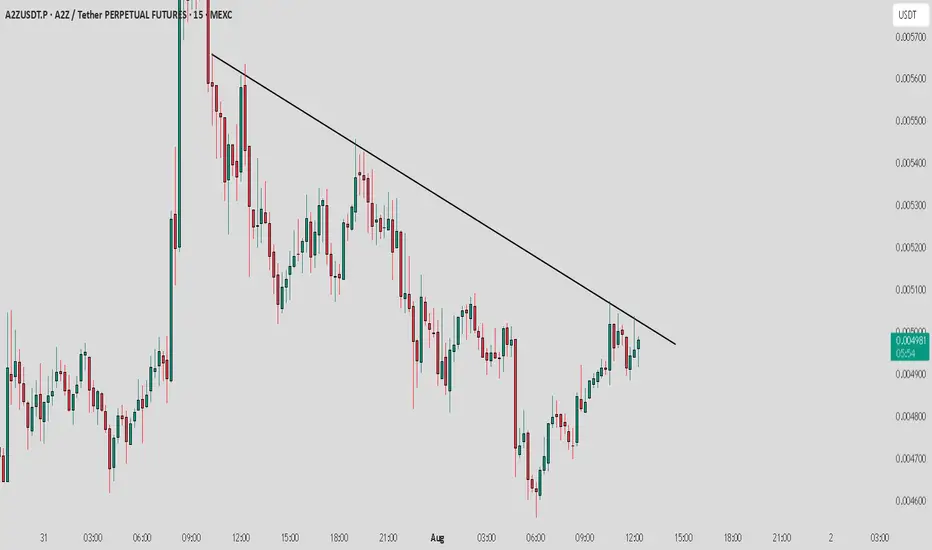
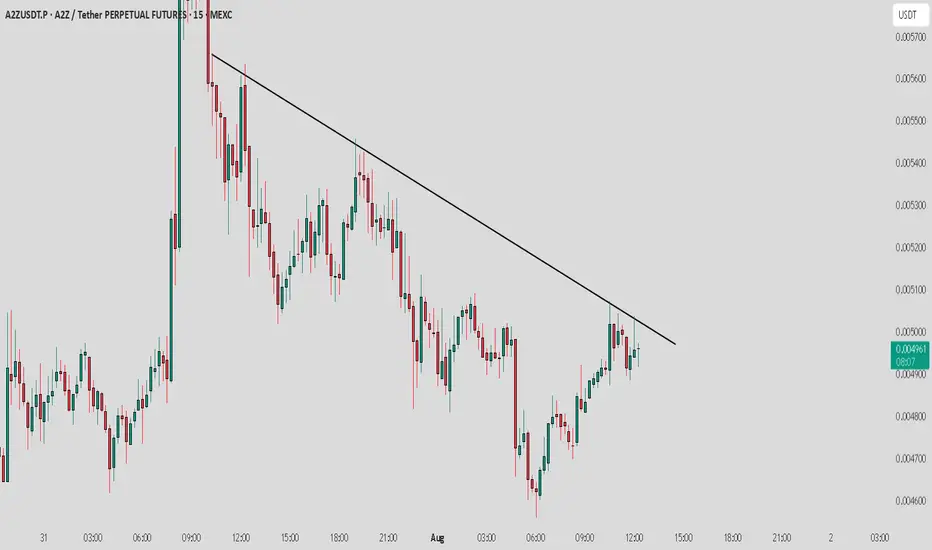
A2Z / USDT : Near Trendline resistance , Keep a close watch A2Z/USDT - Nearing Trendline Resistance
A2Z/USDT is approaching a crucial trendline resistance. Although it looks weak at the moment, a successful breakout could trigger a short-term rally of 10-15%.
Bullish Scenario:
If the price breaks above the trendline, we could see a sharp move upwards, with potential gains of 10-15%. Watch for confirmation of the breakout with higher volume and momentum.
Bearish Scenario:
Failure to break the resistance could lead to further consolidation or a potential reversal, testing lower support levels.
Keep an eye on the trendline and volume for the next key move.
A2Z / USDT : Near trendline and showing weakness, Avoid long A2Z/USDT - Nearing Trendline Resistance
A2Z/USDT is approaching a crucial trendline resistance.
Bearish Scenario:
Failure to break the resistance could lead to further consolidation or a potential reversal, testing lower support levels.
Keep an eye on the trendline and volume for the next key move.
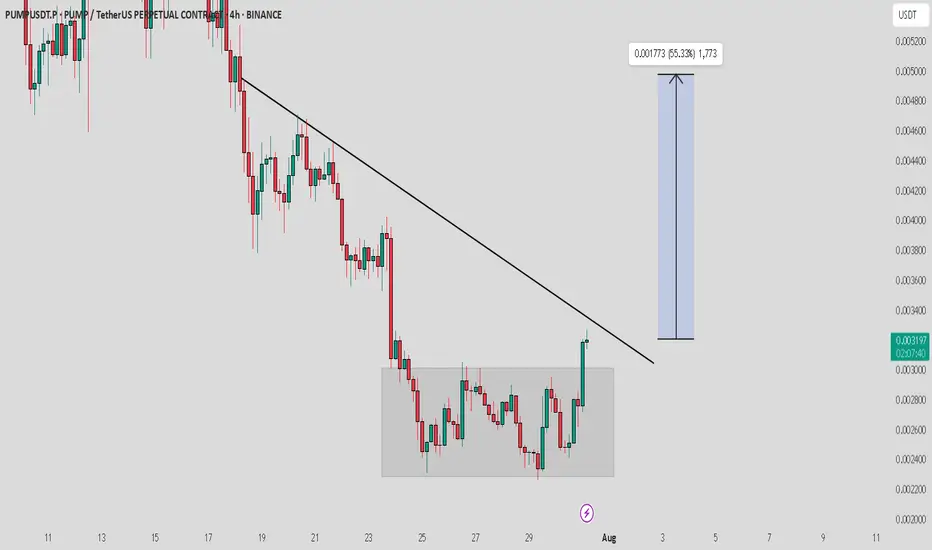
PUMP / USDT : Looking Bullish PUMP/USDT Analysis:
PUMP/USDT shows strong bullish potential after breaking out of consolidation. A retest to the box area is likely before a breakout from the trendline resistance. Once the trendline is broken, expect a major rally with a 40-50% potential upside.
Key Levels:
Support: Consolidation Box
Resistance: Trendline
Wait for confirmation of the trendline breakout before entering. Always manage risk with a stop-loss and stay patient for a clear move. The setup looks promising for a solid bullish rally!
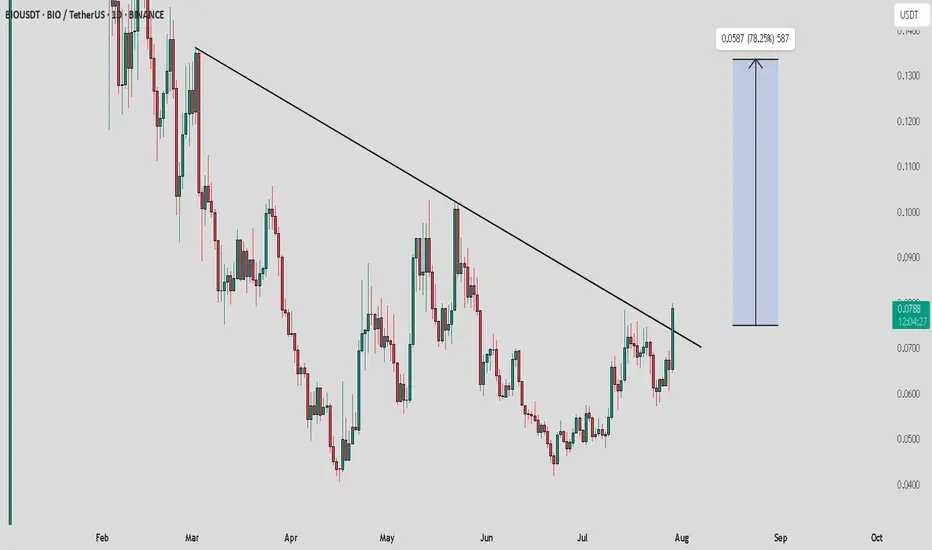
BIO / USDT : Breaking out with strong potentialBIO/USDT breaking resistance with Strong potential
Bullish Scenario: If the price maintains momentum above key support, expect a continued move towards $0.15.
Bearish Scenario: A failure to hold above support could lead to a pullback to lower levels.
Pro Tip: Enter on confirmation of support hold or breakout above $0.075. Set tight stop loss to manage risk.
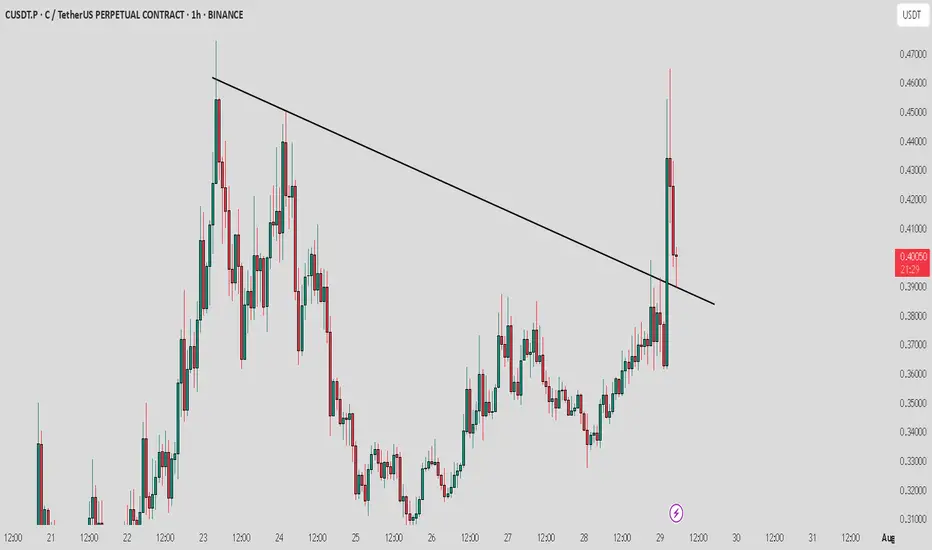
C / USDT : Watch closley to a retest for better Entry and profitC/USDT is currently retesting the breakout area. Expecting a short-term rally of 15-20% if the retest holds.
Bullish Scenario: If the retest is successful, we could see a continuation of the uptrend towards higher targets.
Bearish Scenario: A failure to hold the breakout level could lead to a pullback towards key support levels.
Pro Tip: Keep a tight stop loss around the breakout level to manage risk while targeting potential gains in the rally.
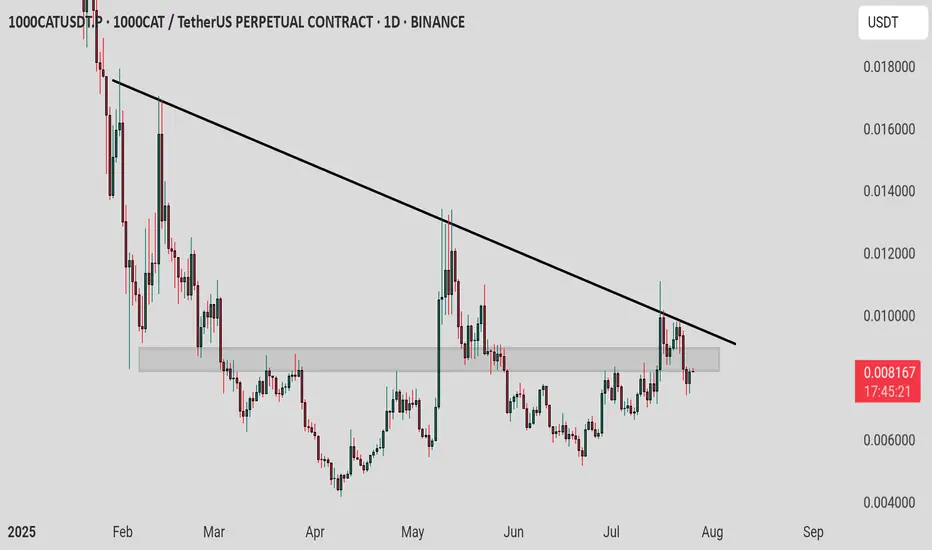
1000cat / usdt : Keep a close watch for rejection or breakout 1000CAT/USDT Analysis:
1000CAT/USDT is currently testing horizontal resistance and is near a potential breakout from the trendline resistance. This is a crucial level to watch for either a rejection or a breakout.
Key Levels:
Horizontal Resistance: Current price level.
Trendline Resistance: Near breakout.
Scenario 1: Breakout:
If the price breaks above both resistance levels, it could lead to a strong bullish move. Watch for confirmation on higher timeframes.
Scenario 2: Rejection:
If the price fails to break through and gets rejected at these levels, a pullback or reversal could occur.
Tip: Keep an eye on volume and confirmation candles to validate the breakout or rejection.
SUI / USDT : Looking bullish SUI/USDT chart shows a breakout from a descending trendline, confirming upward momentum. Current price tests the resistance zone around $4.00. BTC is receiving support from the FVG, indicating short-term bullish potential.
Bullish Scenario: If price breaks above the resistance zone, a rally towards $4.50 to $5.00 is possible. Watch for confirmation of higher highs on shorter timeframes.
Invalid Setup: If price fails to break the resistance and falls back below $3.50, the bullish setup would be invalidated.
Pro Tip: Always wait for a clear confirmation candle above the resistance zone before entering a trade to minimize risk.

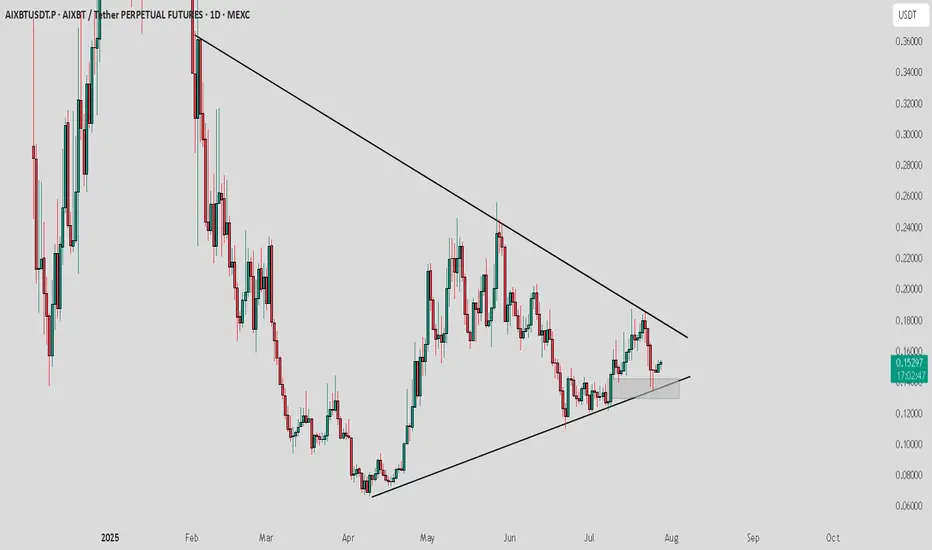
AIXBT / USDT : Getting support and moving towards resistance AIXBT/USDT is currently forming a symmetrical triangle pattern and testing a key support zone. A short-term rally of around 10% towards the upper resistance is expected, leading to a potential breakout.
Bullish Scenario:
A solid breakout above the upper trendline could initiate a major rally, targeting levels around $0.18 and higher.
Watch for confirmation of the breakout for a sustained move.
Targets for the short-term rally:
Expect a move towards $0.18 before the breakout happens. A major rally will commence once the breakout occurs. 🚀
Stay patient and keep an eye on the price action for potential entry points! 📈
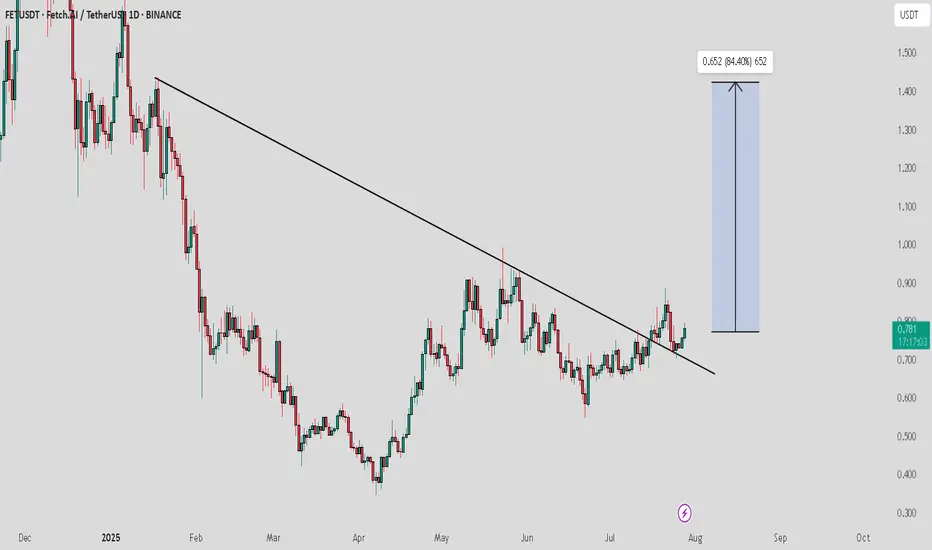
FET / USDT : Momentum building after successful retestFET/USDT has successfully broken out of the descending trendline resistance and is now holding strong after a successful retest. With momentum building, we are expecting a significant move towards the $1.5 level in the coming weeks.
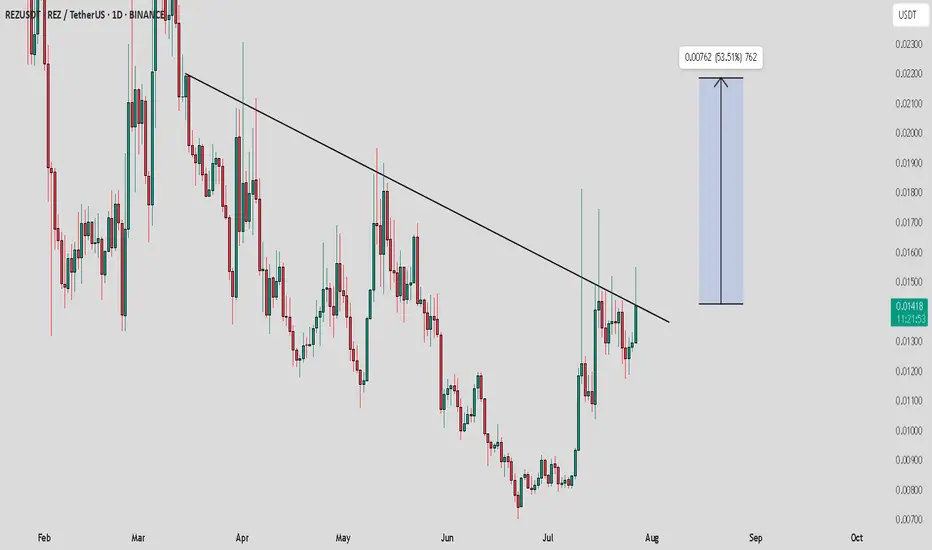
REZ / USDT : Trying to breakout from Trendline resistanceRez/USDT is currently testing a crucial trendline resistance. The chart shows signs of a potential breakout, and if it surpasses this resistance, we could see a strong move towards $0.0025. With increasing momentum, this could trigger a short-term bullish rally. 📈
Bullish Scenario:
If Rez/USDT breaks the trendline resistance decisively, we could see a price surge towards $0.0025.
Target: $0.0025 with a possible continuation beyond that if momentum builds.
Bearish Scenario:
If the price fails to break the resistance and gets rejected, we may see a short-term pullback.
Watch for a strong support zone to form for potential re-entry at lower levels.
Pro Tip:
1. Enter after breakout above trendline.
2. Set stop-loss below trendline.
3. Target $0.0025 for short-term gains.
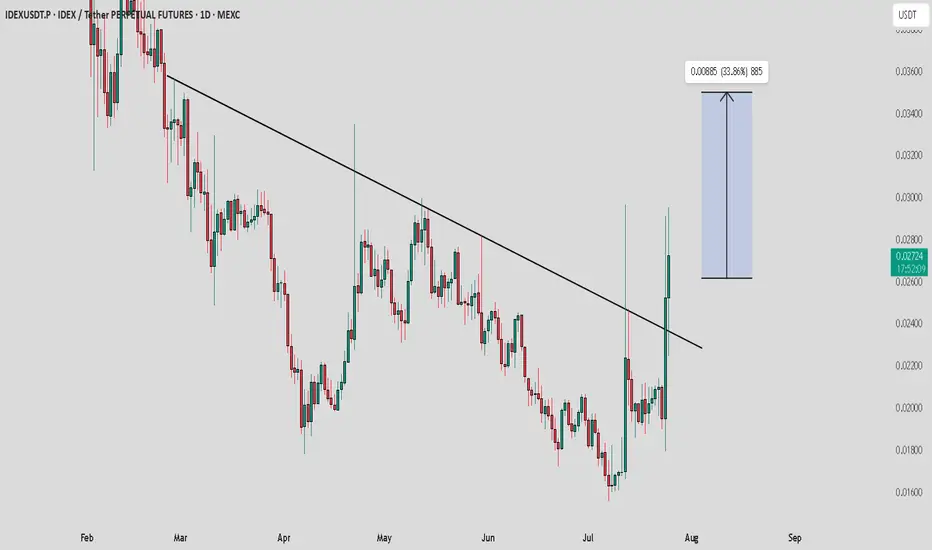
IDEX / USDT : looking bullish in choppy market situationThe overall market is not looking very strong right now, but IDEX is showing bullish potential. It's moving with strong volume and confirming its breakout with consistent bullish moves.
Key Points:
IDEX seems to be breaking out with solid momentum.
Watch for confirmation of continued bullish movement to ensure it’s not a fakeout.
Note:
Manage your risk carefully. Only invest money you can afford to lose. Always Do Your Own Research (DYOR) before making any decisions. Stay cautious and ensure you're prepared for any market fluctuations.
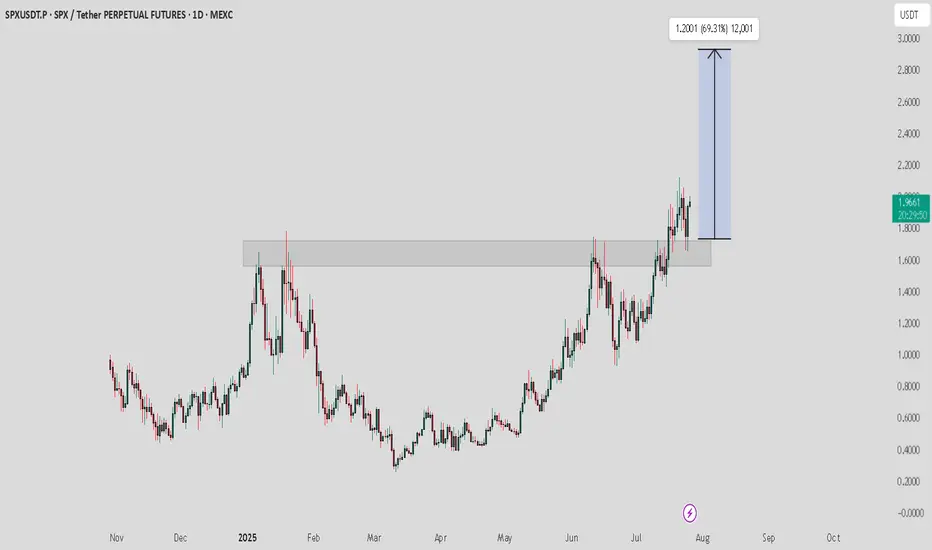
SPX / USDT : Broke out and now successful retestSPX/USDT has broken out from a consolidation zone, with the price approaching key resistance at $1.90. A sustained move above this level could push the price towards the $2.10-$2.40 range, offering a 6.3% upside.
Bullish Scenario: Price stays above support, targeting $2.10-$2.40.
Bearish Scenario: Breakdown below support invalidates the setup, signaling potential downside.
Risk Management: Monitor price action closely and adjust positions if support fails.
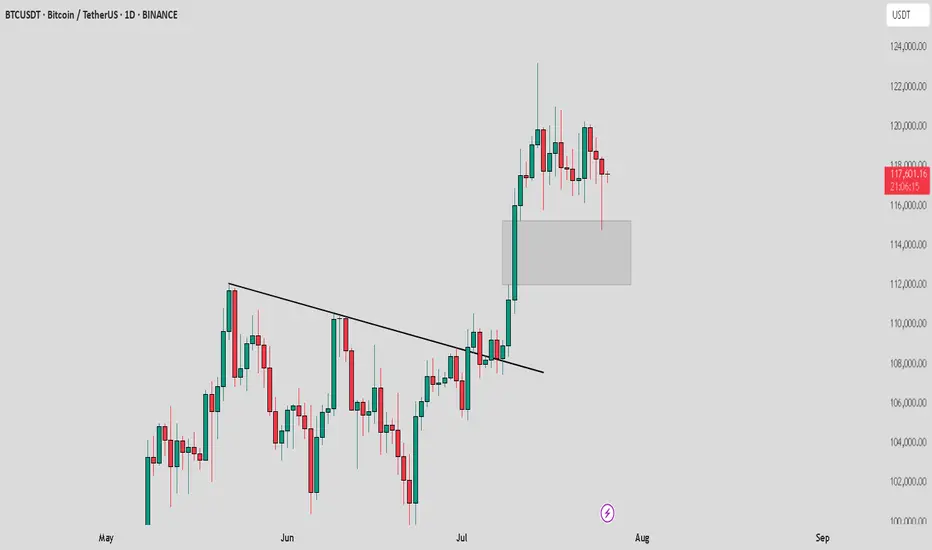
BTC /USDT : Getting support from FVG BTC Support from FVG - Bullish & Bearish Scenarios:
Bullish Scenario:
BTC is holding support from the FVG. As long as BTC stays above this zone, the market remains bullish. A bounce here could lead to further upside.
Bearish Scenario:
If BTC breaks below the FVG, it signals a potential downtrend. A breakdown may lead to more pain and further declines in the market.
Tips:
1. Wait for Confirmation: Look for a clear candle close above/below FVG for validation.
2. Risk Management: Set stops near the FVG to manage potential losses.
3. Monitor Volume: Strong volume during support retests increases bullish potential.
4. Stay Flexible: Be prepared for a market shift if BTC breaks the FVG support.
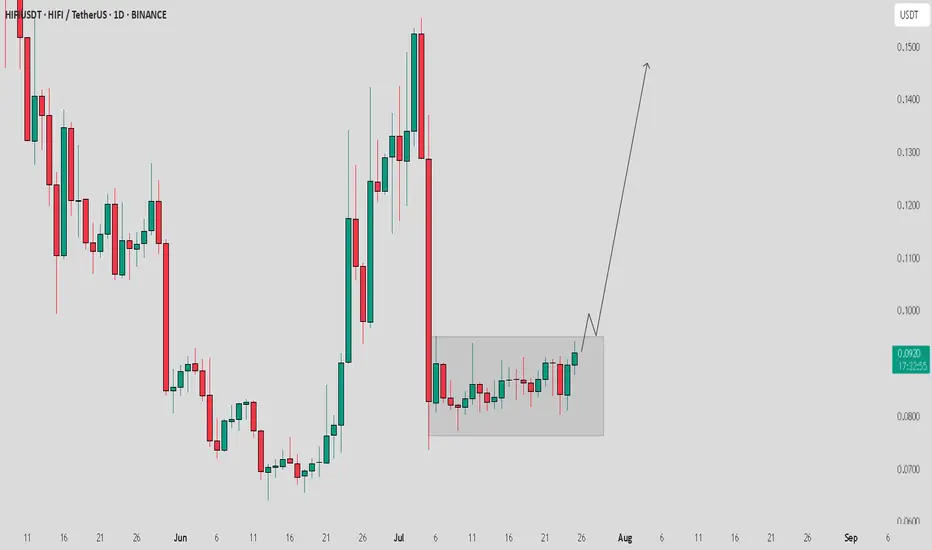
HIFI / USDT in consolidation zone heading to break through itHIFI/USDT Analysis:
HIFI/USDT is currently in a consolidation zone and seems to be heading towards a potential breakout. If it breaks through this zone, we could see a good move towards $0.14 soon, assuming the market remains stable.
Bullish Scenario:
Breakout above consolidation zone could trigger a strong move towards $0.14.
Confirmation: Watch for strong volume during the breakout to ensure the move is genuine.
Bearish Scenario:
Failure to Breakout: If the price fails to break through and stays within the consolidation, the setup might remain invalid.
Note:
Current market situation is not looking very strong right now. I hope the correction happens smoothly soon, but if the market remains unstable, this setup could become invalid. Always manage your risk and stay cautious.
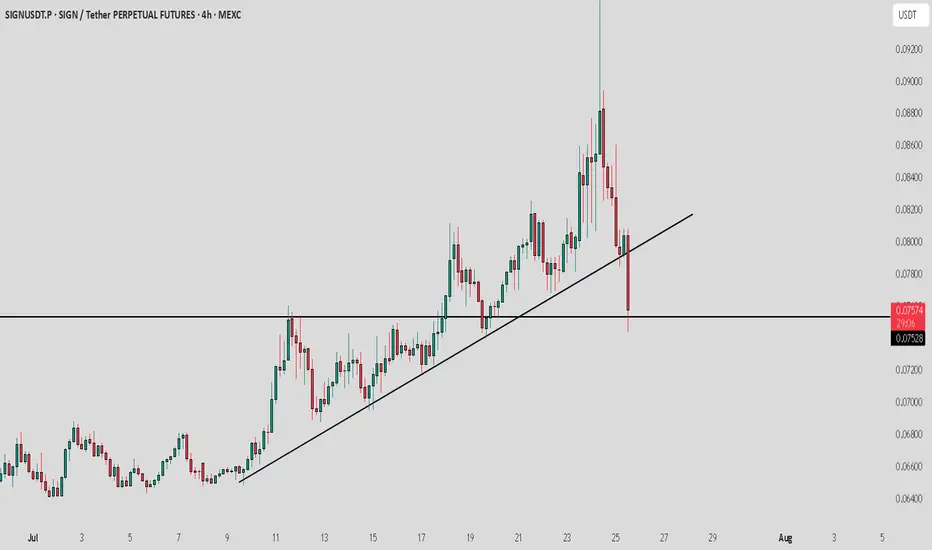
Sign / USDT : Huge breakdown and currently sitting on supportSIGN/USDT Analysis:
SIGN is testing a crucial support level. The price has pulled back from its recent highs and is now sitting on a key Horizontal line. How the market reacts here will determine the next move.
Bullish Scenario:
Horizontal line Support: If the price holds above the Horizontal line and shows signs of buying pressure, a bounce could happen, and we may see the price move back up towards the previous highs.
Confirmation: Look for strong bullish candles or an increase in volume to confirm the bounce.
Bearish Scenario:
Horizontal line Breakdown: If the price breaks below the Horizontal line and fails to recover, further downside could be expected.
Target: Watch for the next support level to gauge the downside potential.
Note:
The market is volatile, and a shakeout could happen at any moment. Manage your risk carefully and only invest what you can afford to lose. Stay cautious and watch for confirmation before entering any positions.
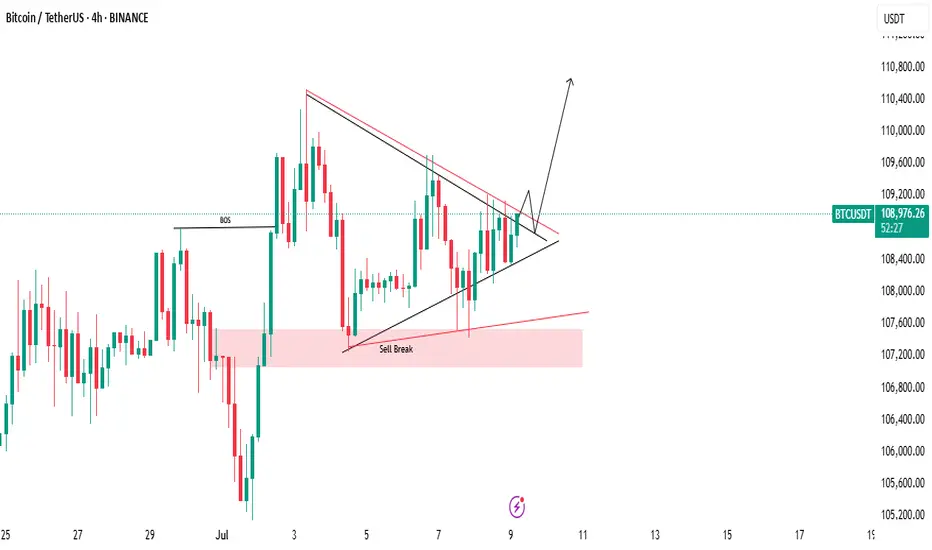
There’s a higher probability of an upward breakout.🚨 Bitcoin Technical Update – Key Levels Ahead! 🚨
Bitcoin is currently forming a symmetrical triangle pattern, a classic setup that often signals a strong move ahead. At the moment, the market is leaning toward the upside, showing early signs of bullish momentum.
📈 If we see a breakout to the upside, it's crucial to wait for a retest of the breakout level. A successful retest could confirm the move, setting the stage for a strong upward rally. However, if the breakout fails, don’t rush in — just observe the price action closely to see how the market reacts.
⚖️ There’s a higher probability of an upward breakout, as liquidity is still building above, and there are strong support levels holding below. This combination could act as a springboard for price to move higher.
🔍 As always, Do Your Own Research (DYOR) before entering any trade. Stay alert and manage your risk wisely!
Aevo
📊 Overview Analysis
The AEVO cryptocurrency, after a sharp downward movement, entered a consolidation range. Following a prolonged range-bound movement, the price managed to climb within an ascending channel on the 4-hour timeframe, reaching the top of its consolidation range.
🕰 4-Hour Timeframe Analysis
🔸 Current Status:
The price is challenging both the top of the ascending channel and the range ceiling.
Increased trading volume indicates growing liquidity in this area.
🔸 Bullish Scenario:
A breakout above the ascending channel's ceiling could trigger a parabolic move toward the green target zones.
🔸 Potential Risks:
An RSI divergence on the 4-hour timeframe suggests a possible pullback.
Corrections could extend toward the channel's midline or, in a more severe case, to the channel's lower boundary.
🎯 Price Targets & Key Considerations
🔹 Upside Targets:
Breakout to the green zones following an upward channel breach.
🔹 Downside Risks:
RSI divergence might limit upward momentum, leading to short-term corrections.
Maintaining support at the channel's midline or bottom is crucial for a sustained bullish outlook.
💡 Advice: Always employ risk management and rely on personal analysis when making trading decisions.
💡 Reminder: This analysis is for educational purposes only and should not be considered financial advice.

Xauusd going short in my opinionTapped 4H FVG and got rejection twice, US Elections etc i think avoiding trading is best for few days and i am not a financial advisor etc do your own research before making any decision

AUDNZD. Set to rise for next week!
On the daily timeframe the moving averages are setup in alignment and this trade is with the trend as the daily 200ema sits just below price.
On the 4HR timeframe there was some bullish RSI divergence where the RSI made a higher high but the AUDCHF went lower. This should also cause a momentum shift upwards.

My Analysis Of Gold Price Next Week - Another Big Short Possible
From what I can glean, the damage on Friday's Short came from an M_Top pattern on the Hourly-Chart. These breaches at the neckline are notorious for huge sell-offs.
One thing I am being mindful of is a more extensive M_Top pattern on the 4HR chart. But the scary thing is that the neckline is only 0.69% down the Gold-price corridor. Scary stuff hey!
But wait, there's more!
A breach of the neckline around 2482 could wind the Gold-price back to 2434. Now, I am not saying that is definitely going to play-out. We just have to be careful with the USDX again rallying next week. This is just a scenario that is possible. Why? Please read on below.
As it turns out, the 2434 level where price 'could-go' is right on the Daily-chart 50EMA and just below that is a firm 4HR support level at 2432. If this plays out, support would be made around 2432, and so long as price holds at this level there would also be firm support by the Daily 50 EMA.
Here is the Daily-Chart which supports my theory.
* This is my own analysis of the Gold-price. This does not constitute financial advice on whether you should be buying or selling the Gold-price.
* Trading is Risky. Please don't solely accept my setups or financial advice. Glean your research from a variety of professional traders.
