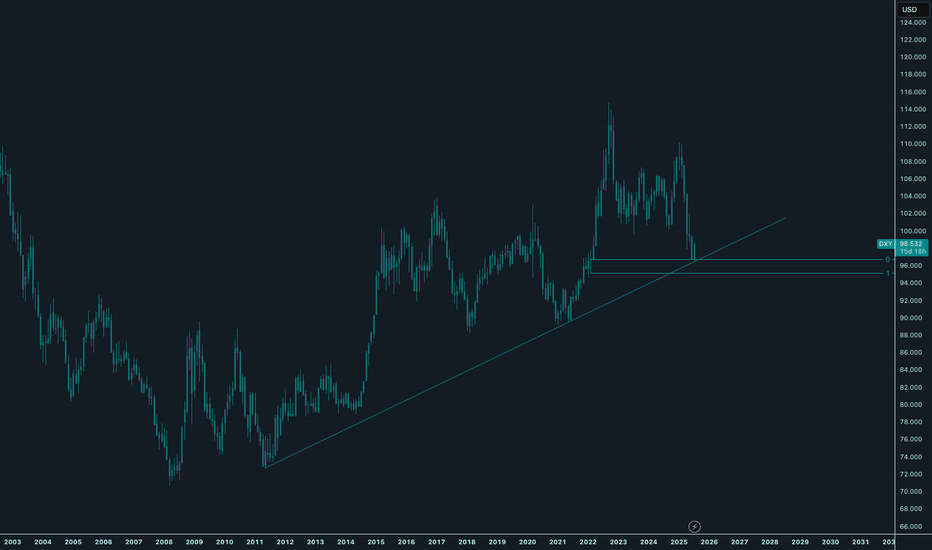
Dollar MoonHey,
Been a while that I shared a chart here, sorry for that.
I love the place where the dollar is at the moment.
The easiest plays are from these long-term value areas, and this one is also stacked with a trendline making it a bit more obvious for everyone.
The daily trend is broken since yesterday, shifting bullish long-term. I think a daily pullback is likely, perhaps even back to daily lows to fill up demand.
But long-term, I am super bullish for the dollar.
The $ has been bullish since 2008, we all see it.
Time for the next leg up.
Let's go!
Kind regards,
@ mnieveld
Dyx
EURUSD Bulls Reloading — Big Week Ahead? FOMCEURUSD has been riding the uptrend for a while now, but we’ve finally hit a bit of a pause. Recently, the pair posted one of its biggest up-days since 2009 — a huge bullish signal — and momentum carried it even higher! 🔥
Now, price has pulled back slightly from the highs, with last week showing a modest dip as the dollar regained some strength. I do expect we could see a little more pullback in the short term… but overall, my bias remains bullish. I believe the uptrend is still intact, and we could see EURUSD push higher again this week! 📈
What’s your view? Are you buying the dip or expecting a deeper correction?
Drop your thoughts below — and if you found this analysis useful, a boost or follow is always appreciated! 🙌
#DXY 1W#DXY 1W;
The Dollar, which has managed to gradually accumulate until today with the falling trend resistance in October 2022, is preparing to move upwards again.
Aside from the fact that it has tested the FVG area 2 times, we will soon find out if it will be successful in its 3rd attempt.
It would not be a surprise to see a rise up to 108-109 levels. If it exceeds these levels, the falling trend (red) above may act as resistance again.
Analysis of the movement of the dollar index(DXY)Hello traders, The TVC:DXY is pulling back to the resistance range of 104.22-104.72, and if this pullback is completed, the forecast is confirmed and the DXY will go up to the range of 105.91-105.67.
If this post was useful to you, don't forget to like and comment.
DXY FALL INCOMING! xxxUSD to SPACEDXY us currently BEARISH and we are only look for SHORTS here.
How does this help us trade the market?
RULE - DXY goes DOWN, xxxUSD go UP
CHEATSHEET - Your xxxUSD trades will not move if DXY isn't ready for that big impulse legs
I make sure when I take SUD trades that day is in full support of the direction am taking.
I won't get in on any new xxUSD LONG if DXY hasn't reached the UB (Upper Band ) on the H4.
We already have the EMA CLOUD, so every UB will be a badass impulse trigger (Learn the HOOD SUITE SYSTEM)
I will be on full throttle LONG on xxxUSD (check for NOTIFICATIONS to see which of the USD pairs we will be attacking) when DXY reaches the UB on H4 as the next impulse leg should kick in from there.
INVALIDATION - IF we get a close on the PREV HIGH level then we will chart a course for the next move when that happens.
P.S I will post money making trades like this everyday and everything you see on my chart is
from the HOOD SUITE INDICATORS, everything you need is right in front on you inside the indicator.
(The key zones, Levels for manipulation, visible SL for invalidation, Alert when trade setup is ready).
No trend lines or complicated analysis, all you have to do is FOLLOW!
DXY, Major structure to keep in mind.DXY / 1W
Hello traders, welcome back to another market breakdown.
DXY has been trading in a bullish trend all year, However, the price has been pulling back from the second leg up.
The price on the weekly is approaching the major brekout point where heavy bulls might show up.
Checkout the chart for a full understanding on where is the market cercle at the moment.
Trade safe,
Trader Leo.
Check DYX WavesAs the dollar index rises, all parallel markets, including commodity, crypto, fiat currencies, etc., weaken, and with the decline of this index, some parallel markets revive.
By analyzing the monthly time frame, we realize that this index is in the e wave of its large diametric F.
It seems that there is a correction ahead for wave f of F. You may not give this amount of correction for f from F, but the high potential point for starting wave g from F is the upper green box.
SFP on DYXDYX just took the high of September 2002 and it looks like an SFP. this level is lining up with the 0.78 fib level. I am not saying that it will immediately reverse now and goes down but there is the possibility and we should look at that. I don't actually short DYX right now because of the fundamentals and positive data that comes out of the American market but there is the setup. the confirmation of this idea is changing MS in DXY which hasn't happened yet. I use this index as a confluence to my bias about how this could affect other markets. DYX goes up, legacy market and crypto go down. if DXY goes down the crypto and legacy market go up.
DXY DOLLAR INDEX Bearish Divergence$DXY DOLLAR INDEX- Bearish Divergence
The DXY is drawing a bearish divergence on the 1D. Historically, this signaled a nearing top.
This is further corroborated by the fact that the divergence took form at the top of the range and after a parabolic rally.
#TheCryptoCity


