Green Plains | GPRE | Long at $4.18Green Plains NASDAQ:GPRE , a company involved in the production of fuel-grade ethanol and corn oil, and grain handling/storage has seen a significant decline in stock price since 2023. Analyzing the company's historical stock performance shows it is highly cyclical and goes through "boom and bust" cycles every 4-8 years - whereby during booms the price has typically 10x'ed from the lows. History may not repeat, though.
From a pure technical analysis perspective, the company has already entered and slightly exited by "crash" simple moving average zone (green lines). While the lows may not be in yet, this zone (currently between $1.20 and $3.30) typically represents a longer-term bounce area or price consolidation.
Fundamentally, the company is currently unprofitable but expected to become profitable in 2026 and beyond. Debt-to-equity = 0.72x (low/moderate). Price-to-book = 0.31x. During the most recent earnings call, Chief Legal and Administration Officer at Green Plains noted the company’s past performance has not met expectations, but stressed “that is changing.” This includes exiting non-core operations and launching the sale of non-strategic assets in a commitment to achieve $50 million in cost reductions. The company is on track to meet that goal and has already achieved $30 million in annualized cost savings.
It's a speculative play that could go to $0. But at $4.18, NASDAQ:GPRE is in a personal buy zone based on technical analysis as well as future fundamental predictions (which could be BS...).
Targets:
$6.00
$8.00
Earnings

ITS TIMEGME coiled on the 4hr RSI break 50 were launching from the POC area to 24.50 to next MA. Overall target after taking 26 is VAH around 27.58. The drop down was profit taking/ overextended /sell the news after all the hype leading into the btc purchase announcement they didn't disclose purchase price either from what I know. But btc is at ATH the 500M is now in decent profit and last quarter rev and earnings were good. Last time gme broke out was 17% on a overall stock market correction day, seems like thats going to be the case again for now im in the Aug 1 25 calls for .6 looking to close these in profit and roll to higher further out strike like the jan 26 35. cheers, here kitty kitty.

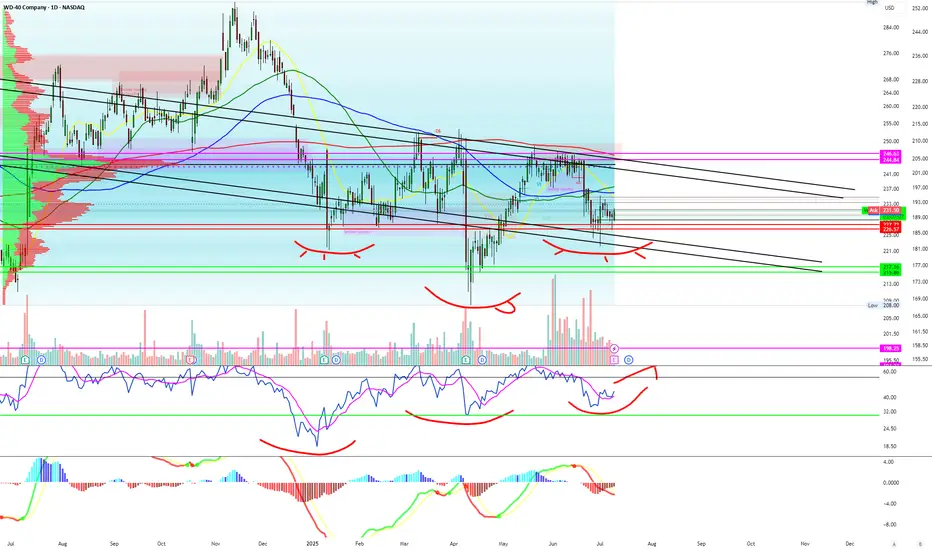
Never thought I'd be bullish WD-40 LMAOAll indicators such as RSI, descending channel pattern and MACD combined with options exposure make me believe earnings will be good in the stock prices eyes.
IWM and small cap stocks are really starting to pop off and nothing is more American then WD-40!!!
Target #1 - $240
Target #2 - $250
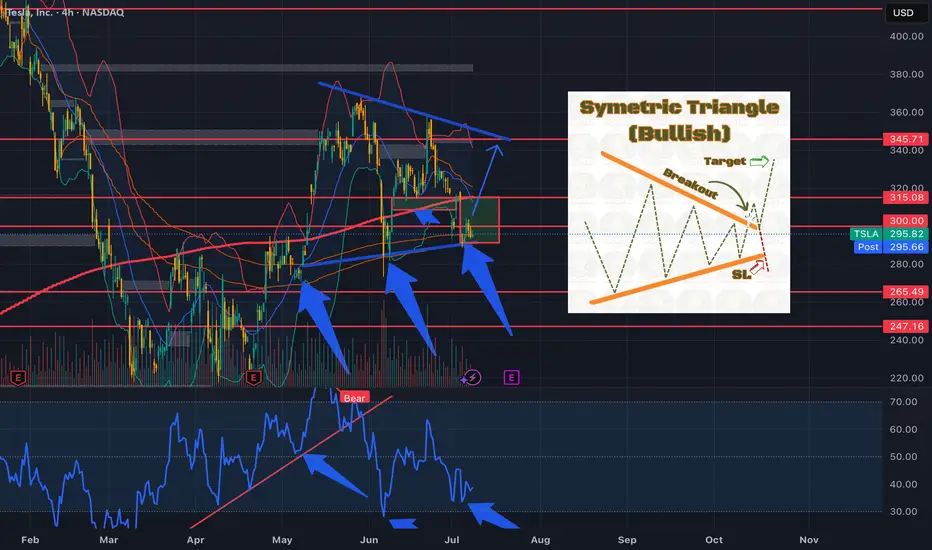
TSLA....Symetric Triangle....Earnings Rally?Could we see the bulls step in and leads us into earnings?
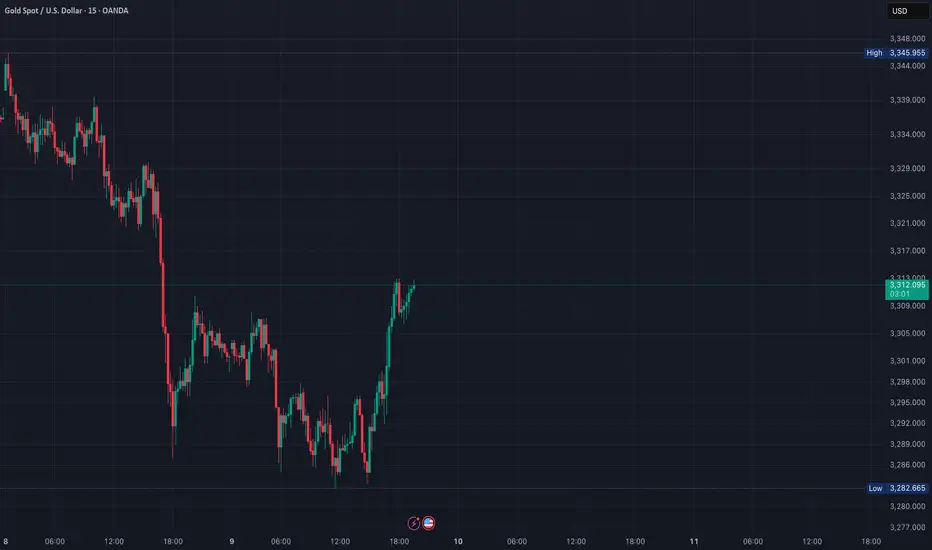
XAUUSD – Watching the 3318 Resistance for Potential Reversal
Currently monitoring Gold (XAUUSD) after a short-term bullish push toward the 3318 resistance zone. This area is significant due to:
Confluence with the upper Bollinger Band
Previous horizontal resistance level
Loss of momentum shown on MACD and other lower timeframes (15m–1h)
Price action is slowing as we approach the overbought territory. If price fails to break above 3318 and prints a clear reversal candlestick (e.g., pin bar or bearish engulfing) on the 1H chart, I’ll be looking for a short setup.
Disclaimer:This analysis reflects my personal view and is shared for educational purposes only. It does not constitute financial advice or a recommendation to enter any trade. Always do your own research and manage your risk accordingly. ⚠️
$MAN to the moon! Monthly RSI hit 30; will hit $65-75 in 60 daysNYSE:MAN has repeatedly gone up in huge ways every single time the monthly RSI has crossed below 30. We have now seen back to back months dipping below and now it’s on its way up already!
Check its history and you’ll see that typically within 2-3 months after it breaks the 30RSI it goes up 50-150% in price within just a few months! Some of those times it doubled in just 2 months.
History repeats itself and I don’t want anyone missing this one! $50 strike calls for September/December will pay handsomely. Short term grab $55 July calls for just .10-.15 each as they have earnings the day prior to the contract expiring—lots of volume on that strike also compared to all other strikes/monthly contracts.
I am going “all in” on this trade and will be buying 500 of the December $50c. I expect to more than double my position by the end of September.

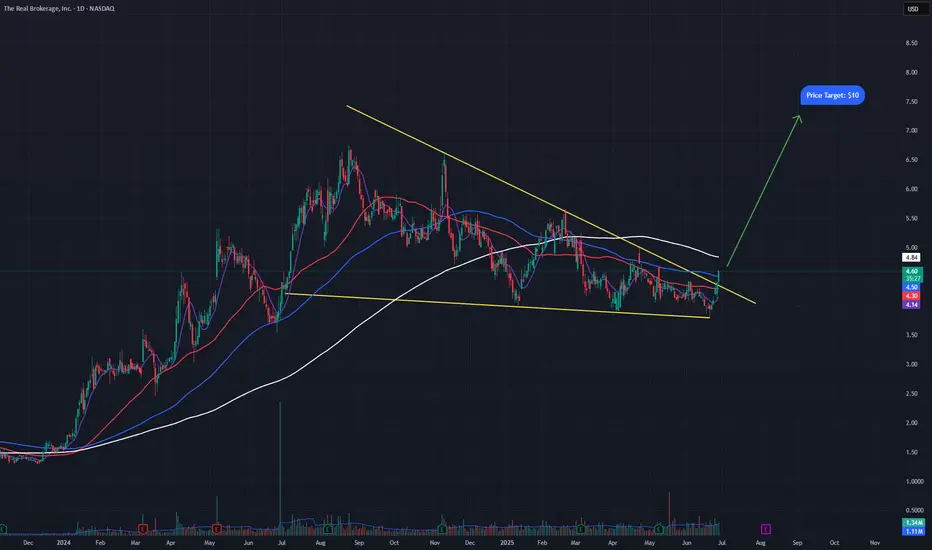
REAX breaking outREAX is a real estage brokerage company that has been in this bullish decending wedge for about a year now. It just broke out yesterday and had a push higher today, confirming the breakout. A measured move of the bull flag puts price targets on this stock around $10 a share, roughly double its current share price. It also sports a Zack's #1 buy rank and is expected to report positive earnings for the first time in company history, when it reports Q2 earnings on August 6th. If this indeed happens, the stock will push much higher, get in early before that happens.

ETH SHORT LIMIT2510–2525 SHORT
TP - 2465 / 2430
SL - 2545
The old pending order is no longer valid, easy to mistakenly touch the high short, resulting in a reverse stop loss

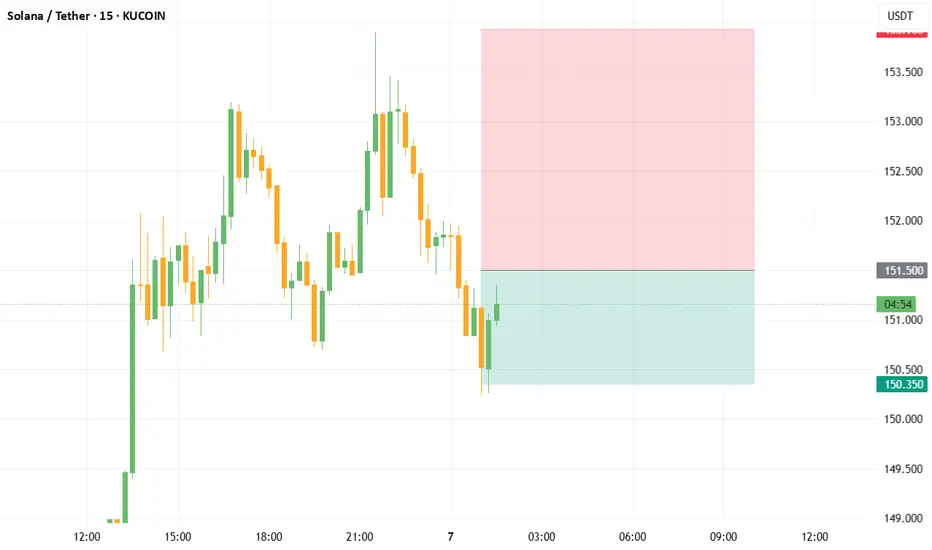
[SOLUSDT scalping short signal]- Signal: SHORT
- Entry: 151.300 ~ 151.500
- Take Profit: 150.820, 150.350
Chasing highs and lows is prohibited, so miss it;
Prohibit stop-loss operation, only to do "controlled static and dynamic resonance zone" within the transaction.
FULL MARGIN TEST ETH✅ 2. ETHUSD (Strong bias rising)
Entry: 2565 Long on retracement
Stop Loss: 2540
Take Profit: 2600
Recommended lot size: 0.20 lot (1:100)

Wait for ETH to rebound to $2528-2542 and place a short order.Short
$2528~$2542
Take Profit
$2480, $2460
Stop Loss
$2555
If the price falls below $2510, do not chase short, wait for a rebound.

BUY LIMIT - XAUUSDBUY LIMIT - XAUUSD @ 3348.00
TP: 3365.00
SL: 3341.00
No backhanding, no carrying orders, no adding to positions

BUY LIMIT - XAUUSDBUY LIMIT - XAUUSD @ 3326.00
TP: 3334.00
SL: 3321.00
Rather earn less, never more losses

Direxion Regional Banks Bull 3X Shares | DPST | Long at $84.89In anticipation of interest rates going lower, a large number of regional bank insiders are buying a significant number of shares of their own stock. Such lowering will likely increase regional bank revenue and move ETFs like AMEX:DPST higher.
Thus, at $84.89, AMEX:DPST is in a personal buy zone.
Targets:
$106.00
$120.00

XAUUSD BUY NOWXAUUSD @ 3343.00
TP: 3353.00
SL: 3338.00
Do not get attached, do not get greedy, do not buck the trend.

XAUUSD No chasing long or early manual entriesBUY LIMIT - XAUUSD @ 3328.00
TP: 3348.00
SL: 3320.00
Do not increase positions, do not carry orders, not backhanded

ECOWLD - Heading towards 52 WEEK HIGH ?ECOWLD - CURRENT PRICE : RM2.00
ECOWLD broke out a 6 month down trendline on 01 JULY 2025 with high trading volume indicating strong bullish momentum. The stock is bullish as the price is above both 50 and 200 EMAs. Furthermore the share price is near 52 Week High. RSI is above 50 and below 70 indicating stock is bullish and not considered overbought yet. Nearest target will be RM2.16 (52 Week High resistance) and then if the trend resume, it may propel higher to hit next target at RM2.28. Support level is the low of 23 JUNE 2025 candle - RM1.77.
ENTRY PRICE : RM1.99 - RM2.02
TARGET : RM2.16 and RM2.28
SUPPORT : RM1.77
Notes : On 26 JUNE 2025 the company announced its increasing QUARTERLY EARNINGS. May visit company website or TheEdge for get more information.

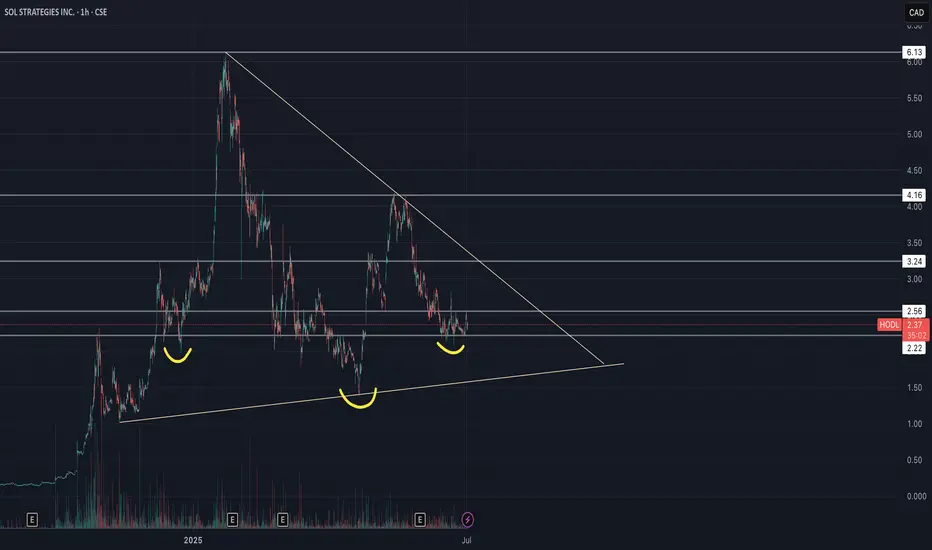
Sol Strategies Inc (HODL) - Inverse H&S🚀 SOL Strategies (HODL) – Public Market Gateway to Solana Yield
SOL Strategies (CSE: HODL) is a publicly traded company laser-focused on the Solana ecosystem. With nearly 395,000 SOL held (most of it staked) and over 3.7 million SOL delegated to their validators, they generate consistent income through staking rewards and validator commissions.
Their business model is simple:
📌 Accumulate SOL → Stake it → Run institutional-grade validators → Earn yield
📌 Expand through partnerships (3iQ, Neptune, BitGo, Pudgy Penguins)
📌 Hold strategic Solana ecosystem tokens like JTO and jitoSOL
📌 Operate with SOC 2-certified infrastructure and pursue a Nasdaq listing
SOL Strategies is not just holding crypto – they are building core infrastructure for Solana, giving equity investors direct exposure to staking economics in one of the fastest-growing blockchain networks.
📊 For traders: HODL stock offers a pure-play vehicle for Solana exposure, with an income-generating twist.
⚠️ Always do your own investment research and make your own decisions before investing.
SOLB | Descending Triangle Breakout – Targeting +34% MoveTicker: EURONEXT:SOLB (Solvay SA – Euronext Brussels)
📆 Timeframe: 4H (4-hour)
📉 Price: €31.58
📈 Pattern: Descending triangle breakout from horizontal support
📊 Breakout Probability : ~73% upward breakout (short-term triangle)
🔍 Technical Setup:
SOLB has successfully broken above a descending resistance line, bouncing off a solid horizontal support level near €28.00. This forms a bullish descending triangle breakout – a structure that historically resolves upward in short- to mid-term timeframes.
✅ Confirmed breakout from descending triangle
🟢 RSI pushing above 56 = bullish short-term momentum
📉 Defined support below = favorable risk/reward
🧠 Trade Plan:
📥 Entry Zone: €31.40–€31.70 (post-breakout confirmation)
⛔ Stop-Loss: Below €27.90 (under support base and triangle invalidation)
🎯 Upside Targets & ROIC (from €31.58):
Target Price Return
🎯 Target 1 €33.84 +7.15%
🎯 Target 2 €39.76 +25.9%
📊 Pattern Probability – Based on Bulkowski:
📐 Pattern: Descending Triangle (short-term breakout)
🔺 Upward breakout probability: ~73%
💹 Measured move confirms Target 2 if volume remains elevated
⚠️ Technical Signals to Watch:
🔎 Strong green candle breaking the triangle → initial confirmation
✅ RSI breakout with no bearish divergence = supports continuation
📈 Volume spike = buyer interest returning
💬 Solvay’s breakout is a classic textbook move off strong horizontal support.
This is a high-probability swing setup with tight risk and excellent upside potential.
#SOLB #BreakoutSetup #DescendingTriangle #TechnicalPattern #SwingTrade #TargetTraders

XAUUSD SELLSELL LIMIT - XAUUSD @ 3345.00
TP 3325.00
SL 3352.00
Today's direction: gold XAUUSD short mainly

MVST - Bearish Head & Shoulders Breakdown Targeting $2.25–$2.75A classic Head and Shoulders pattern has formed on MVST's daily chart, with a clear neckline break to the downside. This technical setup suggests bearish momentum in the short term, with a likely price target between $2.25 and $2.75.
This zone also aligns with a prior consolidation area and dynamic support. I expect the stock to potentially find a bottom in this area. If MVST can deliver strong Q2 earnings in August, a bullish reversal from that demand zone could follow.

JELD-WEN Holdings | JELD | Long at $4.02JELD-WEN Holdings NYSE:JELD designs, manufactures, and sells wood, metal, and composite materials doors, windows, and related building products in North America and Europe. The stock has taken quite a beating since the rise in interest rates, and I think a reversal *may* be in sight in the next year as rates are slowly lowered - even if the market is forward-thinking and purely anticipating a new housing boom (which I highly doubt given the current home prices). Regardless, there is risk with this stock since it has relatively high debt (debt-to-equity of 2.61x). A Quick Ratio of 1.1 and Altman's Z Score of 1.9 puts NYSE:JELD near a medium level of bankruptcy risk. The company has pretty good cash reserves and a forward P/E of 10x (current is negative), so growth is anticipated. Book value of $5.31.
A bear case here is a terrible earnings call in August 2025 due to the housing market slowing (i.e. people pausing home purchases/builds/repairs expecting interest rates to drop soon). That may plummet the stock near $1.00 or below, which would be a tremendous deal, *unless* the company fundamentals change (like bankruptcy).
Without a crystal ball, yet understanding the forward-thinking aspects of the market, NYSE:JELD is in a personal buy-zone at $4.02 with some risks.
Targets into 2027:
$5.40 (+34.3%)
$8.50 (+111.4%)
