Earnings


HYPE/USDT 15-minute high win scalping signals are as follows- Signal: LONG
- Entry: 38.48 ~ 38.60
- Take Profit: 38.92, 39.18

BTC/USDT high win scalping signals in 15 minutes are as follows- Signal: SHORT
- Admission: 107,480 ~ 107,620
- Take Profit: 107,100, 106,860


SOL/USDT 15-minute high win scalping signals are as follows:- Signal: LONG
- Entry: 147.800 ~ 148.400
- Take Profit: 149.800, 151.300

ETH/USDT High winning scalping signals in 15 minutes are as foll- Signal: LONG
- Admission: 2,436 ~ 2,442
- Take Profit: 2,462, 2,478

HYPE/USDT 15-minute high win scalping signals are as follows- Signal: LONG
- Entry: 37.260 ~ 37.360
- Take Profit: 37.680, 37.980

BTC/USDT high win scalping signals in 15 minutes are as follows- Signal: LONG
- Admission: 107,260 ~ 107,340
- Take Profit: 107,620, 107,880

BANCOINDIA - Earnings Gap up (EP)
- Strong prior buying force
- Narrow range consolidation near ATH
- Volume dry up
- Small SL , High R:R

BTC.D ANALYSIS BTC.D – Daily Chart Analysis 🧠
Bitcoin dominance is forming a rising wedge pattern – a typically bearish structure.
We’re now at the upper resistance; a rejection here could trigger a strong move down, opening the path toward 56–57% levels.
If confirmed, altcoins might get temporary relief.
Watch for a break of the lower trendline for confirmation.
Not financial advice – DYOR

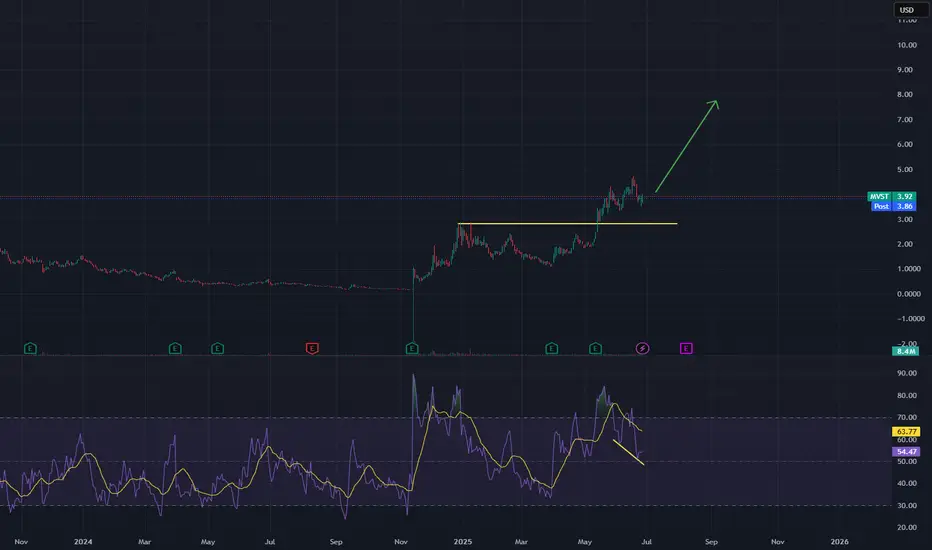
Microvast setting new 3-year highsMicrovast beat earnings in May of this year and reported positive earnings for the first time, shocking investors and sending the stock soaring above its previous resistance highlighted by the yellow trendline. As you can see it has been forming bullish consolidation above the trendline which now is seeming to act as support. There is also hidden bullish divergence on the RSI which I've highlighted. Great time to get into a really cheap stock that has much more upside to go should they continue to report positive earnings.
XRP Price Finds Some Relief — But Headwinds Remain,Says ArtavionAfter slipping below $0.50 last week, XRP has rebounded modestly, now trading above $0.52. While this short-term recovery provides relief for holders, fundamental and structural challenges still limit the token’s upside potential, according to analysts at Artavion.
The recent bounce appears largely technical. Support held near $0.48, and with Bitcoin regaining strength above $66,000, sentiment across altcoins briefly improved. XRP’s Relative Strength Index (RSI) has moved out of oversold territory, suggesting some room for additional upside — but resistance between $0.56 and $0.60 remains firm. Low trading volume suggests the rally lacks conviction.
A major ongoing concern remains XRP’s legal battle with the U.S. Securities and Exchange Commission (SEC). Although Ripple Labs scored partial wins, the case is unresolved. Until a final judgment or settlement is reached, institutional investors will likely remain cautious, and U.S.-based platforms will continue restricting XRP exposure.
🗨️ “The legal cloud hasn’t lifted — and that limits capital inflows,” says a regulatory analyst at Artavion.
From a network perspective, XRP Ledger remains functional and Ripple’s payment infrastructure is active, particularly in select cross-border corridors. However, XRP still lacks integration with key crypto sectors like DeFi, NFTs, and gaming, which restricts organic demand and developer activity.
Externally, macro conditions are neutral to negative for altcoins. The Federal Reserve’s rate outlook and rising bond yields continue to pressure speculative assets. Stablecoin inflows into XRP trading pairs have slowed — another signal of fading short-term appetite.
Outlook
At Artavion, we believe XRP is currently locked in a range-bound pattern. A breakout above $0.60 is unlikely without:
Full legal clarity in the U.S.;
Stronger altcoin sentiment market-wide;
Renewed ecosystem development and integrations.
🗨️ “XRP isn’t broken — it’s waiting,” says the Artavion market desk. “But without a catalyst, it stays reactive — not directional.”

Bearish Alert: SOL Short Setup You Can’t Ignore🔻 60-min Bearish Signal on SOL/USDT
🎯 Entry: 130.50–128.80
📉 Targets: 123.40 & 118.20
🧠 Clean confluence setup — no indicators, just pure price timing.
⚠️ For educational purposes only.


My system.Hi followers, I have kept my system a secret because i have been struggling for 3 years now i am at my 5th year and it has been working well, i will be launching a course to teach it, this is a no Indicator system, no trendline, simple rules to follow majority of the works come from the mental side.


Wayfair | W | Long at $34.62Wayfair $NYSE:W. Recession fears are valid. But long-term, once this company becomes truly profitable, this will be a multi-bagger. I won't go on much about the fundamentals because there are too many economic unknowns ahead, but from a technical analysis perspective, the historical simple moving average lines/area is repeatedly converging with the price and leveling out. Often, this means a change in directional momentum. There are no more open price gaps below the current price on the daily chart. Thus, at $34.62, NYSE:W is in a personal buy zone.
Note: The price entering the teens in the near-term is a possibility.
Targets:
$40.00
$50.00

#Cochinshipyard - Expecting 30% move from here on Stock is making higher highs
Bullish market structure 💥💥
