As we approach new highs, what's the bear case?Historically, a rebound of this magnitude has almost always indicated that the bear market is over and that we've entered a new bull market. And there's plenty of reason to be optimistic right now. With the US dollar down, US manufacturing numbers have been coming in above expectations (PMI of 49 in July, vs. 46.7 estimate). Consumer confidence and home prices were also stronger than expected this week. The liquidity crisis for regional banks seems to have resolved itself, and the uptick in continuing jobless claims (USCJC) seems to have stabilized, at least for now. The ECRI weekly leading index is forecasting positive US growth. Yesterday, the Fed said it's no longer forecasting a recession. Preliminarily, it kinda seems like the magnitude of stimulus and interest rate hikes were in the right ballpark to actually stick a soft landing this cycle (with a big assist from the AI productivity boom).
But as the market pushes toward new highs, let's consider what might be the bear case. Because markets love to surprise, and I do think there are some worrying signs.
1. Inflation could come roaring back, forcing the Fed to keep interest rates high.
A few weeks ago, interest rate futures were forecasting a 99% probability that rates would be lower by this time next year. But now it's only 87%, with a 2% chance that rates will actually be higher next July. Why are rate futures getting more hawkish? Basically because housing costs have been slow to correct and commodities prices have been climbing since May, which points to the possibility that inflation may continue to run hot.
Why might housing prices and commodities stay hot? Well, for housing, it's basically because there's a shortage . We've got more real estate agents than houses for sale, by a wide margin. I do think housing prices will gradually come down, but it may take quite a while to normalize without a supply-side fix.
And for commodities? Well, there are basically two problems.
First, geopolitics are extremely ugly right now. You've got active insurgencies in huge swaths of Africa and the Middle East, and you've got Russia threatening to blockade food shipments on the Black Sea. That all drives commodity prices up.
And second, you've got a six-sigma temperature anomaly that's destroying crops. Global warming seems to be running ahead of forecasts, which raises the worrying possibility that we've hit some kind of climate change tipping point and the North Atlantic Current might collapse sooner rather than later. That would be not only very inflationary for food prices, but also very bearish for equities in Europe and the US. Something to keep an eye on, for sure.
2. Expectations may be too high, especially for tech.
Investors have been throwing money at tech companies because of the AI boom, on the assumption that these companies will be the main beneficiaries of it. But the reality, in my opinion, is that AI greatly erodes the value of their intellectual properties. For instance, ChatGPT has dramatically reduced the cost for me spin up a competitor product or even an open-source version of any major enterprise SaaS. The big software firms are going to have to throw a lot of money and people at AI in order to keep their edge. So far, only Microsoft is doing a really good job.
And what about semiconductors? The AI boom is good for semis, because all that AI requires a lot of GPUs. But you know what? With rapid advances in the field, the compute demands have come down a lot . I can train a LLaMa model on a Colab notebook now, which is insane. Meanwhile, there's a semiconductor inventory glut on a scale not seen since 2001. Chips have been an extremely good bet for decades, and investors have rightly thrown a lot of money at them. But it's possible that we may now be late-cycle for the industry.
Overall, I think the expectations for the S&P 500, and especially for Big Tech, may just be too high. We've got P/E above 26 at a time when profit margins are in a slide. My models point to a P/E in the 21–23 range as more appropriate for the current rates of interest and inflation. So it may be that there's not much room left for multiple expansion to lift the market higher here, so productivity gains will have to do a lot of work.
3. Liquidity remains a concern.
In addition to raising interest rates, the Fed is continuing to shrink its balance sheet. Liquidity from the Fed has driven a lot of the market gains over the last decade, so a shrinking balance sheet is a headwind for stocks. There's also some reason to think consumers and small businesses have some cash flow issues right now. Last month, the Fed published a report showing an unusually high level of commercial financial distress. Auto loan delinquencies also hit a high last month. As long as money and jobs don't get any tighter than they already are, we probably won't see anything break. But if inflation rises again and we see more interest rate hikes, then there may still be some systemic risk.
Conclusion
I'm definitely not betting on a major bear market here. But this close to a major resistance level, it's worth looking parking some money in cash or bonds or putting on a hedge. S&P 500 puts are somewhat cheap right now, so it's not a terrible time to buy protection. And long-term bonds are on the cheap end of the range they've been trading in since last November, so it's also not a terrible time to put on bonds. I'm basically just thinking in terms of modest rotation and rebalancing here.
Earnings

Coal Stocks Moving. NYSE:AMR and NYSE:CEIX are leading the coal move.
NYSE:CEIX is the preferred one to get in as it has superior earnings.
NYSE:AMR
Reasoning
Whole Industry is moving!
Consolidation seems done
Correction is not overextended
Good Relative Strength
Great earnings
RSI tested bullish range multiple times
Multiple Bullish Days
Always try to use 2 timeframes
My Would Be Trade Plan
- Try to get into 3 stocks in the sector that are moving. You MUST enter the leading stock NYSE:CEIX because the leading stock always moves 50% more than the second stock in sector
- Initially risk 0.75% and then double position once stock moves 5% in your favour. (1.5% position)
- If Position moves 20% in less than 15 bars, sell at 7ATR from initial buy ELSE Sell at 4ATR from initial buy
- Raise stop to entry when stock is 10% in your favour
Main Sources of My Knowledge
Mark Minervini
Constance Brown
William O'neil
Speakers on Trader Lion Youtube
Adam Khoo
My Indicators
14 Period RSI.
9SMA and 45EMA Moving Averages added
Composite by Constance Brown
This is for catching failures in the RSI.
The RSI is a bounded indicator so sometimes fails to catch divergences. This indicator helps show that
Composite Settings
Author : Constance Brown (Connie Brown)
RSI Length : 14
RSI Momentum Length : 9
SMA Length : 3
Fast Simple Moving Average : 13
Slow Exponential Moving Average : 33

NAS100 Long Pivot: 15320.00
Our preference:
long positions above 15320.00 with targets at 15600.00 & 15790.00 in extension.
Alternative scenario:
below 15320.00 look for further downside with 15140.00 & 14970.00 as targets.
Comment:
the next resistances are at 15600.00 and then at 15790.00.

USOIL LONGOil was analyzed on large frames, and we waited for the daily trend break, to reach $92
BY: ASO ALWAN


NIO - are the fundamentals good enough?Analysts have adjusted earnings estimates and thus, an earnings beat does not always translate to good prospects for some of the businesses:
Earnings Estimate Management
From the earnings forecast by Investing above, we can note the following:
The coming EPS forecast (for the period ending 06/2023) is worse than the previous period ending 03/2023.
In fact, the EPS forecast is expected to be the worst at record -2.96 since 06/2022.
For the revenue forecast, it is expected to be lower than the previous quarter. It stands at 9.16B compared to the forecast of 11.93B from the previous quarter ending 03/2023.
This is in fact the lowest revenue forecast since 06/2022.
In the event that NIO beats both EPS & revenue forecast in the coming earnings, is the company doing better? In my opinion, it is a “NO”.
Beating such an estimate is not something to brag about as the company remains unprofitable with “falling” sales. It can be too early to call this a falling trend but the quarterly signs are there.
Conclusion
Before we embrace any content from news agencies or investing portals, let us do our due diligence.
One quarter does not define a trend and thus, looking at the business as a whole from afar can help to put some objectivity and remove the impact of seasonality. This will help to put things in a better context as we even out peaks from new launches and service offerings.

AFFIRM - is this still a good buy?
CNBC has reported recently the surge of AFFIRM shares after better-than-expected results as per the screenshot above.
AFFIRM (a buy now pay later business) has published some exciting highlights.
Let us look at their GAAP and non-GAAP reconciliation in detail:
AFFIRM makes a profit in the most recent quarter by using non-GAAP measurements. Using the whole year results ending 30 June 2023, total revenue is $1.587B and total operating costs are $2.788B, representing an operating loss of $1.2B.
Yet through the lens of non-GAAP, the last quarter was profitable with $14.7M because non-GAAP does not include the costs of depreciation & amortization, stock-based compensation, enterprise warrant, restructuring and other costs. Going forward, I recommend all to focus more on the GAAP figures as that gives a better view of the financials. Creative accounting and business narratives can distract us from having a realistic view of the business.
The need to probe further into the financials is necessary so that we can better appreciate the financial fundamentals of the business. After 1 year, AFFIRM suffered a loss of $1.2B, compared to the loss of $0.866B from the same period a year ago.
Conclusion
Let us perform the due diligence necessary so that we can filter out great companies. It is possible that some of the media focus on certain good parts and omit other “necessary” portions.
No one should care more about our money than ourselves. The due diligence will be the leverage we have. Should the price plunge, this will give us the confidence to hold or buy even more.
Without good fundamentals, I recommend staying away.
NASDAQ:AFRM

FL fall on earnings miss looking for a retracementFL on the 15-minute chart has indicators showing bullish divergence after the
big drop on the earnings miss. The volume profile shows heavy trading volumes at the
15.60 level. I am looking for a long trade to the mid-fib level of $20.00. I will set
a buy stop at $ 15.60 for when price crosses over the PCO line of the volume profile
for a trade anticipated profit of about 4.5 % with a much lower risk.

Oder Block Strategy For ScalpingOder Block Is basically liquidity that market take it from it and then It go ahead

GNS Consolidated and Resting from Big Move LONGOn the 30-minute chart, I see GNS as a Bullish Pennant on a high flag pole
in the big move yesterday with consolidation now. It is high in the VWAP
bands and so at risk for a reversal to the mean. Pennants more often than not continue
upside. To hedge, I have set two lines. If the price goes over the green line a
buy stop long will trigger into a market price. If the price drops below the pennant
height, a sell stop will trigger the short trade. One trade is on the other will not execute.
Ask if you want my suggestion as to stop losses and targets.
(EDIT - On the chart it is a flagpole not a flap pole !)

MRVL fell after earnings beat & recovery REVERSALMRVL a technology stock beholden to the ebbs and tides of both the general markets
and the leaders of the tech sector fell on a mild earnings beat this is to say traders were
disappointed and responded with a 16% sell off from the pre-earnings run up.
I see MRVL potentially suitable for a retracement of half of the 16%. On the 30- minute
chart using both pivots as well as near and intermediate volume profiles I have marked
out important levels upside from the current market. Accordinly, there are three targets
I will close 50% of the position at the first 30% at the second and the remaining 20% at the
third. I see this as an 8-10% overall profit in a swing trade of about a week duration. If
the tech sector recovers next week from this current week, the profit could well be higher.

DLTR drops after earnings follows the market down DLTR dropped on a mild earnings beat. It is now below a volume shelf at 128.
Indicators including the MACD suggest a reversal as bullish divergence is showing.
The mass index supports a reversal. On the dual time frame RSI, the low TF green line
is above the higher TF black line which is weaker. Overall, DLTR could retrace to 133
based on the Fib retracement tool However, I will not take this trade until price crosses
above the POC line. !33 will be the first target and 134.5 the second target being the mean
VWAP. I will take a call on options trade as well. I will only enter if the general market indices
appear to be upgoing which is a challenge given the upcoming Powell speech at Jackson Hole
If the market is down turning, the trade will be paused and reassessed at early next week.

WOOF dropped after an earnings beat now setup REVERSALOPRA on the 30-minute chart dropped after an earnings beat as apparently a lot of traders
expected better. The volume profile shows the vast majority of the trading occurred in
the 5.05 to 5.25 range. This heavy accumulation should result in price movement in due
time per Wycoff. I believe that a long trade is setup for a Fibonacci retracement of the
drop into the middle levels and so 5.85 as shown by the indicator on the chart. The mass index
indicator reached the reversal zone and then triggered with a drop below it confirming
a probable reversal. The MACD is showing bullish divergence.
I will place a buy stop order above the POC line of the volume profile with a stop loss at 12.0
just below the POC line is a safe 10-13% trade which may take into the beginning of next
week. I will take call option contracts as well. If you want to know the details of those,
please leave a comment.

S&P 500 Head & Shoulders on the DailyThe SPY (S&P 500 Index) resembles a quite clear Head & Shoulders Pattern which is generally bearish. The daily candle chart shows a right shoulder forming with a rejection from the $445 area. With this rejection and a continuation downwards, we could see a harder fall if this aligns with the left shoulder and follows the pattern.
The other main indices also follow a similar pattern formation and could follow with a market downturn. Watching that $445 level is key to see a confirmation retest and rejection downwards. Following the lower levels, some price targets would first be the neckline as shown on the chart posted. A break below the neckline could result in a fall of the S&P 500 and if following the complete Head & Shoulders we could be seeing a realistic price target of the $410-$420 area.
Other than technicals fundamentals are definitely quite alright for the market as of now. But maybe a little too alright in my opinion. We have seen a market melt up with interest rates still sky-high resulting in more risk-ON investing rather than investing in CD's or Treasuries offering up to 5.5%.
The Greed being shown in this market is definitely visible and is something to keep note of if we break the neckline. Fear & Panic Selling could most definitely occur in this type of situation especially considering the market rally we've seen this summer.
Seasonally the fall has been quite bearish for the markets overall, and as we head into September & October we could see a similar trend to the past, but nothing is sure.
Lastly, in September / October Student Loan Repayments are resuming which could suck out millions if not billions of dollars from the United States economy as young adults chip away at debt and sacrifice spending on goods & services. This will most definitely be a crucial effect on the economy and could send markets downwards.
Keep an eye out for this pattern to play out... Definitely something to watch as we move in to Fall!
Thanks

Pagseguro Set to Report: Analysts Eye $13 PT Amid Strong GrowthNYSE:PAGS Pagseguro reports post-bell. Analysts' PT ranges $9-$17, mean $13. ROE at 13%, EPS 10% with 7.5% YoY growth. Q1 revenue of $3.5B and net income of $369M, up 9% and 5% YoY, respectively. Weekly chart shows potential falling wedge / double bottom.

NVDA 500 - 540 still in play by 8/25They say the Trend is your friend until the end! This amazing trendline has another 2 days to go before Earnings on Wednesday 8/25 after hours.
Ibelieve if you have 2 positions currently to the upside, take profit before earnings and play one for fun.
NVDA will have to blow away earnings again to get us a massive boost to $600 which I still think is very possible! But if we fall we will fall to about 320 - 350 over time to fill the gap.
But who knows it may never happen! I am more bullish than bearish in this case because of massive FOMO in this stock but whether you are long or short remember to take profits and if you are playing earnings, play with money you can afford to lose.
GLTA!

NVDA ER: Back under $400Huge amount of buy side liquidity flooded into the market today. I think it has to go somewhere and being as we're revisiting the .78 level on our fibs, I really like downside here. AMD also formed equal highs earlier today (not shown) which makes me think there's a short opportunity tomorrow or Wednesday into the remainder of the week. Chips should be very interesting.

NVDA Earnings Outlook:High Premium, Potential Post-Earnings DropNASDAQ:NVDA trades at a premium, with a P/E ratio of 277, towering over the sector median P/E of 25.56 and the S&P 500's P/E of 24.50. Its EV/EBIT is also remarkably high at 207.38 against the sector median of 19.45, signaling significant market sentiment.
The options market's pricing in a potential $50 move,trading well above recommended levels 50-day EMA, suggesting that it might be overbought. While there may be a continued run-up leading to earnings, a post-earnings drop is anticipated. Target levels post-earnings could be $433, $419, and $400. Play the run-up but be cautious to sell the news.

ETON Biotech Big Earning Beat Pullback LONGETON jumped on a big earnings report a week ago. This small cap biotechology
company is making big money and traders responded. It has now experienced
a standard 0.5 Fib level retracement pullback and traders early in the jump
take profit. At this level new buyers have equilibrated with those selling their
shares and taking profit. The ZL MACD lines are ready to cross bearly under the
histogram whose negative/ red amplitude is reverting toward the zero line.
The lines of the dual time frame RS indicator have held above the 50 level.
In consideration of this healthy pullback and buying /selling pressure equilibrium
I will take a long trade looking for 15-20% upside considering also the uprising
fundamentals of the stock based on the big earnings beat.

$HIMS - Watch out belowNYSE:HIMS - the recent double beat and guidance raise has not helped out this stock. There is a gap fill dating back to November of 2022 with hardly any strong support zones in sight. The death cross which just occurred should add further downward pressure to this already beaten up stock. I will turn long on NYSE:HIMS once the first level of support is reached (around $6.20). I will add on the way down as the stock approaches the gap fill. The increased guidance and double beat proves this may be a long-term winner, however, in the short-term there is more room to fall.

DE falling into undervalued territory / Favorable Earnings LONGDE on the 4H chart is now setup for a long trade. It is now positioned just above a long term
anchored VWAP to which a stop loss can be set just below @ 390. DE was falling before
favorable earnings and has not yet reversed. I see this as an opportunity to trade an
industrial blue chip taking entry well below fair value and so a bargain.
I will get a mixture of a handfulof stock shares and a single option 4 months to expiration. The
target is selected to be 445 at the upper Bollinger bands confluent with the second deviation
line of the anchored VWAP. This is about 13% upside- while the option's profit potential is
substantially higher. If you would like to know the details of the call option leave a comment. (
if this idea is of interest considering liking and following :)

Empowering Financially Deprived Female Traders: A Letter of Hope
Introduction
Dear Fellow Trader,
I hope this letter finds you in good health and spirits, despite the challenges you might be facing on your journey as a financially deprived female trader. I want you to know that you are not alone in this struggle, and your determination to navigate the world of trading is truly inspiring. In this letter, I aim to offer you guidance, support, and practical insights to help you overcome the hurdles and seize opportunities in the trading landscape.
Acknowledging Your Strength
First and foremost, let me commend your courage. Being a female trader in a field traditionally dominated by men is an accomplishment in itself. Your presence challenges stereotypes and contributes to the diversification of the trading world. Embrace your uniqueness and the fresh perspectives you bring to the table.
The Power of Education
Education is your greatest asset. In a rapidly evolving market, staying updated with the latest trends, tools, and strategies is crucial. Fortunately, the digital age has made education more accessible than ever. Take advantage of online courses, webinars, and educational resources tailored to traders of all experience levels. Knowledge will empower you to make informed decisions and minimize risks.
Building a Support Network
Surround yourself with like-minded individuals who understand your journey. Join trading communities, both online and offline, where you can exchange ideas, seek advice, and share experiences. A strong support network can provide emotional encouragement, practical insights, and valuable connections that can significantly boost your trading career.
Setting Realistic Goals
Dream big, but ground your aspirations in reality. Set achievable short-term and long-term goals that reflect your financial situation, risk tolerance, and market knowledge. Tracking your progress against these goals will help you stay focused and motivated, even during challenging times.
Mastering Risk Management
One of the most critical aspects of trading is managing risk effectively. Protecting your capital should be your top priority. Never invest more than you can afford to lose, and diversify your portfolio to spread risk. Utilize stop-loss orders and position sizing techniques to limit potential losses while allowing room for gains.
Leveraging Technology
Technology has revolutionized trading, leveling the playing field for traders of all backgrounds. Make use of trading platforms, analytical tools, and algorithms to enhance your decision-making process. Automated trading systems can help execute trades even when you’re not actively monitoring the market.
Embracing Resilience
Financial markets are inherently volatile, and losses are a part of the game. What sets successful traders apart is their ability to bounce back from setbacks. Develop resilience by learning from your mistakes, analyzing your failures, and adapting your strategies accordingly. Remember that every loss is a lesson that brings you closer to success.
Continuous Adaptation
Adaptability is key to survival in the trading world. Market conditions change, and strategies that worked before might not be effective today. Stay flexible and open-minded, willing to adjust your approach based on new information and evolving trends.
Seeking Mentorship
Mentorship can provide invaluable guidance based on the firsthand experiences of seasoned traders. Finding a mentor who understands your challenges and aspirations can accelerate your learning curve and help you avoid common pitfalls. Their insights can be a beacon of light during uncertain times.
Navigating Bias and Discrimination
Unfortunately, bias and discrimination still persist in the trading world. As a female trader, you might encounter skepticism or condescension from some quarters. Use these experiences as fuel to prove your capabilities. Let your performance speak louder than any prejudices.
Conclusion
In closing, dear trader, remember that your journey is a testament to your strength, resilience, and determination. The financial struggles you face today do not define your future. With the right knowledge, mindset, and support, you can overcome challenges and achieve success beyond your wildest dreams. Embrace each day as an opportunity to grow, learn, and thrive in the world of trading.
Stay focused, stay hungry, and never lose sight of your potential.
Sincerely,
A Supportive Fellow Trader

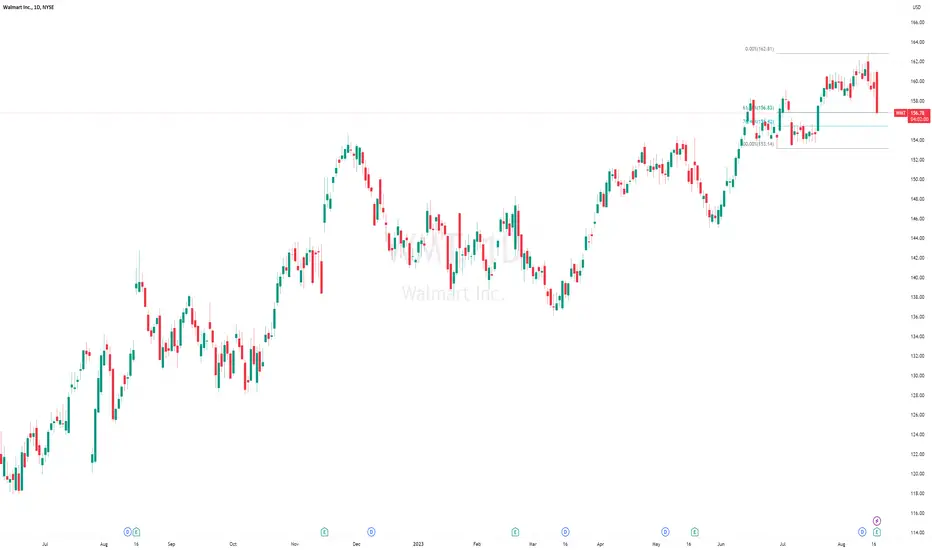
Walmart reports bumper earnings, but prices heads lowerWalmart has managed to beat expectations across the board today, with the retailer clearly managing to fare well despite concerns over the potential for an economic slowdown. Compared with Bloomberg numbers, the company has managed to outperform across a host of metrics:
Net revenue: $161.6 billion versus $159.7 billion expected
Adjusted diluted EPS: $1.84 versus $1.70 expected
US same-store sales growth: 6.3% versus 4.04% expected
Sam's Club US stores growth: 5.5% versus $5.58 expected
Walmart US same-store sales growth: 6.40% versus 4.29% expected
Traffic growth: 2.90% versus 1.63% expected
Ticket growth: 3.40% versus 2.00% expected
E-commerce growth: 2.30% versus 1.54% expected
Gross margin: 23.38% versus 23.55% expected
Inventory growth: -5.34% versus -5.54% expected
However, this has done little to help the stock, with price falling back in early trade. Nonetheless, the bullish trend seen over the course of the past two-years does bring confidence that the bulls are going to come back into the fold once again here. As such, watch for a potential bullish reversal for Walmart, with a decline through $153.14 support required to negate that bullish trend.