TMGH Trend Line Rebound AnalysisTMG Holding trend is still in a downward zone, but rebounded at the support line 52.019. In case of a rise, it is expected to breach the resistance line 52.472 and reach the resistance line at 52.805 points. In case of falling, it's expected to break the 1st support line at 51.535 points, then the second support line at 51.475, then the third line at 50.779, which is fundamentally not a preferable expectation because of the Omani Ministry of Housing and Urban Planning signing a $4.7 Bln real estate deal with TMGH. For developing two real estate projects spanning 4.9 million square meters, to deliver around 12.9 thousand residential units. In addition, the combined sale value of units is projected at $4.7 billion.
Earnings

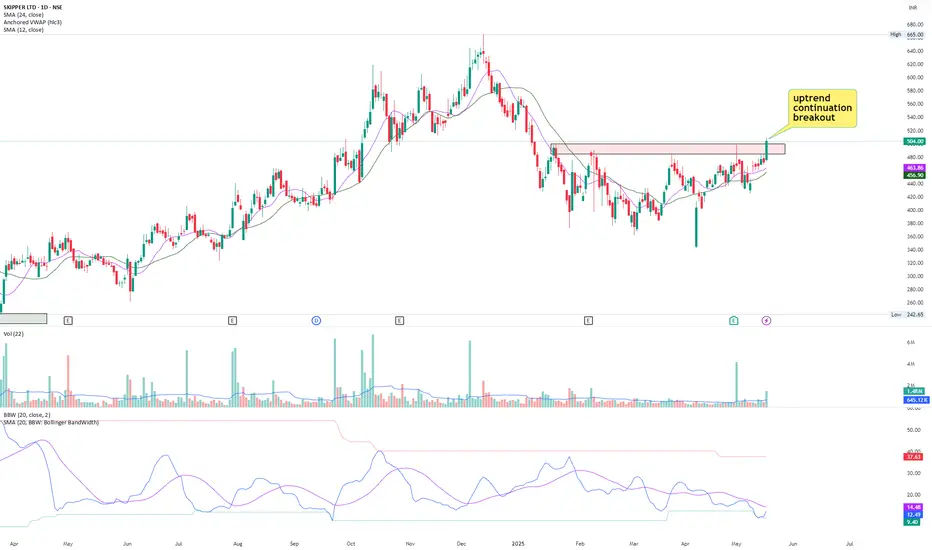
Breakout in SkipperStock has broken out of range of 4 months in long term uptrend with high relative volume.
Fundamentally, stock has delivered double digit earnings growth for straight 4 quarters.
Margins have also been increasing for last 3 quarters.
Overall, it's a good technofunda pick to watch out for.
TSM great potential before earnings call? Value to be collected!Hi guys we would be taking a look into our analysis for TSM!TSMC (TSM) Stock: Positioned for
Strong Growth Despite Tariff Pressures -
Taiwan Semiconductor Manufacturing Company (TSMC), the world’s leading contract chipmaker, continues to shine as a long-term winner in the semiconductor space, even amid renewed trade tensions and potential tariffs.
1. Resilience Amid Tariffs and Trade Tensions
While the U.S. has recently introduced or hinted at higher tariffs on tech-related imports from China, TSMC stands out due to its strategic positioning. As a Taiwan-based company with increasing investments in the U.S., including a major Arizona facility, TSMC is well-insulated from the harshest tariff implications. In fact, the shift toward U.S. domestic chip production could boost TSMC's presence and government support, solidifying its role in global supply chains.
2. Unmatched Technological Leadership
TSMC is years ahead of competitors in cutting-edge semiconductor manufacturing, particularly in advanced nodes like 3nm and 2nm chips. This technology edge secures high-value contracts with top-tier clients like Apple, NVIDIA, and AMD, ensuring a steady and growing revenue stream.
3. Surging Demand for AI and High-Performance Computing
With the global explosion of demand for AI infrastructure, data centers, and high-performance computing, TSMC is perfectly positioned. It is the go-to foundry for the most advanced AI chips, giving it a critical role in powering the next generation of tech innovation.
4. Strategic Global Expansion
TSMC’s global expansion—including new plants in the U.S., Japan, and Germany—reduces geopolitical risks and enhances its ability to serve major markets locally. These moves also align with government incentives and support from the CHIPS Act and similar programs.
Outlook:
TSMC is not only weathering the global trade climate—it’s thriving. Its dominant market share, world-class technology, and expanding global footprint give it a strong competitive moat. With rising AI demand and the shift toward local production, TSM is set to benefit on multiple fronts.
TSM stock remains a high-conviction play for investors looking to capture the future of tech.
TSMC has consistently delivered impressive financial results, with the company surpassing analyst expectations in the past 12 consecutive quarters. For instance, in the fourth quarter of 2024, TSMC reported earnings per share (EPS) of $2.24, exceeding the consensus estimate of $2.16. This track record underscores the company's robust operational efficiency and market demand for its advanced semiconductor solutions.
Upcoming Earnings Call
Investors are anticipating TSMC's next earnings call scheduled for Thursday, April 17, 2025, before the market opens. Analysts expect the company to report an EPS of $2.02 for the first quarter of 2025. Given TSMC's history of exceeding expectations, there is optimism that the company will continue its trend of strong financial performance.
EPS beat estimates 16 times in 17 quarters!!!!!
We are targeting approximetly 18% increase!!!
📌 Trade Plan
📈 Entry: 152
✅ Target 183
❌ SL: 128

City Group this weeks best choice from the earnings calendar!Hi guys we would take a look into our perspective for Citygroup, which out of this weeks earnings stocks gives us the best potential, we are targeting a whoping 20% increase for our end goal.
Citigroup (NYSE: C) is demonstrating strong growth potential in 2025, driven by robust earnings, strategic initiatives, and favorable market conditions. Here's our comprehensive analysis focusing on Citigroup's growth prospects:
📈 Recent Performance Highlights
Q1 2025 Earnings: Citigroup reported a 21% year-over-year increase in net income, reaching $4.1 billion ($1.96 per share), surpassing analyst expectations of $1.85 per share. Revenue rose 3% to $21.6 billion, exceeding forecasts. The growth was primarily driven by a 23% surge in stock trading revenues amid market volatility and increased client activity.
Return on Tangible Common Equity (RoTCE): The bank's RoTCE improved to 9.1%, nearing its target range of 10–11%, indicating enhanced profitability and efficient capital utilization.
📊 Growth Metrics & Analyst Outlook
Earnings Per Share (EPS) Growth: Analysts project a 15.3% annual EPS growth for Citigroup over the next five years, outpacing peers like Bank of America (9.0%) and JPMorgan Chase (3.9%).
Revenue and Earnings Growth: Citigroup is forecasted to achieve a 9.8% annual earnings growth and a 7.9% revenue growth over the next three years.
Share Repurchase Program: The bank has initiated a $20 billion share buyback program, reflecting confidence in its financial strength and commitment to returning capital to shareholders.
🚀 Strategic Initiatives & Market Position
Operational Efficiency: Citigroup is investing in technology and streamlining operations, including reducing reliance on external IT contractors and enhancing data management systems. These efforts aim to improve efficiency and regulatory compliance.
Market Leadership: The bank's diversified business model, encompassing trading, wealth management, and banking services, positions it well to capitalize on various market opportunities.
⚠️ Market Considerations
Economic Uncertainty: While Citigroup's performance is strong, broader economic uncertainties, including potential recessions and regulatory changes, could impact future growth. Analysts are monitoring these factors closely.
✅ Our Conclusion
Citigroup's robust earnings growth, strategic initiatives, and strong market position make it a compelling candidate for investors seeking growth opportunities in the financial sector. The bank's focus on operational efficiency and capital return strategies further enhances its growth prospects!
The entry would go as following -
Entry point : 63.80
Target 1 : 71.69 - just above the GAP which was previously formulated, when we pass it this would cement our uptrend formation.
Target 2 : 75.30 - finalizing almost 20% growth of the stock which would be around the strong resistance area.
Stop Loss : 55.50 - around the bottom zone , which there was a lot of volume supported by the buyers.

META - Another great earnings, allowing us to collect value?Hi guys ,we would be looking into our analysis for META stock.
Meta Platforms Inc. has demonstrated robust financial performance, underscoring its strategic investments in artificial intelligence (AI) and digital advertising.
Strong Financial Performance
In Q4 2024, Meta reported revenue of $48.39 billion, marking a 21% increase year-over-year. Net income surged by 49% to $20.84 billion, with diluted earnings per share (EPS) rising 50% to $8.02. The company's operating margin improved to 48%, up from 41% the previous year, reflecting enhanced operational efficiency.
AI-Driven Advertising Growth
Meta's advancements in AI have significantly bolstered its advertising capabilities. In Q3 2024, advertising revenue grew by 18.6% year-over-year, reaching $39.89 billion. The integration of AI technologies has enhanced ad targeting and delivery, contributing to this growth.
Our Confidence
Overall analysis maintains a bullish outlook on Meta's stock, with an average price target of approximately $634, suggesting a potential upside of around 17% from current levels. The company's strategic focus on AI and its strong financial results support this positive sentiment.
In summary, Meta's strong earnings report, driven by AI advancements and advertising growth, positions the company favorably for continued success in the evolving digital landscape.
📌 Trade Plan
📈 Entry: 550
✅ Target: 630 - below the ATH to give an achievable destination
❌ SL: 480 - below the support zone to protect the trade

First step towards ATH BULIISH FLAG on DOGE
In several time frames DOGE has formed a Bullish Flag from around $0.16 going to $0.32.
This is the first dog step to the ATH!

"MASTER OF SOCIAL REALMS, META" How Does Meta Make Money?The long-term outlook for META stock looks pretty promising. Thanks to heavy investments in AI and the metaverse, along with steady growth in its advertising business, analysts predict the stock price could climb from its current level (around $640) to anywhere between $700 and even $2,000 by 2030. AI-driven improvements in ad efficiency and growing user engagement on platforms like Facebook and Instagram are major drivers. Plus, the company’s solid financials give it plenty of room to keep investing in the future.
That said, there are risks to watch out for, like tougher regulations in Europe, increasing competition, and uncertainty around the metaverse’s success. Overall, though, META’s strong position in tech and the market makes it a solid pick for long-term investors. Just make sure to weigh those risks before jumping in.

trend and corrections(1H)As I said multiple hours ago , we saw that gold declined both in the four-hour and the one-hour charts.Now I'm gonna mention that in 1 hour chart again so if we follow the trend and correction strategy we will find an another possible correction that says and shows a sell opportunity after happened.Good luck

simple and natural :-!Dears the gold has decreased and broken the lines and has corrected now in my opinion.It's the time to get sell position.It's easy *^_^*

UnitedHealth Group | UNH | Long at $323.00UnitedHealth Group NYSE:UNH currently has a P/E near 15x, steady rising revenue (2024 = $400+ billion), EPS of 6.24x, dividend of 2.2%, and earnings are forecast to grow by 10.8% per year. The stock, however, has plummeted recently due to negative news, rising healthcare costs, CEO changes, and suspension of 2025 outlook. Every company has bumps, but I view solid companies like NYSE:UNH as pure opportunities for long-term investment - especially with America's aging population.
From a technical analysis perspective, the stock price has entered my "crash" simple moving average zone (which currently extends down near $307.00). Personally, this is the zone I am starting a position due to the odds of a future bounce from here. However, I am very aware that there is an open price gap near $265.00 that may get filled this year or early next. I could see a bounce in my crash zone to bring in the bulls and then a drop to that level to heighten the fear. That is another area I plan to grab more shares and build a strong position. But, in case it doesn't extend that low, I have started a position at $223.00, with future investments near $307.00 and below. I doubt this will be a quick turnaround stock - patience is where money is made.
Targets (into 2028):
$375.00
$475.00
$580.00

UNH and DOJ. What has ever happened? Value stock Back with another freebie for the followers. I am not getting enough love after the freebies and multibaggers I have thrown at the community.
UNH. Investigations, fraud, malpractices.
Does that change the fact that it is the biggest health insurer in the USA? People reading this might be insured with UNH.
What have investigations ever brought the USA?
A slap on the wrist, a fine and some low key employee fired. Does that change your insurance? Does that wipe out 100+ billion from UNH balance sheet? NO
A value stock for a value investor.
The Foxx announces a position of 10000 stocks of UNH @284.1 post market 19:35 on May 14 2025. Happy to average down till it goes to 1. That is conviction. Bill ackman who?
Follow the Foxx, throw some love in the comments, and ill maybe throw another bone for yall soon..

Good Entry - Earnings Sell OffGood entry here. Long term addition or swing trade. Added VZ long position

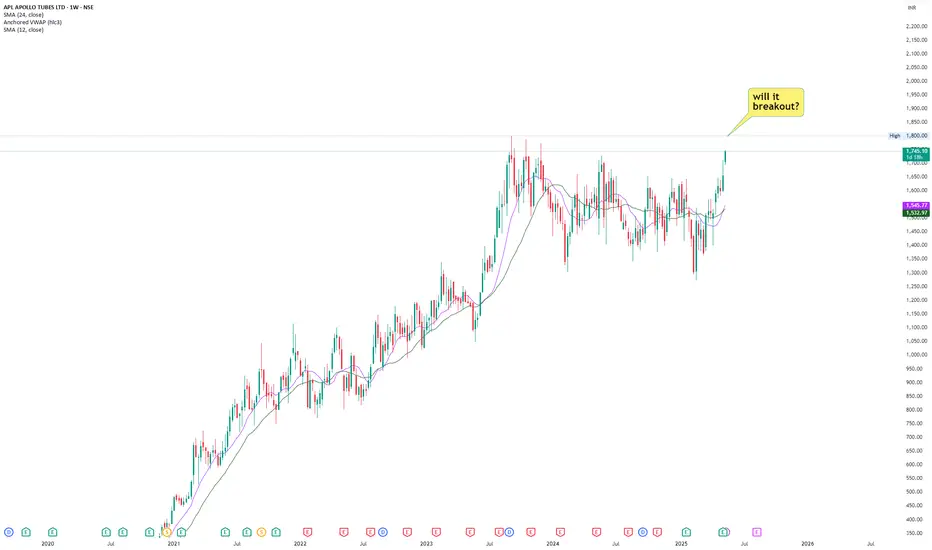
APLAPOLLO- All time high possible!!!APLAPOLLO is nearing its all time high level. Stock is nearing this level with relatively higher volume.
Stock has recorded double digit growth in last consecutive 2 quarters.
Margins have also expanded by roughly 40%.
Company has also expanded its CAPEX budget in coming years.
Overall it's a good technofunda stock to watch. Add to watchlist.
ROKU Close to Key Support After the Selloff Roku fell after its earnings report and updated guidance. Despite reporting EPS that beat expectations by 27.14%, Roku lowered its revenue guidance to $4.55 billion, down from the previous estimate of $4.61 billion. However, the sharp decline in price may present a buying opportunity for a medium-term swing trade.
Roku’s EPS is expected to turn positive in the third quarter, supported by increasing revenue in each quarter. The 12-month analyst consensus price target is $83.76, which is approximately 38% above the current price.
From a technical perspective, an ascending triangle formation appears to be developing at the bottom. While ascending triangles are typically continuation patterns, and rarely form at bottoms, it is still a positive sign for Roku. The lower line of the channel, which is near the 52 level and aligned with key horizontal support, can be viewed as solid support. As long as this support holds, an upward move toward the 200-day SMA and then to the 82.50 level is possible.

"King of Cards" How Does Visa Make Money?NYSE:V
To be honest, VISA stock is the kind of investment that really feels solid and reliable. I bought a bit of VISA a few years ago, and before I knew it, the price had climbed past $300 and I started getting those occasional dividend notifications. The dividends aren’t huge, but it’s nice to see that money coming in automatically. I can see why so many dividend investors like VISA.
VISA is, of course, the same “VISA” you see on your credit cards. Globally, they dominate the credit card market, with nearly half of the market share, and they’re among the top 10 biggest companies in the US by market cap.
These days, cashless payments have become the norm, and that trend really works in VISA’s favor. Most analysts expect VISA to keep growing steadily, with annual revenue and profit increases of around 10%. VISA has also raised its dividend every year for over 16 years, making it a classic “dividend growth” stock. The yield itself is under 1%, but the key is that the dividend keeps getting bigger.
Recently, VISA’s been expanding into new businesses too-like Visa Direct for money transfers-so they’re evolving from just a credit card company into a global payments platform. Maybe that’s why even Warren Buffett has invested in VISA.
Of course, there are risks. There’s always talk of antitrust regulation, and new fintech companies like PayPal are trying to take market share. In fact, VISA’s stock has underperformed the market a bit in the last few years. But VISA’s economic moat (the barriers that keep competitors out) is still very strong.
Looking at the current price, VISA’s P/E ratio is actually a bit lower than its five-year average, so some people think it’s undervalued right now. That’s why I think VISA is a stock you can hold in your portfolio for the long term and feel pretty comfortable about.
- VISA is the clear leader in global payments, and as we move toward a cashless society, its growth prospects look strong.
- The dividend is small but growing every year, and the stock price has trended upward over the long term.
- There are risks like regulation and fintech competition, but most still see VISA as a solid investment.
Maybe you like this Video deal with VISA
below comment!

Long ESSwing from last week, back at breakeven.
Entry with possible support at around $5650 (I entered early…)
SL below $5600-
TP $5800 and lets let 1 runner go to $6000 if AMD earnings goes well!

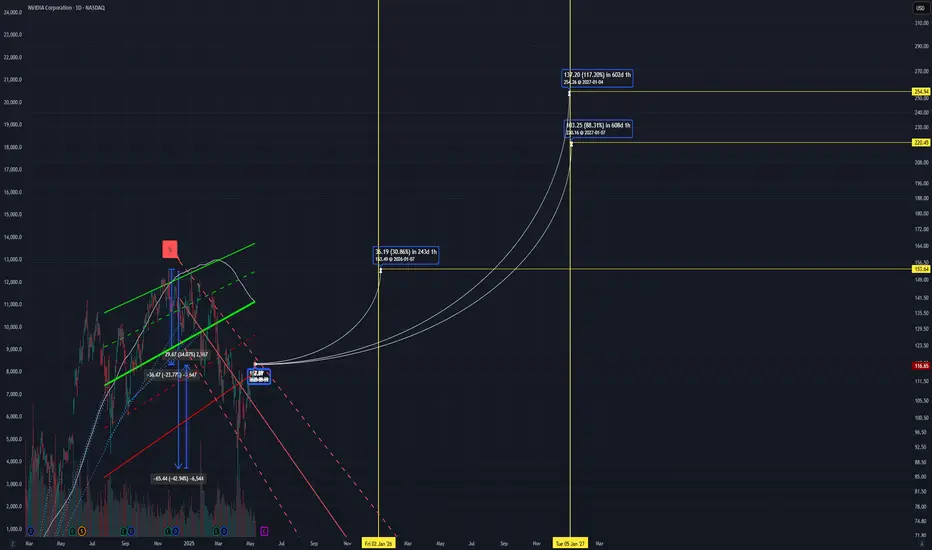
"God of AI" How does Nvidia make money?"God of AI" How does Nvidia make money?
NVIDIA is really at the center of the AI and data center boom right now. With these industries growing so quickly, it looks like NVIDIA’s sales and profits will keep going up for quite some time. Some experts even predict that by 2029, the company could be making over $300 billion just from its data center business.
What’s also impressive is how NVIDIA keeps rolling out new and better AI chips, staying ahead of the competition when it comes to technology. And they’re not just sticking to AI-they’re also moving into exciting areas like self-driving cars, the cloud, robotics, and even the metaverse. This kind of diversification gives them even mo NASDAQ:NVDA re ways to grow.
As for the stock price, most analysts seem to agree that there’s still a lot of potential for it to climb higher, even though there are some risks to watch out for-like increased competition, supply chain hiccups, or short-term market swings.
NASDAQ:NVDA
Base Case Costco 810. Total company revenues were up 6% compared to a year ago. The Profit Margin of 2.9% was better than the longer-term average of 2.5%. A 90x multiple applied to a Sales Growth Rate of 9% would imply a share price 810. Costco's narrative revolves around execution. Considering the company continues to execute and deliver top-line growth, the stock will be rewarded in some form.

WM Technology | MAPS | Long at $1.00WM Technology NASDAQ:MAPS provides ecommerce and compliance software solutions to retailers and brands in cannabis market in the United States and internationally. After it's de-SPAC in 2020, it soared to $29.50 and now can be found for around $1.00. It's been consolidating at these lows for almost two years, and it may be gaining algorithmic traction for a move soon based on my selected simple moving average (SMA). Often (but not always), when this SMA gets close to the price, there is a pop to the historical SMA. Currently, it is in a personal buy zone at $1.00.
Target #1 = $1.50
Target #2 = $2.00

HOOD daily chart: breakout or fakeout? Key zone approaching.Robinhood's stock has formed a falling wedge pattern on the daily chart, indicating a potential bullish reversal. The price has broken above the 0.618 Fibonacci level at $44.00, suggesting further upside potential. Next targets are $48.40, $52.79, $58.22, and $67.00. RSI and MACD indicators confirm bullish momentum.
Fundamental Factors:
Robinhood continues to show revenue and profit growth, supporting positive investor sentiment. The company is expanding its services and attracting new users, strengthening its market position.
Scenarios:
Main scenario: continued rise to $48.40, then to $52.79 and higher.
Alternative scenario: pullback to $39.71 with potential decline to $36.00.

ETERNAL - Eternal Ltd. (2 hours chart, NSE) - Long PositionETERNAL - Eternal Ltd. (2 hours chart, NSE) - Long Position; short-term research idea.
Risk assessment: Medium {volume structure integrity risk}
Risk/Reward ratio ~ 2.36
Current Market Price (CMP) ~ 240
Entry limit ~239 to 237 (Avg. - 238) on May 05, 2025
1. Target limit ~ 247 (+3.78%; +9 points)
2. Target limit ~ 251 (+5.46%; +13 points)
Stop order limit ~ 232.5 (-2.31%; -5.5 points)
Disclaimer: Investments in securities markets are subject to market risks. All information presented in this group is strictly for reference and personal study purposes only and is not a recommendation and/or a solicitation to act upon under any interpretation of the letter.
LEGEND:
{curly brackets} = observation notes
= important updates
(parentheses) = information details
~ tilde/approximation = variable value
-hyphen = fixed value

Arm - Positive outlook ahead of earnings - Value to collect?Hi guys we would be looking into our analysis for ARM Holdings before their earnings call!
ARM Holdings (ARM) – Positive Outlook Ahead of Earnings
ARM Holdings plc, a leading provider of semiconductor intellectual property, is poised to deliver a strong earnings report, driven by robust demand for its advanced chip architectures, continued growth in AI and data center markets, and deepening strategic partnerships across the tech ecosystem. As we approach the upcoming earnings announcement, several key factors support a bullish thesis on ARM's stock.
1. Strong Market Position and Licensing Growth
ARM continues to dominate the RISC-based processor architecture market, with its designs powering over 99% of smartphones and making significant inroads into the computing and server space. The company's royalty and licensing model provides a resilient revenue base, which has historically performed well even during industry slowdowns. Recent licensing agreements with leading tech companies, including NVIDIA, Apple, and Amazon, signal continued reliance on ARM's technology.
In Q1 2025, analysts expect double-digit year-over-year growth in licensing revenue, reflecting heightened demand for ARMv9 architecture, which powers next-generation AI and machine learning workloads. This growth is being further fueled by increased adoption in automotive and IoT sectors.
2. AI and Data Center Tailwinds
The surge in AI demand is transforming the semiconductor landscape. ARM's energy-efficient designs are increasingly being integrated into AI accelerators, edge devices, and cloud data centers. The company's Neoverse platform has been gaining traction, especially as hyperscalers seek alternatives to x86 architectures for power- and cost-efficiency. Amazon Web Services’ Graviton processors, based on ARM, are a prominent example of this trend.
As AI infrastructure spending accelerates globally, ARM stands to benefit significantly. Positive forward guidance around AI-related royalties and design wins would further validate this tailwind in the upcoming earnings report.
3. Financial Strength and Margin Expansion
Analysts anticipate revenue growth of 20-25% YoY in the upcoming report, accompanied by improved gross and operating margins. ARM’s high-margin royalty revenue stream contributes significantly to profitability, and recent cost controls have enhanced operational efficiency.
The IPO in 2023 provided a strong capital base, enabling increased R&D investment while maintaining financial flexibility. Shareholder sentiment has been buoyed by ARM's prudent capital allocation and expanding free cash flow profile.
4. Ecosystem Momentum and Strategic Partnerships
ARM’s ecosystem-first approach—collaborating with chipmakers, software developers, and system integrators—has become a key competitive advantage. The company's recent partnerships in the automotive and industrial sectors highlight growing non-smartphone revenue streams. Additionally, ARM is collaborating closely with AI chip startups and hyperscalers, reinforcing its central role in the evolving semiconductor landscape.
Investors should also watch for updates on ARM’s role in emerging verticals such as AR/VR, smart cities, and secure edge computing, all of which could significantly boost its long-term growth narrative.
5. Technical and Sentiment Indicators
From a technical standpoint, ARM stock has shown resilience, trading above key moving averages and gaining momentum in recent weeks. Options activity suggests bullish sentiment, with increased call buying ahead of earnings. If the company delivers a beat-and-raise quarter, it could catalyze a breakout to new highs.
📌 Trade Plan
📈 Entry: 121
✅ Target: 144 Below the strong resistance
❌ SL: 95 - Above the strong support

AI Prediction SOL/USD Trading Plan 24 hours!💰 May 4, 2025 8:52 pm. SOL/USD Trading Plan
Long Scenario
- Entry: Breakout above 148.50 (volume >8,000).
- Stop-Loss (SL): 145.50 (below support).
- Take-Profit (TP): 149.50 (below resistance).
- Trailing Stop: 1.5x ATR ($0.77).
- Confirmation: Supertrend (long), MACD bullish crossover, RSI >50.
Short Scenario
- Entry: Breakdown below 146.50 (volume >12,000).
- SL: 147.50 (above resistance).
- TP: 145.50 (above support).
- Trailing Stop: 1x ATR ($0.51).
- Confirmation: Supertrend flips short, MACD bearish, CMF <0.
