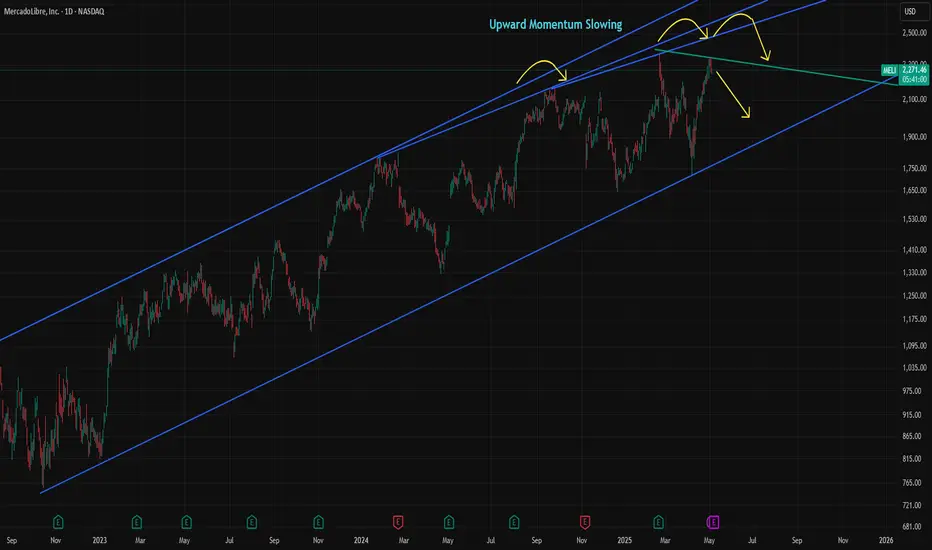
MELI at Risk from Momentum Shift and High ValuationMELI has gained over 35% since the April dip, but momentum has been fading since September. The slowdown has become increasingly visible, and last week's high may remain the top for some time unless Wednesday’s earnings report surprises the market on the upside.
The consensus estimate for MELI’s revenue is $5,497.05 million, representing a 26.86% year-over-year increase but a 9.27% decline quarter-over-quarter. MELI is currently trading at a forward P/E of 41.9x, which is significantly higher than the 19.8x average of comparable companies. Its geographic advantage over U.S.-based peers gave MELI an edge in April, but without strong earnings to support the high valuation, the stock could become vulnerable.
Over the past five years, MELI averaged 56.2% annual sales growth. That figure is expected to fall to an average of 22.1% over the next three years, which remains solid but signals a clear deceleration.
MELI could move more than 7% on earnings day, depending on the report. If the stock falls below 2,000, it may present a buying opportunity. However, the loss of momentum is usually a negative signal for sustaining trends, so the risk of buying the dip is higher than before.
Earnings
Netweb-a breakout stock to watchNetweb has recorded stellar quarterly results- double digit earnings and revenue growth YoY. But stock has not performed since market was unfavorable and it has stored pent up energy of strong earnings backing. Now stock has reached a resistance zone on daily chart that too with a humungous volume. Today its quarterly earnings were announced and yet again stock has delivered very good results. It's a good breakout stock to watch.

TMG Holding Fundamental and Chart AnalysisTMG Holding trend has recently taken an upward trend between the support line 46.873 and the resistance line 54.511, up by 0.78%. It is expected to keep rising till breaking the 1st resistance line at 54.115 and then the 2nd one at 54.423 points because of positive fundamental analysis. On one hand, the CBE's decision about cutting the interest rate by 2.25% would lead to positive impact on corporates because of the current reasons behind the economic activity, decreasing interest rate will lead to a decrease in the cost of borrowing, which will decrease the cost of production and will increase the corporates' profit and their monetary value. Accordingly, this will lower the products' price and individuals will have a higher will to diversify their investments and increase their purchasing power. On the other hand, besides the current annual advertisements about SouthMed and the summer getting closer, there is news on Reuters about an advanced stage of negotiations for a new large-scale mixed-use project in Iraq. This project is estimated to generate total sales vicinity of $17 Billion and annual recurring income exceeding $1.5 Billion.

Microsoft - Positive earnings expectation , value to collect?Hi guys we would be looking forward to our next stock analysis for Microsoft!
Microsoft Corporation continues to demonstrate robust financial performance, underpinned by its strategic investments in artificial intelligence (AI) and cloud computing. The company's strong earnings and forward-looking initiatives position it favorably for sustained growth.
In Q4 FY2024, Microsoft reported revenue of $64.7 billion, marking a 15% increase year-over-year. Net income rose to $22.0 billion, with diluted earnings per share (EPS) of $2.95, surpassing analysts' expectations of $2.90 . For the full fiscal year, revenue reached $245.1 billion, reflecting a 16% increase, while net income grew by 22% to $88.1 billion.
Microsoft's Intelligent Cloud segment, which includes Azure, generated $28.5 billion in revenue for Q4 FY2024, a 19% increase year-over-year. Azure's revenue alone grew by 29%, driven by strong demand for cloud services and AI integration . The company's AI initiatives, such as the integration of Copilot across Microsoft 365 applications, have been pivotal in enhancing productivity and driving adoption.
📈 Positive Overall Outlook
Analysts maintain a bullish outlook on Microsoft's stock, with expectations of continued growth in earnings and revenue. For fiscal year 2025, analysts forecast an EPS of $13.04, up 10.5% from the previous year . The company's strategic focus on AI and cloud computing, coupled with its strong financial results, support this positive sentiment.
Microsoft's commitment to expanding its AI capabilities is evident in its planned $80 billion investment to enhance its global network of computing centers . This investment aims to support the growing demand for AI services and solidify Microsoft's position as a leader in the AI and cloud computing markets.
To summarize, Microsoft's strong financial performance, driven by its cloud and AI initiatives, positions the company for continued success in the evolving technology landscape.
📌 Trade Plan
📈 Entry: 390 -
✅ Target: 430 - Just below the ATH / around the strong resistance
❌ SL: 365 - Just around the current rejected support zone

BUY $100-130 for LT holdAnalysis:
- LT trend since 2012 shows ~$100 as key support level, even if support (prior resistance now support) from 2014 fails.
- $100 is 67% off of the recent high of $306. Ouch! But this also means there's large upside to get back to those levels.
Despite Trump admin opposition to renewables, FSLR is well positioned with US manufacturing capability, a FWB:20B backlog on current SEED_TVCODER77_ETHBTCDATA:4B in revenue. This means they could grow YoY throughout the Trump admin with just the current backlog. Also, they're profitable with 30% Net Income margins form the last year. Large commercial customers (namely, tech giants through renewables developers) are happy to continue investing billions in renewables (and to trade high capex for low opex).
Investment Thesis:
- Monitor this $130-135 level. If broken with conviction, we look towards $100 entry points. IMO, worst case is also $100-130 price by EOY 2026.

45$I know they have some issues with the glp1 one stuff but revenues are strong and this won't matter long term I think everyone knows that. They'll beat earnings next week and we're headed to 35 range I grabbed a bunch of cheap 45 7/18 calls along with some 40 41s. 31% short Interest right now I'm sure we can get a run up to that 35 before earnings. expect volatility both ways. Today had a premature break out ran 7% and came all the way back to negative to retest, falling below trendline will likely invalidate.

PAPL - Good epxectation for earnings, collect potential?Hi guys we would be looking into Paypal Today
Analysts maintain a "Moderate Buy" consensus on PYPL, with 17 buy, 17 hold, and 2 sell ratings. The average 12-month price target is $84.69, suggesting a potential upside of about 29.6% from the current price. Price targets range from $49 to $125.
Earnings Performance
In the most recent quarter, PayPal reported adjusted earnings per share (EPS) of $1.20, a 22% year-over-year increase, surpassing expectations. However, revenue grew by 6% to $7.85 billion, slightly below forecasts. Notably, PayPal has exceeded EPS estimates in each of the last four quarters.
Growth Initiatives and Strategic Outlook
Branded Checkout Enhancements: Efforts to improve user experience and competitiveness against rivals like Apple Pay
Venmo Monetization and Debit Card Expansion: Initiatives to increase revenue through Venmo and broader payment options.
Fastlane Guest Checkout: A new feature aimed at streamlining the checkout process, with significant monetization expected in 2025.
Valuation and Future Prospects
PayPal's current valuation at 14 times forward 2025 earnings is below its five-year average P/E of 50.5, indicating potential for multiple expansion. Forecasts suggest revenue could reach $35.1 billion in 2025, with EPS around $4.93.
Our Conclusion
Given its strategic initiatives, consistent earnings performance, and favorable valuation, PayPal appears poised for growth. While challenges like competition in digital payments persist, the company's focus on innovation and user experience may drive its stock price upward in the coming years.
📌 Trade Plan
📈 Entry: 65.50
✅ Target: 75.50 - Targeting the weak resistance
❌ SL: 55.50 - protecting the trade above the bottom zone

$3.9 Billion At Support?Long term buy structure forming now.
Large volume sweeps and blocks are being made here. Very large trade at this level happened last week and I think this is going to explode in the coming weeks/months.
Target #1 - $35
Target #2 - $40

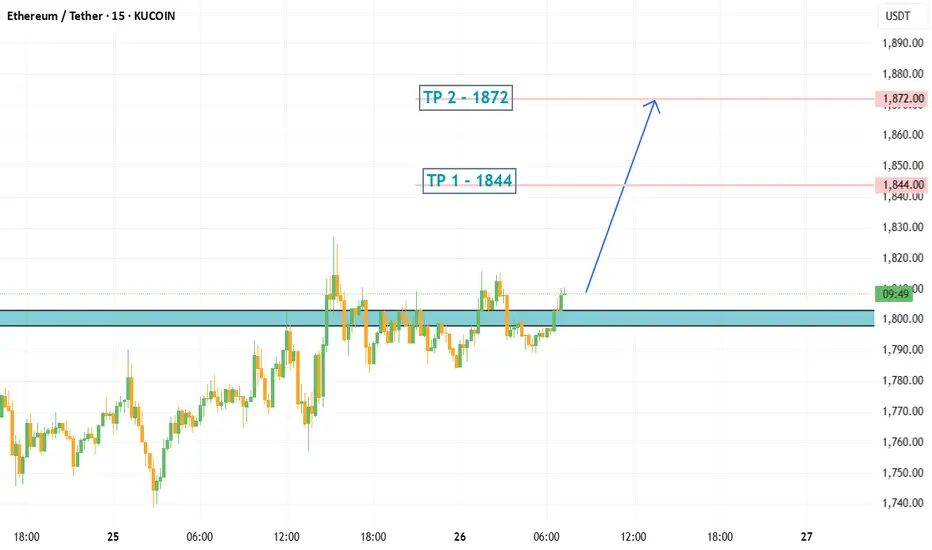
ETH/USDT LONG IDEAPosition opening range 1798~1803 USDT in batches
Total Position Recommendation Within 5% of total funds (or 1~2% of total account loss)
Stop Loss 1784 USDT, liquidate the position when triggered.
Take Profit First Target 1844, Second Target 1872
Cooling-off rule: 24 hours cooling-off after stop loss
Prohibition Prohibition of chasing high, prohibit the increase of positions, prohibit continuous trading
A Long-term Bullish Trend ?With an upcoming Earnings report we can observe rather uncertain future behavior.
But since the trend has been bearish for a longer period of time and the price is "nearly" at the same position which was achieved for the first time in early April in 2019, we can, mostly based only on the technical analysis and Earnings report, determine quite confidently that the price is ready to rise.
Important data:
EPS Estimate: -$3.12
Revenue Estimate: $106 million to $166.7 million
Notable developments:
Cost-cutting initiative = Targeting $1.1B in reductions by 2027
By the end of 2024 $9.5 billion allocated in investments

9 Simple Ratios Every Great Investor Uses - Buffett Included!Forget the hype, headlines, or hope. These 9 financial ratios are what real investors actually use to pick winners, but...
P/E? ROE? EPS? 🧐
- What are they, or better yet, WHO are they? 🤯
- How high is “too high”?
- Is a low number always good, or just a trap?
- Do all industries follow the same rules… or is that another myth?
Buffett. Greenblatt. Graham. Lynch.
They didn’t rely on vibes — they trusted fundamentals
After years of relying on charts, I built a 9-point fundamentals checklist to filter stocks faster and smarter. Now I’m sharing it with real-life examples and key insights to help you spot what really makes a stock worth owning:
Easy enough for new investors diving into fundamentals
Sharp enough to level up seasoned pros
Real enough to avoid hype
…but the truth is: these numbers did flag companies like Amazon, Apple, and Nvidia before the market gave them credit.
-----------------------------------------------------
✅ Quick Reference Table
Scan the table, then dive into the stories…
First Pro Tip: Bookmark this. You’ll check these before every stock pick.
-----------------------------------------------------
📊 1. P/E Ratio | Price-to-Earnings
What it tells you: How much you pay for each dollar of a company’s profit.
Short Example: A P/E of 20 means you pay $20 for $1 of profit. High P/E? Expect big growth or risk overpaying.
Strong: Between 15 and 25
Caution: Above 30 (unless fast growth)
Industry Averages:
- Tech: 25–40
- Utilities: 10–15
- Consumer Staples: 15–20
- Energy: 10–20
- Healthcare: 20–30
Story: In early 2023, NVIDIA’s P/E ratio hovered around 25, near the low end for tech stocks. Investors who saw this as a steal amid the AI boom were rewarded—NVIDIA’s stock made 4x by the end of 2024 as AI chip demand soared.
Contrast that with Tesla in Q1 2025, when its P/E spiked above 40 with slowing sales and Tesla’s stock dropped 50% in weeks.
Pro tip: A low P/E is not always good. If growth is weak or falling, it's often a trap.
Example: A utility company with a P/E of 30 is probably overpriced. A tech stock with 35 might still be fair — if growth justifies it.
-----------------------------------------------------
🧠 2. PEG Ratio | Price-to-Earnings-to-Growth
What it tells you: If a high P/E is worth it based on future profit growth. Whether the earnings growth justifies the price.
Short Example: A PEG below 1 means you’re getting growth at a fair price. High PEG? You’re overpaying.
Strong: Below 1
Caution: Above 2
Industry Averages:
- Software: below 1.5 is solid
- Consumer Goods: Below 2 is more realistic
- Tech: Below 1
- Consumer Staples: Below 1.5
- Healthcare: Below 1.2
- Financials: Below 1.5
- Energy: Below 1.3
Story: In mid-2022, Salesforce’s PEG was 0.8 (P/E 35, forward EPS growth 45%) as cloud demand surged. Investors who spotted this steal saw the stock climb 130% by the end of 2024. Meanwhile, Peloton in 2023 had a P/E of 20 but near-zero growth (PEG above 3). Its stock cratered -50% as fitness trends faded.
Story: NVIDIA’s PEG hit 0.9 in Q3 2023 (P/E 30, growth 35%) during AI hype, a steal for tech (average PEG below 1.2).
PEG filters hype. A stock can look expensive until you factor in growth.
-----------------------------------------------------
🧱 3. P/B Ratio | Price-to-Book
What it tells you: How much you pay compared to what the company owns (like buildings or cash).
Short Example: A P/B below 1.5 means you’re paying close to the company’s asset value. High P/B? Expect strong profits or risk.
Strong: Below 1.5
Caution: Below 1 + poor earnings = value trap
Industry Averages:
- Banks: Below 1.5
- Insurance: Below 1.3
- REITs: Use NAV (aim below 1.2)
- Tech: Often ignored
- Energy: Below 2
Story: In 2024, JPMorgan Chase’s P/B was 1.4, solid for banks (average below 1.5). Investors who bought enjoyed 100% gains.
n 2023, Bed Bath & Beyond’s P/B fell below 1 with collapsing earnings. It looked cheap but filed for bankruptcy that year.
Tip: Only use this in asset-heavy sectors like banking or real estate.
-----------------------------------------------------
⚙️ 4. ROE | Return on Equity
What it tells you: How well a company turns investor money into profits.
Short Example: An ROE above 15% means the company makes good money from your investment. Low ROE? Weak returns.
Strong: Above 15%
Caution: Below 10% unless in slow-growth industries
Industry Averages:
- Tech: 20–30%
- Consumer Staples: 15–25%
- Utilities: 8–12%
- Financials: 10–15%
- Healthcare: 15–20%
Story: Coca-Cola (KO) has kept ROE above 35% for years, a sign of brand power and pricing strength.
Eli Lilly’s (LLY) ROE stayed above 25% from 2022–2024, a healthcare leader (average 15–20%). Its weight-loss drug Mounjaro drove consistent profits, lifting the stock 150%+ in two years. Checking ROE trends helped investors spot this winner.
Tip: If ROE is high but D/E is also high, be careful, it might just be leverage.
-----------------------------------------------------
💰 5. Net Margin | Profitability
What it tells you: How much profit a company keeps from its sales or what % of revenue ends up as pure profit.
Short Example: A 10% margin means $10 profit per $100 in sales. Low margin? Tough business or high costs.
Strong: Above 10-15%+
Caution: Below 5%
Industry Averages:
- Software: 20–30%
- Retail: 2–5%
- Manufacturing: 8–12%
- Consumer Staples: 10–15%
- Energy: 5–10%
- Healthcare: 8–15%
Story: Walmart’s (WMT) 2% net margin looks tiny — but it’s expected in retail.
A software firm with 5%? That’s a warning — high costs or weak pricing.
In 2023, Zoom’s (ZM) net margin fell to 5% (down from 25% in 2021), well below software’s 20–30% average. Pricing pressure and competition crushed its stock quite a lot. Meanwhile, Apple’s 25% margin in 2024 (tech average 20%) remained a cash cow.
Tip: Margins show whether the company owns its pricing or competes on price.
-----------------------------------------------------
💣 6. D/E Ratio | Debt-to-Equity
What it tells you: How much debt a company uses compared to investor money.
Short Example: A D/E below 1 means more investor cash than debt. High D/E? Risky if profits dip.
Strong: Below 1
Caution: Above 2 (except REITs or utilities)
Industry Averages:
- Tech: 0–0.5
- Industrials: 0.5–1.5
- REITs: 1.5–2.5 (manageable due to structure)
- Utilities: 1–2
- Energy: 0.5–1.5
Story: In 2024, Tesla’s D/E dropped below 0.3 (tech average 0–0.5) as it paid down debt, signaling strength despite sales dips - a massive rally afterward.
Tip: Rising debt + falling profits = a storm coming. Always check both.
-----------------------------------------------------
💵 7. Free Cash Flow (FCF)
What it tells you: Cash left after paying for operations and growth investments.
Short Example: Apple’s $100 billion cash pile in 2024 funded stock buybacks, boosting shares. Low cash? Trouble looms.
Strong: Positive and growing
Caution: Negative for multiple years
Sector notes:
- Tech: Lots of cash (think billions)
- Industrials: Up and down, check trends
- REITs: Look at FFO (cash from properties), aim high
- Energy: Has cash, but swings with oil prices
- Healthcare: Steady cash, not too high
Story: Netflix had negative FCF while scaling content. Once costs stabilized, FCF turned positive and stock re-rated sharply.
Pro tip: Profits don’t mean much without real cash. FCF is often more honest.
Cash is king: Companies need cash to pay bills, reduce debt, or fund growth. If FCF is falling, they might be burning through cash reserves or borrowing, which isn’t sustainable.
Potential issues : This mismatch could signal problems like poor cash collection, heavy spending, or even accounting tricks to inflate profits.
-----------------------------------------------------
🚀 8. EPS Growth | Earnings Power
What it tells you: How fast a company’s profits per share are growing.
Short Example: EPS up 10% yearly means more profit per share, lifting stock prices. Flat EPS? No growth, no gains.
Strong: Above 10%
Caution: Below 5%, flat/negative for 3+ years
Industry Averages:
- Tech: 15–30%
- Staples: 5–10%
- REITs: 3–6% (via FFO growth)
- Healthcare: 10–15%
- Financials: 5–10%
- Energy: 5–15% (cyclical)
Story: In Q1 2024, NVIDIA’s forward EPS growth of 30% (tech average 20%+) fueled a rally as AI chips dominated. Checking forward estimates helped investors avoid traps like Intel, with flat EPS and a drop.
Pro tip: A stock with flat EPS and no dividend? There’s no reason to own it.
-----------------------------------------------------
💵 9. Dividend Yield | Passive Income
What it tells you: How much cash you get yearly from dividends per dollar invested.
Short Example: A 3% yield means $3 per $100 invested. High yield? Check if it’s sustainable.
Good: ~3–4%
Red Flag: Above 6% with a payout ratio above 80-90%
Industry Averages:
- Utilities: 3–5%
- REITs: 3–6%
- Consumer Staples: 2–4%
- Tech: 0–2%
- Energy: 2–5%
-----------------------------------------------------
💡 Final Thought: How to Use All of This
Top investors don’t use just one metric. They look at the whole picture:
Good growth? Check PEG.
Good profits? Confirm with ROE and margin.
Safe balance sheet? Look at D/E and cash flow.
Fair valuation? P/E + FCF Yield + P/B.
Real power = Combining metrics.
A company with P/E 15, PEG 0.8, ROE 20%, low debt, and positive FCF? That’s your winner.
A stock with P/E 8, but no growth, high debt, and negative cash flow? That’s a trap.
-----------------------------------------------------
Real-World Combos
🎯Winners:
Tech Gem: P/E 20, PEG 0.8, ROE 25%, D/E 0.4, growing FCF, EPS 20%+ (e.g., NVIDIA 2023: AI-driven growth, stock soared).
Energy Steal: P/E 15, P/B 1.5, FCF positive, Dividend Yield 3.5% (e.g., Chevron 2023: Cash flow king).
⚠️Traps:
Value Trap: P/E 8, flat EPS, D/E 2.5, negative FCF (e.g., Peloton 2023).
Overhyped Tech: P/E 50, PEG 3, Net Margin 5%, D/E 1.5 (e.g., Rivian 2024).
-----------------------------------------------------
🚀 Share your own combos!
What do you personally look for when picking a stock?
If you spotted something off in the numbers, or have a valuable insight to add — please, drop it in the comments.👇
💡 Let’s turn this into a thread that’s not just good but superb and genuinely helpful for everyone.
-----------------------------------------------------
Final Thought
“Buy great companies at fair prices, not fair companies at great prices.” – Warren Buffett
This guide gives you the map.
Charts, tell you when.
These numbers tell you what, and why.
And this post?
It’s just the beginning!
These 9 metrics are part one of a bigger series I’m building — where we’ll go even deeper, with more advanced ratios, smarter combos, and real case studies.
If this guide helped you see financial numbers a little clearer, there’s a good chance it’ll help your investor friend too, especially if they’re just starting their journey...🤝Share it with them!
I built this as much for myself as for anyone else who wants to get better.👊
If you made it this far — thank you! 🙏
...and super thankful if you hit "The Boost" on this post 🚀
Cheers,
Vaido

ServiceNow Surges 15%+ on Strong Earnings and Analyst UpgradesServiceNow (NYSE: NOW) soared 15.2% to $934.16 by late morning Thursday after releasing strong Q1 2025 results. At the same time, the S&P 500 gained 1.2% and the Nasdaq Composite rose 1.7%. The company posted adjusted earnings per share of $4.04, outperforming analysts’ forecast of $3.83. Revenue came in at $3.09 billion, meeting consensus expectations and surpassing ServiceNow’s internal guidance.
The software firm recorded a 19% year-over-year increase in revenue, mainly driven by growth in subscription sales. This segment contributed $3 billion, reflecting continued customer demand for cloud-based workflow automation services. ServiceNow also raised its full-year performance targets, signaling confidence in sustained growth throughout 2025.
The stock has rebounded sharply after recent market weakness. Its current price of $934.16 reflects renewed investor confidence as the company continues to deliver steady top- and bottom-line expansion. Volume during the session reached 7.31 million shares, well above average.
Technical Analysis
Technically, NYSE:NOW bounced from the support zone around $700, aligned with the 200-day moving average of $707.13. ServiceNow respected this level and reclaimed its 100-day ($865.17) moving average. A steep ascending trendline confirms long-term bullish momentum and support since late 2022.
The surge suggests a possible retest of the previous all-time high at $1,198.09. Price action may consolidate around the $1,000 psychological mark before advancing. Volume spikes during the rally indicate strong buying interest.
The technical setup signals a continuation of the uptrend, with bulls targeting a return to historical highs. As long as the price stays above trendline support, the horizontal support, and key moving averages, the uptrend remains intact.

Google - Last earnings call before tariffs affect revenue?Hi guys please find below the analysis we did for Google (ALPHABET)
Alphabet Inc. (NASDAQ: GOOG) is poised to deliver a robust Q1 2025 earnings report, with analysts projecting revenue of $89.22 billion—an 11% year-over-year increase—and net income of $24.71 billion ($2.01 per share), up from $23.66 billion ($1.89 per share) a year ago . This anticipated growth is largely driven by Alphabet's strategic investments in artificial intelligence (AI) and cloud computing, which have bolstered its core businesses, including Google Search and YouTube .
Resilience Amid Tariff Concerns
While recent U.S. tariffs have disrupted global supply chains, particularly affecting hardware-dependent sectors, Alphabet's business model is predominantly digital and service-oriented. Its primary revenue streams—digital advertising, cloud services, and AI-driven platforms—are less susceptible to such trade tensions. Analysts from Citi and Morgan Stanley have expressed confidence in Alphabet's ability to navigate macroeconomic challenges, citing the company's AI-driven innovations as key growth drivers.
General analyst Confidence and Stock Performance
Despite a 20% decline in Alphabet's stock value earlier in 2025, the company's strong fundamentals have led to bullish sentiments among analysts. Price targets have been set as high as $195, suggesting a potential upside of up to 29% from recent levels . The company's continued focus on AI and cloud services positions it well for sustained growth, even amidst global economic uncertainties. In summary, Alphabet's upcoming earnings call is expected to highlight the company's robust performance and resilience, underscoring its ability to thrive despite external economic pressures.
📌 Trade Plan
📈 Entry: 155.41
✅ Target: 181.30
❌ SL: 121
We are looking for +-20% increase in the upcoming days/weeks!

BTC/USD Operation Strategy AnalysisCurrently, the market is approaching the previous high (84994), favoring a “false breakout” pattern.
84200 although reasonable support, but the volatility is limited should be segmented take profit, such as to 84550 when the first flat 50%, the remaining single capital preservation tracking.

$NFLX - EARNINGS - Expected MoveNASDAQ:NFLX - EARNINGS - Expected Move
50DMA & 30min 200MA Pointing down, huh? 😏

BUY XAUUSDTHIS WEEK FOR XAUUSD (LONG)
SHORT TERM FOR GOLD
Sell Limit:3345-3350
⛔️ Stop Loss: 3358 (no greed, no delay)
Expect the uptrend to induce more and then fall back, use the end of the inducement to lay a short
---
Strict stop-loss, no covering positions, no adding to positions

AUDUSDThe market is currently exhibiting a prevailing downtrend, prompting a focus on identifying potential short-selling opportunities. According to this analysis, a Head and Shoulders (H&S) pattern has formed on the 3-5min chart, presenting a potential bearish entry following a confirmed break below the neckline.
For traders who have entered short positions based on this pattern, there are two potential target levels identified at and , derived by the hourly strong resistance level, the 4 hour downtrend, the previous recent lower low, the overbought RSI, and a few other indicators used.
Conversely, while the primary focus is on sell opportunities due to the overarching downtrend, potential long positions would require more significant confirming signals. These confirmations may include [ a break and close above a key resistance level, bullish divergence on a specific indicator, positive fundamentals and a LOCK.
Further detailed analysis and real-time updates are available just send a message or leave a comment!

Long term buyLooking at the exponential growth in revenue over the past few years and relatively lower valuation (based on the price to sales ratio or revenue per share), upward trajectory looks very very promising.

Is $GERN a stock for "Strong Holders"?Or is it just another stock whose value will be wiped out in the next few quarters, and the company will simply lose its listing on the Nasdaq?
Investors are likely to get an answer to this question today, before the market opens, when NASDAQ:GERN reports its quarterly earnings.
The company has an approved drug and has already begun commercialization, with a promising start.
Last quarter, the company generated $28 million in revenue, and this quarter, revenue is expected to reach $61.8 million.
The company has already achieved positive gross margins, and I expect them to improve significantly from the current 27% in the last quarter.
Operating expenses are close to $30 million per quarter, so we can expect a quick path to operating profitability.
Invested capital is around $135 million, which means that with an operating profit of $10 million per quarter, we could see interesting returns on invested capital.
The company is led by John A. Scarlett, M.D., who previously worked at NASDAQ:CTMX for six years, during which the company lost about 90% of its value.
There is some positive news regarding European approval: "The Committee for Medicinal Products for Human Use of the European Medicines Agency has issued a positive opinion." A decision is expected in the coming months, if not days, which should serve as a strong catalyst for the stock price.
The market valuation has dropped to $1.4 billion, despite having an FDA-approved drug in the U.S.
Cash reserves will be important as they indicate how much time the company has to develop without diluting its capital. In the last report, cash and short-term investments totaled $339 million, and on November 7, the company announced securing $250 million in funding, with the potential to increase it to $375 million.
As a result, the company has $589 million in cash reserves minus operating cash flow. How much will remain in the coffers?
The company should have enough cash for more than 12 months of successful operations, operational efficiency is improving, we are awaiting European approval, and only the quality of management raises doubts.
But do these doubts really hold weight given the current trajectory?
There are only a few hours left until the earnings report is released. Let's see what awaits us.
Strong Holders
Profiting From Strength
📉✊📈

DoorDash (NASDAQ: $DASH) Gains Strength Ahead of May EarningsDoorDash, Inc. (NASDAQ: NASDAQ:DASH ) is showing strong momentum in a volatile market. As of April 11, DASH closed at $180.49, up 1.10% for the day. The stock has risen about 9% year-to-date, while the overall Computer and Technology sector has dropped around 11.8%. This places DoorDash ahead of many of its peers.
DoorDash belongs to the Computer and Technology group, which ranks #6 out of 16 sectors based on the Zacks Sector Rank. The company currently holds a Zacks Rank of #2 (Buy), signaling positive analyst sentiment. Over the last three months, analysts have revised DoorDash's full-year earnings estimate up by 14.7%. This indicates growing confidence in the company’s future performance.
Investors are now watching closely as DoorDash prepares to release its earnings report on May 7, 2025. The stock's upward trend and revised estimates may influence how it reacts to the upcoming results.
Technical Analysis
The daily chart shows that DASH recently bounced off a strong support zone around $162. This zone has acted as a demand area before, pushing the price higher in past sessions. Currently, DASH is approaching key resistance level at $200. A break above these could lead the stock toward the recent high at $215.25. The chart also suggests a possible retracement before a new leg up, reflecting a bullish continuation structure.
Volume increased during the bounce, indicating strong buying interest. RSI is at 48.16, which suggests neutral momentum with room for further upside. DoorDash remains one to watch heading into earnings season.

Netflix Earnings Growth Expected As It Prepares For Q125 ResultsNetflix (NASDAQ: NASDAQ:NFLX ) is set to report its earnings for the quarter ending March 2025 on April 17. Analysts expect year-over-year growth in both revenue and earnings. However, consensus earnings per share (EPS) estimates have been revised down slightly by 0.07% over the past 30 days. This suggests a cautious outlook among analysts.
At the close on April 11, Netflix stock traded at $918.29, down by 0.31%. In after-hours trading, the price edged slightly higher to $919.80. The stock traded with a volume of 4.07 million shares. RSI stands at 47.76, reflecting neutral momentum.
The final result could trigger a sharp price move. A positive earnings surprise might push the stock higher. On the other hand, a miss could lead to a decline. The outcome will also depend on management’s commentary during the earnings call.
Technical Analysis
On the daily chart, Netflix recently bounced off a key demand zone near the $820–$830 range. This zone had previously served as a strong support area. After touching this level, the price formed a reversal candle, signaling potential buying interest.
The stock is now hovering around $918.29, near the 50-day and 100-day moving averages at $961.61 and $931.24, respectively. If the price clears these levels, it may aim for the recent high of $1,064.50. A short-term retracement could occur before a possible continuation higher.
Volume analysis shows a spike during the bounce from support, indicating accumulation. The price pattern suggests a bullish structure is forming. Overall, eyes remain on the April 17 earnings report for the next major move, which might see Netflix surge to a new all-time high.

BlackRock Beats EPS Estimates Despite Revenue Miss in Q1 2025 BlackRock Inc. (NYSE: NYSE:BLK ) reported adjusted earnings per share (EPS) of $11.30 for Q1 2025. This beat the Zacks Consensus Estimate of $10.25, marking a 10.24% surprise. In the same quarter last year, EPS was $9.81.
Revenue came in at $5.28 billion, missing the estimate of $5.33 billion by 1%. However, it rose from $4.73 billion a year earlier. The company has surpassed EPS estimates in all four of the last quarters and has topped consensus estimates twice in that span. In the previous quarter, BlackRock posted EPS of $11.93, beating the $11.27 estimate. That represented a surprise of 5.86%.
BlackRock operates in the Financial - Investment Management industry. The market now awaits management’s outlook for future earnings. This will shape short-term price direction. So far in 2025, BlackRock shares have dropped 16.2%. In comparison, the S&P 500 has declined 10.4%.
Technical Analysis
BlackRock rebounded from a strong support zone near $780. This level aligns with the long-term horizontal support level that has held for over 3 years now. The RSI sits at 41, indicating it is nearly oversold. However, a bullish reversal momentum is forming around the support zone.
If the price continues to rise, resistance and target lie at the $1,084.22 recent high. A break above $950 may trigger a run toward the $1,000–$1,084 range. If the price is rejected, it could revisit the $780 support or possibly the ascending trendline sitting below the horizontal support.

Morgan Stanley (NYSE: MS) Reports Strong Q125 ResultsMorgan Stanley (NYSE: NYSE:MS ) Beats Q1 estimates with record Equity Trading Revenue. The bank posted earnings per share (EPS) of $2.60, beating analyst expectations of $2.18. Revenue reached a record $17.74 billion, topping forecasts of $16.44 billion.
The bank's equity trading revenue soared 45% year-over-year. It reached a new high of $4.13 billion as growth came across business lines and regions. Asia showed particularly strong performance. Prime brokerage and derivatives led gains, fueled by high client activity in volatile markets.
Morgan Stanley shares dropped 1% after the earnings release. However, the stock remains up over 20% in the past year. Volatility in global markets helped trading desks outperform.
Technical Analysis
Morgan Stanley bounced sharply from the $95 support zone. Buyers stepped in near the previous breakout level. Volume increased and confirmed renewed interest. This was seen as Trump paused tariffs for the next 90 days as well. Current price action suggests a recovery trend. The RSI stands at 39, hinting at oversold conditions. A potential path points to $142.03, which acts as the immediate resistance level.
If the price breaks $113 cleanly, momentum could carry it to $130 and beyond. If it fails, it is most likely to retest $95 support level. A strong break above recent highs would confirm bullish continuation. For now, Watch out the $113 and $142 levels closely.
