2 earning reports to watch October 2022It’s that time of year again; earning session for US stocks. With so many other variables contributing to volatility in the US markets (e.g., inflation, Fed rate hikes, recession, oil prices, quantitative easing), anything out of the ordinary can result in huge moves in stock prices. This has already been witnessed in an early report from Nike (NYSE: NKE) last week, where it missed on some metrics and was punished with a -12.8% fall in its stock price.
So, with this in mind, here are two earning reports to watch this October.
Advanced Micro Devices (NASDAQ: AMD)
AMD updates the market with its earnings on Tuesday October 25, alongside some of the other major companies on the NASDAQ, including Microsoft (NASDAQ: MSFT) and Alphabet (NASDAQ: GOOG).
AMD shares fell +23% in September, partly impacted by the weak report from sector compatriot Micron Technology (NASDAQ: MU). It is the weak demand outlook that Micron painted for personal-computer products that makes AMD’s upcoming announcement one to watch.
Similarly, Taiwan Semiconductor (NYSE: TSM) is reporting on October 13, which could serve as another barometer for the industry before AMD delivers its report.
Netflix (NASDAQ: NFLX)
It may be a make or break earnings report for Netflix on Tuesday 18 October.
Netflix shares climbed +8.4% over September, and over +30% since its last market update in June, where it reported a loss of almost 1 million subscribers. In fact, Netflix was one of the top S&P 500 performers last month, where the broader market index fell by -8.0%.
In the upcoming announcement, investors will be looking out for more details concerning the company’s plan to diversify its revenue base with ad-tier subscription and its heretofore mild penetration into the gaming space.
Some surveys point to almost half of Netflix’s subscribers considering a switch to the company’s ad-tier plans, which would mean that Netflix would have to fill that subscriber revenue gap by selling $5.4 billion worth of ad space.
Earningsanalysis

FDX: Overreaction?FedEx Corporation
Short Term - We look to Buy at 161.03 (stop at 148.79)
The company gave a bleak outlook for profits and plunged in the premarket by 20% .We are trading at oversold extremes. A move lower faces tough support and we remain cautious on downside potential. We therefore, prefer to fade into the dip with a tight stop in anticipation of a move back higher. A higher correction is expected.
Our profit targets will be 206.12 and 215.00
Resistance: 200.00 / 240.00 / 320.00
Support: 160.00 / 130.00 / 100.00
Please be advised that the information presented on TradingView is provided to Vantage (‘Vantage Global Limited’, ‘we’) by a third-party provider (‘Signal Centre’). Please be reminded that you are solely responsible for the trading decisions on your account. There is a very high degree of risk involved in trading. Any information and/or content is intended entirely for research, educational and informational purposes only and does not constitute investment or consultation advice or investment strategy. The information is not tailored to the investment needs of any specific person and therefore does not involve a consideration of any of the investment objectives, financial situation or needs of any viewer that may receive it. Kindly also note that past performance is not a reliable indicator of future results. Actual results may differ materially from those anticipated in forward-looking or past performance statements. We assume no liability as to the accuracy or completeness of any of the information and/or content provided herein and the Company cannot be held responsible for any omission, mistake nor for any loss or damage including without limitation to any loss of profit which may arise from reliance on any information supplied by Signal Centre.

ZM Zoom Buy area after second-quarter revenue missIf you haven`t longed ZM Zoom with me here:
Then you should know that $80 is the price where i would long it once again after the second-quarter revenue miss.
Looking forward to read your opinion about it.

WMT bigger pictureLooks like a typical cup and handle right now. The EA was good, even with this high inflation. If we consider this was really the peak of inflation, the consume will recover then if not we could see another down turn for the retail sector. But even though with high inflation WMT positioned itself in a very good state.
(For example, reducing supplier costs to keep the products as cheap as possible, also they develope the own internet platfomr even more.)
I see a possibility to see the $150+ level again

$SE 1D BUY SETUP FOR +70% MOVE!Sea Limited is good stock if you are thinking about adding a digital gaming, software and cloud communication/network stock to your watchlist/portfolio. It is currently showing a possible sign of retracing to$120 area, but I think it will report good earnings and have a positive move up from the news. It is also coming out of a contraction which always means a big move is coming!

$TGT (TARGET) POSSIBLE +20% GAP FILL!$TGT has earnings coming up and a huge +20% gap to fill, which would be a +$35 move for this week to come or even leading into next week! Price has broken resistance and is making a bullish move to the upside to fill that gap it seems! Patience is key! wait for confirmations & ride the trend!

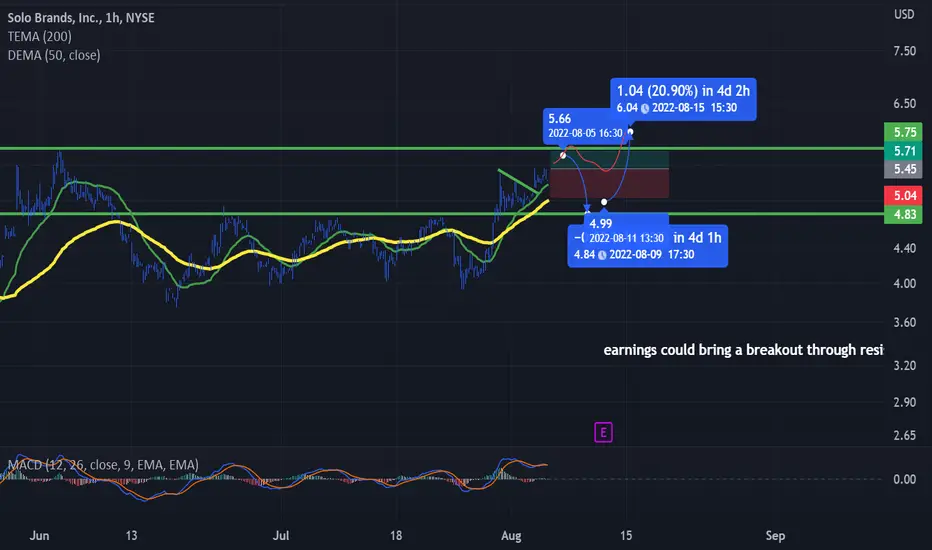
waiting for earnings AUG11we ould breakout after earnings. in the meantime we could retrace 20% or move sideways "orangeline"
AMD is a Beautiful Opportunity - Earnings Report HighlightsSince the beginning of the second quarter, chip stocks have been steadily rising, amid deteriorating indicators of an economic downturn, particularly in the consumer end market. The Philadelphia Exchange Semiconductor Index (PHLX) rebounded more than 20% in July after falling almost 40% in the first half of the year. To a similar degree, AMD (NASDAQ:AMD) has surged in July, marginally beating the PHLX for the month but still below the benchmark year to date. Despite industry leader and major rival Intel's (INTC) disappointing quarterly earnings and future outlook last week, the rally maintained its pace.
Investors are getting more optimistic about AMD's resiliency in the wake of Intel's recent setback, which suggests that the former is becoming a more major participant in both the high-performance PC and data centre CPU markets. T , the company's EPYC server processors are making significant headway into the data centre and high-performance computing (HPC) segments, while its powerful next-generation PC processors such as the Radeon GPUs and Ryzen CPUs are also drawing attention from Intel.
Although most chip manufacturers that have reported second-quarter results so far are warning of a plausible decline in demand and inventory build-up - especially on consumer-centric products like memory chips used in consumer electronics products, the market for semiconductors used in data centres, auto, and premium equipment like enterprise workstations remains strong. As a result, AMD benefits from positive upswings as it strengthens its technological lead in data centre, high performance PCs, automobiles, and, more recently, telecom infrastructure prospects.
Recent market trends, which support a healthy demand environment for AMD's primary data centre end market, as well as indicators of significant growth in market share, lead to the chipmaker's sales and profits beat streak continuing. The following study will go deeper into three key factors supporting AMD's long-term upsides and outperformance in the face of near-term industry challenges: First, declining consumer spending, Second, data centre growth, and Third, solid fundamentals.
Given its high-growth potential, AMD is presently trading at roughly 5.5x projected EV/sales, which is still a big discount to the fabless semiconductor peer group mean of about 5.9x. Given that the company is currently lagging the PHLX, AMD remains a good buy at the moment. With investors incentivizing those who have proven perseverance this earnings season – as evidenced by last week's rigorous big tech earnings results, which supported the tech-heavy Nasdaq 100 add $1.5 trillion in market value in July – AMD's eagerly anticipated solid quarterly showing makes a beneficial near-term precursor in reigniting the stock for persistent uptrend momentum.
Demand from Consumer Spending prospective
Alarms from the industry about declining chip demand from consumer end markets, especially those found in consumer electronics such as cellphones and Computers, are becoming louder, reflecting prior investor fears about a declining semiconductor cycle after an outstanding growth.
PC shipments globally have already begun to slow in the first half of the year, with first-quarter volumes falling 6.8 percent year on year to 78 million units, and second-quarter volumes falling more than 15 percent to 71 million units, as consumption and investment spending power dampens due to rising rising inflation. Global PC shipments are expected to fall by 9.5 percent this year, driven by a 13.1 percent reduction in consumer PCs and a 7.2 percent loss in corporate PCs. As a result, demand for similar chips is likely to fall by more than 5% this year. Conversely, semiconductor demand from phone manufacturers is predicted to rise by just little more than 3% this year, a major deceleration from the 25% surge seen in 2021.
Nonetheless, despite evidence of a weakening consumer end market as consumers reduce discretionary spending due to relatively close economic uncertainty, AMD's growth in this sector is projected to be robust given its minimal direct exposure. Given observations that the present PC market is migrating to higher end and more expensive sectors, supported by commercial purchases to suit the concept that hybrid and remote work is the new future, the chipmaker is confident in its ability to overcome near-term difficulties. In particular, AMD expects persistent business demand for high-performance workstations to enable a "hybrid-virtual" work environment to largely offset any near-term repercussions on consumer-centric gaming PC sales owing to unpleasant economic difficulties in the consumer end market.
This view is reinforced by recent results provided by PC makers such as Microsoft (MSFT), which verified that sales growth for its Surface devices were mostly robust in the second quarter due to sustained corporate demand. Other PC makers, such as Dell (DELL), have made similar remarks about the strength of enterprise demand, owing to the growing urgency of "modernising the technology infrastructure" to ensure intelligence, cyber-resiliency, automation, and multi-cloud adaptability" in the new baseline of remote co - operation.
While AMD has chosen to be conservative in terms of PC prospects for the current year, indicating a year-on-year reduction in negative single digits for related sales, the firm is projected to recuperate some market share by selling its flagship, more costly models. AMD also has a number of commercial machines in the works for this year, including the recent debut of the (Ryzen 6000 Series) processors for upscale laptop applications, which maintains good PC performance for 2022 despite a wider market slump. With seasonal demand from back-to-school and Christmas sales in the second half of the year, AMD continues on track to increase its PC market share.
How Data Center is ultimate strength
Global demand for data centre processors will stay high in the next years, as cloud computing remains a crucial necessity in the business sector, with no indications of abating. The market for data centre processors, in particular, is forecast to grow by at least 20% this year, more than offsetting any consumer-related slowdown that AMD may see owing to near-term macroeconomic downturn.
The positive trends have been further supported by the rising urgency of business cloud migration to accommodate a new era of remote working, as indicated in the previous section. More than half of firms anticipate that cloud adoption would account for a substantial share of investments over the next two years, propelling the worldwide cloud-computing industry to more than $800 billion by 2025. Meanwhile, the market for Artificial intellegence hardware, such as data centre chips like AMD's EPYC server CPUs, is predicted to grow at a CAGR of 42% to $1.7 trillion by the end of this decade.
Even in the face of a possibly tightened economic situation in the near future, these numbers continue to support a solid demand scenario for both cloud service providers and chipmakers like AMD. Furthermore, AMD's ongoing commitment to innovation helps the company's long-term position and market share in data centre possibilities. AMD's EPYC server CPUs have been a flagship product in recent times, driving the firm's break-out growth and data centre market share increases. EPYC CPUs are currently in their 4th generation, with a family of four chips encompassing (Genoa, Genoa-X, Bergamo, and Siena), all of which are geared to optimise performance across a wide range of use cases, from cloud applications to communication system and telecom installations.
Server processors have grown into some of the most powerful and fastest CPUs utilised in HPC designs today. AMD's EPYC CPUs may now be found in 72 of the world's top 500 Fastest Super-computers, a threefold increase from 2020. The EPYC processors' dominance on the (Green-500) list attests to its power efficiency for sophisticated tasks. Till now, AMD's EPYC processors power 80 percent of the world's most efficient supercomputers, putting the company's HPC competency on able to compete with legacy competitor Intel's. AMD's growing strength in data centre and HPC prospects are also supported by key rival Intel's admission of (server market share loss) last week, which provide substantiated support for AMD's long-term growth path. All whilst, AMD's Gen 4 EPYC server cpus are well-positioned to benefit from Intel's delayed launch of its next-generation Sapphire Rapids server processor cores, which threatens to further weaken the other's market dominance.
Fundamentals Strength
Over the previous seven quarters, AMD has had a constant record of good sales and profit surprises. And we anticipate that AMD's 2Q22 earnings will be similarly robust, with top- and bottom-line growth driven by ongoing market share gains and the ramp-up of innovative products to scale.
Top-line, AMD continues to illustrate its ability to capture market share gains in an extremely competitive industry by strengthening its technological capability to attract demand and growing its total addressable market (TAM) through recent acquisitions such as Xilinx and Pensando. Especially, the merging of Xilinx and Pensando is intended to provide new synergies when combined with AMD's current competence in CPUs and GPUs, propelling the firm into new excursions to diversify its income portfolio.
AMD Total Revenue vs Total operating expenses
Free Cash Flow

be BULLISH on JUBILANT INGREVIA hey guys ,
JUBLIENT INGREVIA stock is showing bullish signs ,
This stock was moving in a downtrend for a very long time ,
but now, through the analysis, i think that this stock is starting to move in a UPTREND
the stock was moving in a downtrend , BUT IN A FIXED AREA ,
and now this stock has crossed it's resistance,
and has shown a great bullish candle .
there are 2 reasons to buy this stock ;
1. A GREAT BULLISH CANDLE HAS BEEN SEEN ABOVE THE RESISTANCE
2. 20 DAY EMA has CROSSED ❌ the 50 DAY EMA
therefore, you can bet on this stock and can try to earn high returns.
i have marked the RR RATIO , TARGET AND SL for y'all .
BUT PLS CONSIDER THE GLOBAL SITUATION FIRST,
1. INFLATION
2. WAR
3. RISING BANK RATES
AFTER CONSIDERING THESE SITUATIONS YOU CAN BUY THIS STOCK
JUBULANT INGREVIA
😀😀

What You Could Have Expected From Zoom's Earning Report?It can be tough sometimes to play ER, but I commend those who have the nerves to consistently play ER's. We know prices can go either way when dealing with earnings.
A company can beat on ER and gap down, a company can miss on earnings & gap up. Sometimes it feels like playing the lottery with ER plays.
There are some things you can notate before you play an earnings report.
Like how has the asset been performing leading into earnings? Has it been bullish? Has it been bearish?
What's the overall sentiment surrounding the asset?
How has the asset been performing against the market?
What is the market doing? Does the overall market seem bearish or bullish. Does the particular asset move with or against the market?
Don't just assume what the asset will do regardless of what the chatter is.
Leading into it's' ER, Zoom has been in a continued downtrend like a plethora of other stocks. Seeing this, along with price action leading into ER. I could expect for Zoom to pop after hours, Why?
One reason is that it has been in a steady decline. There were "trapped bulls" at the 107 area & price made a double bottom from the May 20th trading session into the May 23rd trading session around $85.
Seeing that, along with price being in a steady decline & the chatter of a earnings beat. You could have went long with 95-107 calls with a SL at 85(even though SL's are no good post-market). Nevertheless, Zoom pushed to 107 after hours before fading. Again, ER plays are tough, but there is a method to the madness as well. If you played Zoom's ER, I hope you were on the right side of it.
Catch yall on the next post.....Peaaaacccceeeee!!!!

Target:Bargain hunt after earnings missTarget
Short Term - We look to Buy at 160 (stop at 140)
This stock has recently been in the news headlines. They reported a surprise earnings miss and this sent the share price plummeting in the premarket. This has resulted in signals for sentiment being at oversold extremes and we look for a move to the upside. Dip buying offers good risk/reward. Further upside is expected.
Our profit targets will be 219 and 240
Resistance: 180 / 200 / 220
Support: 160 / 140 / 120
Please be advised that the information presented on TradingView is provided to Vantage (‘Vantage Global Limited’, ‘we’) by a third-party provider (‘Signal Centre’). Please be reminded that you are solely responsible for the trading decisions on your account. There is a very high degree of risk involved in trading. Any information and/or content is intended entirely for research, educational and informational purposes only and does not constitute investment or consultation advice or investment strategy. The information is not tailored to the investment needs of any specific person and therefore does not involve a consideration of any of the investment objectives, financial situation or needs of any viewer that may receive it. Kindly also note that past performance is not a reliable indicator of future results. Actual results may differ materially from those anticipated in forward-looking or past performance statements. We assume no liability as to the accuracy or completeness of any of the information and/or content provided herein and the Company cannot be held responsible for any omission, mistake nor for any loss or damage including without limitation to any loss of profit which may arise from reliance on any information supplied by Signal Centre.

AMD Bullish outperform on the Horizon? Higher Actual Earnings?!?AMD has a History of outperforming Earnings Estimates. I believe this provides Stark Fundamentals, in order to support the TA Case for a reversal to the upside:
> Q1 2021 18% higher than expected
> Q2 2021 16% higher than expected
> Q3 2021 9% higher than expected
> Q4 2021 21% higher than expected
With the above earnings in mind. The last 4 Quarterly reports provided an average of 16% out performance for Actual over Estimated earnings.
I have become very Bullish on the Fundamentals of AMD. A company in which, I and other already consider to have stronger Financials that Nvidia. (Also bullish on NVIDIA - just more for AMD)
Even with the "Ukrainian Heroic Freedom War" effect on the companies earnings, I would expect a slight out performance to repeat.
>>I have all the earnings dates laid out with the Vertical lines<<
Technical Analysis
I believe that the Green Horizontal line, which has been substantial resistance, support, resistance and now Support. Will be the foundation for a reversal to the upside. The Tech Sector, more particularly AMD, is at one if not the most Oversold level(s) in the companies History. One must only look at the distance from the Moving Averages to see this. My Quantitative models have highlighted this as one the three most attractive equities at present on My Radar.
>>Alongside Riot Blockchain and Netflix<<
In my opinion, AMD is the most attractive from a combined Fundamentals and Technical Analysis Evaluation.
Having DCA over yesterday and today into AMD. I believe a significant short to mid term rally to the $130 range is possible.
> Supported by a bounce from the general market being oversold.
> Tax season selling finished.
> Rate hike news already over priced in the market. (Strong belief that most (not all) of the rate hikes are being used as a stick waved to slow the market and economy. Rather than a tool that will be used to brutally beat the economy into recession)
> AMD being significantly more oversold than the greater market.
> Long term pricing models, factoring earnings and industry growth would suggest a significantly higher price in the coming weeks/months.
>>Finally, don't lever up and keep some dry powder always<<
>>Keep the Long term in mind Chaps<<
This is my own opinions, analysis and a trade I am currently undertaking in my portfolios. This is not Financial advice purely my own Analysis and Research.
Will be sharing the TA modelled charts over the coming Days for those interested.

Technical Analysis for Risk AnalysisTechnical Analysis should be used for Risk Analysis, not just for deciding if and when to buy whatever it is you want to trade, whether it's stocks, crypto, forex, indexes, ETFs, REITs, mutual funds, etc.
When you know the technical patterns that point to higher risk, aka sellers gaining traction, you can get out of long positions before the retail crowd and its small fund managers react late to earnings reports.
It is NEVER the largest institutions, who we call the Dark Pools, who are selling on earnings announcements. It is ALWAYS the less informed who buy or sell on big news days.
This is what we at TechniTrader call "Relational Technical Analysis"--the application of what we know about the market participant groups to discern who is doing what in the technical patterns of a chart.
For example: UPST was a struggling IPO anyway. The typical IPO top and drop occurred in October-November. 99% of new IPOs do this. Learn to sell at the peak of a speculative new IPO. That means you must learn what speculation looks like in the charts and how to recognize the top developing so you can get out before the drop.
But today's lesson is about the specific set of negative technical patterns developing ahead of Upstart's earnings report yesterday after the market close:
1. A trading range was developing lower highs and lower lows.
2. Compression of price at the low end of the range.
3. Declining Accumulation/Distribution over the sideways action of the trading range.
These are what we at TechniTrader call the "footprints" of controlled rotation out of the stock ahead of the earnings press release date.
Please like and follow if you learned something new. Learn more at my website.

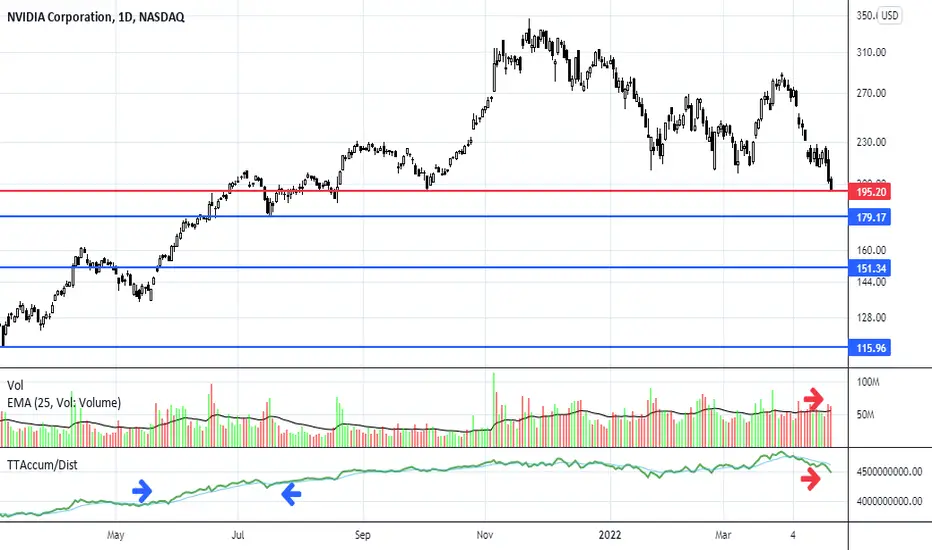
High Volume Support Break Headed to 180NVDA has a high-volume support break last week. Dark Pool buy zones are stronger around 180 and 150. A month to earnings with higher quarterly revenues expected. The bottom isn't far off, but it may take a while to form in these market conditions.
Netflix, What happened?Overview
After poor revenue release and news of losing subscribers in large quantities, Netflix has posted two major losses in recent times. This brings the valuation of Netflix shares down a total of nearly 70% from November highs.
The future
At this rate, the stock has been poorly rated by many analysts and has strongly bearish momentum. The question now is whether or not Netflix will try to implement a new way of doing business or alter current operating methods to try and bring its value back. In the event that Netflix is able to find a viable solution to return to successful business, we may see golden opportunities to buy back into such a large company with huge potential. However, given the rise in popularity in other video streaming services, it's unlikely that Netflix will be able to continue on its success by solely providing video streaming services without a major change in operation.

#FB wicking the .707 on the Daily#FB wicked that very important algo level on the daily ( .707 ) we will see if heading into earnings that will be enough for us to get a good push to the upside closely watching the flow for bullish signs today right at close we got another 150k expiring in 2 day on calls #SmellsBullish

Netflix Analysts forget microeconomics principles... Hysteria??Netflix Q2 2022 Earnings Report: ir.netflix.net
Key Takeaways of Netflix Earning Report
> Lowest P/E ration in 10 years of operating.
> Revenue is UP 2.06% from last quarter.
> Revenue is UP 9.8% from Q2 of 2021
> Operating Margin of 25.1% is UP 19.1% from the last 4 Quarter average.
> Diluted EPS of $3.53 is UP 25.6% from the last 4 Quarter average.
> Global subscriptions is 6.7% UP from Q1 2021
> Cash Flow is strong.
> Netflix Content is still Great. Streaming market share for total US TV time has risen 0.4% in a 10 month period. That is factoring all the new cheaper competitors entering the Market.
> Net Margin has Been growing at a constant and rapid pace.
With the Financials briefly covered above, here are some of the key thoughts to keep in mind.
Why are financial "Analysts/reporters" trumpeting on about the around 2 million lost subscribers?
The answer is that they have not read the Financials. Their understanding of the streaming market is limited to subscriber count as the sole Variable to take into account. This is the unfortunate result of an incentive, to hold one reason or aspect as the sole driver of the streaming business.
>> The microeconomic 101 principle should have made it clear that as Netflix prices are raised there will be less demand.
>> What is more important is that the FINANCIAL inflows, more than make up for the lost 2 million subscribers.
The demand is Inelastic and therefore the price rise, was the right decision from a shareholder & business perspective.
>>> I will be DCA into this oversold discount, increasing my Netflix position in my portfolio. With the long term in mind, that Netflix is a main pillar in the continuously growing streaming sector<<<
Not financial advice, just an investor/trader's opinion. Who is looking for the best reward to risk In this turbulent market.
Check out my AMD analysis if you liked this Idea:

Wish Wyckoff showtimeResults were as expected and clearly belong to the previous management team.No no point for the current team to show any improvements. As stated by the newly appointed team the real turnaround results should be visible somewhere in Q2 2022, so for Q1, I expect a Wyckoff accumulation. Retail is so depressed and tired that eventually nobody will be left except me.
Points looking forward
1. Cash on hand $1b, plenty of time for a turnaround, 0 debt.
2. New C-level executives must prove themselves+receive stock bonuses, so their serious effort is granted.
3. Logistics revenue up 45% YoY, when ad spending resumes this should rocket because shipping times will fall dramatically = happy customers
4. Bad merchants are cleared away, quality is improving slowly but steady = happy customers
5. New redesign in platform launching soon = happy customers
6. Institutional accumulating more and more
7. Everybody(retail) is getting tired and is at a loss of -50% or more, now it's time for a slow death. If markets go up then other stocks will fly and this one will keep accumulating making everyone nervous and anxious, so in the end, everybody will be gone.
My targets for this year
Q1 : $3-3.50
Q2 : $5-7.5
Q3 : $9-12
Q4: $15
My targets for 2023,2024,2025
1. $22
2. $32
3. $60
Stay safe and always have a plan.

Strong SUPPORT at $20.00 area on $KNBETechnical analysis:
$20 area has been strong support since Jul 2021.
If it holds $20 area, it is nice chance to buy some shares of $KNBE. It has big potential to hold it.
Fundamental analysis:
Knowbe4 Inc Cl A (KNBE) reported 4th Quarter December 2021 earnings of $0.07 per share on revenue of $69.3 million. The consensus earnings estimate was $0.01 per share on revenue of $67.1 million.
The company said it expects first quarter revenue of $72.0 million to $73.0 million and 2022 revenue of $328.0 million to $330.0 million. The current consensus revenue estimate is $69.15 million for the quarter ending March 31, 2022, and revenue of $308.65 million for the year ending December 31, 2022.
Signal:
BUY: $20.00
TP1: $22.25
TP2: $24.26
SL: $19.11
2:1 and 4:1 Risk/reard ratio

Post 10/28 Earnings Announcement Analysis Post 10/28 Earnings Announcements
$XOM, $CVX, $PSX, $AON, $CL
$XOM - Exxon Mobile
Reported EPS of $2.96/share - beat estimates of $2.20/share
Earnings of $6.8B vs.($296M) in Q3 FY20'
Revenue of $44.7B vs $45.4B down (1.54%) YoY
Operating CF of $12.1B
FCF was a record-setting $6.7B
Returned $3.7B to shareholders in dividends
Reduced debt by $4B - bringing debt/capital ratio to ~25%
Up 1.76% after hours
$CVX - Chevron
Reported EPS of $2.96/share
Revenue of $44.71B up +80% YoY
Returned $6.2B to shareholders in dividends
Repurchased $625M of stock
Reduced Debt by $5.6B
FY21 Spending down 22% YoY
Net Oil-Equivalent Production rose to 3.03M bbl/day - up 7% YoY
Up 1.64% after hours - up 34% YTD
$PSX - Phillips 66
Reported EPS of $0.74/share - beat estimates of $0.60/share - up 163% YoY
Earnings of $712M
Revenue of $27.89B
Operating CF of $1.7B
Returned $841M to shareholders in dividends and share repurchases
Announced new $3B share repurchase program
Up 2.75x% after hours
$AON - Aon
Reported EPS of $1.53/share - up 14% YoY
Revenue of $2.7B - down 13% YoY
Income of ($801M) down (282%) YoY
FCF of $1.14B - (40%) YoY
Down (%2.52%) after hours
$CL - Colgate-Palmolive
Reported EPS of $0.75/share - down (7.0%) YoY
Net Income of $681M down (9.4%) YoY
Sales of $$4.4B - up 6.5% YoY
Operating Profit of $976M - down (4.12%) YoY
Operating CF of $2.2B
Up 0.35% after hours

Post 10/25 Q3 FY21' Earnings Analysis $FB, $KMB, $BRO, $LOGI, $LII
$FB - Facebook - reported earnings of $3.22/share beating estimates of $3.19/share - revenue of $29.01B vs. $29.57B estimates up 35% (YoY), net income rose to $9.2B up 17% YoY
Reported daily active users of 1.93B
Company said it’s adding $50B to its stock buyback program - helping lift the shares ~2% in extended trading
Expects Q4 revenue of $31.5 billion to $34 billion
$KMB - Kimberly-Clark - reported earnings of $1.62/share missing estimates of $1.66/share - sales came in at $5,01B a 7% increase YoY - bottom line declined from $1.72/share YoY
Profit reported of $745M down from $806M (7.6%) YoY thanks to a rise in costs of $480M. Increase in pulp & polymer-based materials, distribution, as well as energy costs led to a rise in input costs
These were somewhat offset by organic sales growth, reduced marketing, research and general expense as well as cost savings of $115M & $35M from the FORCE (Focused On Reducing Costs Everywhere) program & the 2018 Global Restructuring Program
Quarterly earnings were hurt by escalated inflation &supply chain disruptions leading to higher-than-anticipated increase in costs
$BRO - Brown & Brown - quarterly earnings of $0.58/share beating estimates of $0.52/share an 11.54% earnings surprise - revenues of $770.3M vs $674M a 14.3% increase YoY
Over the last four quarters - company has surpassed consensus EPS and Revenue estimates four times!
Shares have added ~40.2% since the beginning of the year versus the S&P 500's gain of 21%
$LOGI - Logitech - reported earnings of $2.45/share beating estimates by a whopping 126.9% - bottom improved $0.84/share YoY - net sales of $1.67B surged 85% YoY - gross profit jumped more 2x to $754.2M an increase of 122.1% YoY
Logitech’s Gaming segment sales soared 78% YoY $436.4M -Video Collaboration sales skyrocketed 218% YoY to $292.5M - Audio & Wearables segment sales jumped 87% YoY to $153M
$LII - Lennox International - reported quarterly earnings of $3.40/share - missing estimates of $3.64/share an earnings surprise of (6.59%) - revenues of $1.06B missing estimates by 6.11%
Over the last four quarters the company has surpassed consensus EPS estimates three times
The company has topped consensus revenue estimates three times over the last four quarters
Lennox shares have added about 14% since the beginning of the year versus the S&P 500's gain of 21%

SNAP: Post-Earnings Analysis!Hello traders and investors! Let’s see how SNAP is doing today!
SNAP is dropping more than 25% the moment I write this analysis, and it seems nothing can save it. However, even in the most stressful moments, we can use technical analysis to understand the situation.
Not by coincidence, SNAP dropped to the $ 57 area, which was a previous support on July this year. This is good, because SNAP didn’t drop to a random point, but the problem is that we don’t see any reaction.
There’s not a single bullish structure around, and this is the first thing required in order for it to reverse. We don’t see any bullish chart pattern in the 1h chart, and it is too soon to talk about candlestick patterns in the daily chart.
If we see a bullish reaction, it could be amazing, as the risk/reward ratio is looking good for those who are out of SNAP and want to buy it at the cheapest price possible. However, there’s no way we can buy without confirmation. As Livermore would say: “Don’t take action with a trade until the market, itself, confirms your opinion. Being a little late in a trade is insurance that your opinion is correct. In other words, don’t be an impatient trader.”
As far as we know, it could drop all the way to $ 49.90 again, and that would be great. Nevertheless, as someone who’s out of SNAP, I see this as a possible buy. Do you think a drop of 25% is fair, or the market overreacted?
Either way, I don’t think this is a sell. The risk/reward ratio makes no sense. If I were shorting it, I would probably buy it back today, and take advantage of this movement.
Before you leave, remember to support this idea if you liked it, and follow me to keep in touch with my daily studies.
Have a good weekend!

Post 10/21Q3 FY21' Earnings Analysis$AAL, $LUV, $BCS, $BX, $CMG, $INTC, $SAP, $SNAP, $T, $VLO
$AAL - American Airlines - posted better-than-expected revenue numbers, although down (25%) from Q3 of 2019 - shares were up +1.3% at the ended of the day, with this being their smallest quarterly loss since the pandemic
$BX - Blackstone - earnings nearly doubled YoY - reported an ATH of distributable earnings, success that’s largely driven by their focus on investing in high-growth areas of the economy
$T - AT&T - fell slightly after posting big subscriber gains -investors questioning the impact of promotions on the company’s future growth
$CMG - Chipotle Mexican Grill - reported better-than-expected EPS and revenue numbers - including a sales jump of 22% citing higher menu prices as a reason for the offset of rising costs
$SNAP - Snapchat - Snap fell (22%) after Q3 revenue missed estimates - thanks to its advertising business being disrupted by Apple privacy changes introduced earlier this year
