ISRG: Controlled Sideways Patterns Ahead of EarningsThe Medical Instruments and Supplies industry had stellar growth until 2022, when it could not beat that anomaly in revenue growth which was one of the primary reasons for the intermediate-term correction in 2022.
2023 patterned out the abnormal revenues and earnings for most industries that benefited from either the pandemic or from the government OVER-stimulation of the US economy via mega amounts of stimulus checks to WORKING people. Stimulus checks should have been allocated to the unemployed only. That would have lessened the impact of the resulting anomalies. If anyone had bothered to study pandemic history, the impact would have been much less severe for American families and the economy.
As with hundreds of stocks at this time, NASDAQ:ISRG is trending sideways. This is not a perfect platform yet, but the sideways action has some of the traits of a platform such as consistent highs and lows from the perspective of a weekly chart.
The stock is above its previous all-time high now, which provides a technical support level. The weekly chart shows that there has been Dark Pool accumulation and professional traders in the mix.
IF the earnings report next week shows steady growth in both revenues and earnings in the 1st quarter, and IF the CEO's projections are positive, the stock could have an HFT gap up. If there was a negative surprise coming, the CEO should have warned by now. HFTs can make mistakes and gap it down. But if HFTs trade it down, then the stock price will immediately run back up into that sideways price level.
If the report indicates a flat or minor improvement, then it is likely to remain within the sideways trend for another quarter.
A controlled entry above the highs of the current sideways action eliminates that risk factor for either swing trading or position trading.
Earningsreport

Time to Test Some Lower Levels for SupportBack in December when NVDA was trading in the 490s I posted an idea (linked) predicting it would make a run to 660. It went above and beyond that, and now its at a point where I'm exiting long positions and watching it closely for a chance to short.
At this point, I think it is still risky to short, but staying long is foolish. NVDA has started a distribution phase and has earnings as a catalyst this week. What remains to be seen is if this distribution phase will have an upthrust (UTAD) to achieve one more higher high, or if it will get its sign of strength to the downside. Bulls might ask why would it reverse now? - because increasing demand has become unsustainable with out making a pullback to establish some significant support below.
-----------------------------------------------------------------------------------------------------------------
Near Term expectations for price action:
- I'm looking to enter some near-term puts on other names next week, but I'm not playing NVDA until after earnings (there are better plays)
- But I think NVDA (and semis group) is arguably most important driver of overall market currently
*** 715 is the most important level
- If 715 holds as support NVDA will see a higher high in the coming weeks
- If it sees a sustained break below 715 then it will become bearish near-term and will need to test some lower levels for support before attempting new high
Chart - important areas explained:
** If NVDA is trading inside the shaded green diamond going into earnings then I'm expecting a gap up following the report to breakout above 742
3 most likely paths:
GREEN arrow (bullish): drop to test 715 going into the earnings report and then breakout above 742 - if this occurs my upside targets will be 777, 792 and 816 by end of March 2024
RED Arrow (near-term bearish, but will provide buying opportunity): break below 715 to around 697-707 and then test 715 for resistance but get rejected ( if this occurs I will buy Mar 1 puts, and my downside target will be 661-683 by 2/28-3/1 )
black arrow ("worst case" scenario bearish): I don't think NVDA will crash but its setup does actually allow that as a possibility if 661 fails as support)... in this scenario we will get the same price action as the RED path, but 661 would fail as support. If this occurs there is downside risk to 560 and my targets will become 619, 585, 560 .. This would actually be the best case scenario for traders ha $$$$ - not enough evidence yet to expect this but I am watching close.
See linked ideas of my previous NVDA long ideas if you need validation that I'm not just some doomsday preacher, I'm looking at it unbiased as possible.

Dollar Tree ($DLTR) Faces Headwinds Despite Revenue GrowthDollar Tree ( NASDAQ:DLTR ) encountered a tumultuous start to the year as it grappled with missed earnings estimates and recorded significant charges, signaling challenges in its store closure plan. While the discount retail giant reported revenue growth, uncertainties loom amidst liabilities and a cautious outlook. Let's delve deeper into the implications of Dollar Tree's recent performance and what lies ahead.
Earnings Performance:
Despite a 25% increase in earnings to $2.55 per share and an 11.9% surge in revenue to $8.63 billion, Dollar Tree ( NASDAQ:DLTR ) fell short of analysts' expectations. Market projections anticipated earnings to reach $2.66 per share and revenue to hit $8.67 billion. Same-store sales across the business rose by 3%, primarily fueled by a robust 6.3% increase in comparable sales at Dollar Tree ( NASDAQ:DLTR ) outlets. However, this growth was tempered by a 1.2% decline in same-store sales at Family Dollar stores.
Store Closure Plan and Charges:
Dollar Tree ( NASDAQ:DLTR ) unveiled plans to close approximately 600 Family Dollar stores in the first half of 2024 as part of its portfolio optimization strategy. Additionally, it aims to shutter 370 Family Dollar locations and 30 Dollar Tree stores over the coming years. However, this restructuring incurred hefty charges, including a $594.4 million impairment charge linked to the store review, alongside significant goodwill and intangible asset impairment charges. These charges resulted in a substantial loss of $7.85 per share for the quarter, a stark contrast to the previous year's earnings of $2.04 per share.
Guidance and Outlook:
Looking ahead, Dollar Tree ( NASDAQ:DLTR ) provided guidance for fiscal 2024, projecting earnings between $6.70 to $7.30 per share, compared to the adjusted earnings of $5.89 per share in 2023. The retailer anticipates consolidated revenues to marginally increase to a range of $31 billion to $32 billion. Despite challenges in the first half of the year attributed to shrink and mix levels, Dollar Tree ( NASDAQ:DLTR ) remains optimistic about favorable freight rates and reduced SNAP benefits providing a boost throughout the year.
Technical Analysis
With a Relative Strength Index (RSI) of 63, ( NASDAQ:DLTR ) is poised to maintain its bullish momentum trading above the 200-day Moving Average indicates ( NASDAQ:DLTR ) is in a continual trend.
Market Response and Conclusion:
NASDAQ:DLTR stock witnessed a sharp decline of 7.8% following the earnings report, reflecting investor concerns over the company's performance and outlook. Despite this setback, Dollar Tree ( NASDAQ:DLTR ) had shown resilience earlier in the year, with a 5.4% gain through Tuesday's close, and a 0.46% gain in Wednesday's premarket trading.

MSFT: The risks of selling shortNASDAQ:MSFT ran down yesterday but is reaching the low of the support today.
The next tier of support is outlined also from the Dec-Jan Buy Zone ahead of earnings season.
The risk day traders are taking selling short is if it runs below the low of the support and the Dark Pools surface to buy below its fundamental price level. This is why selling short is risky at this time. Support is around $397.
The big question is where are the lows for fundamental levels for the next quarterly report. MSFT had higher revenues with slightly lower earnings. The CFO did not adjust earnings. It could gap or run down on news, but fundamentals are not way below the current price.

SQ's rally looks unstable and weakSQ's recent rally shows weakness and not founded on solid reasoning. Current price level appears risky.
SQ had a good rally from Oct to Dec and contracted a fair amount and held. Later on....
SQ had bad earnings
NVDA a very unrelated stock had great earnings pushing SQ up
Recent gap up is clearly irrational
Recent rally is unstable and should expect a contraction in the nearish future

WDAY, this software company reports today LONGWDAY provides software for large enterprises; it reports Monday the 26th after market hours.
On the 15-minute chart, it is surging. A recent news catalyst was an upgrade to a target of
$ 350. My call options went double digits from a buy on Friday the 23rd at the opening
bell. This looks like a good one for earnings scalping whether it is with shares or a call option.
(The $320 call option for 3/1 is up 42% so far since the morning open). WDAY is part of the
AI trend; the real question is how much AI integration is built out at this time and what is
waiting for design and testing before deployment.

SNOW: Positive Technical Patterns Ahead of EarningsNYSE:SNOW is completing a long-term bottom formation that is only visible on a weekly chart. The company was highly touted at IPO but has struggled since then.
Candlestick patterns indicate pro traders in the mix right now. The stock reports earnings Feb 28th, next week. Candlestick patterns and Pro trader influence imply a possible good report this time around.

Elliott Wave: Nvidia pullsback ahead of earnings Hey all.
Markets can see some volatile price action today, because of the release of FOMC minutes, when investors will look for any new details or change in tone regarding FED's policy. But then, after the US close speculators will be focused on Nvidia earning reports. This data can be important, not only for stock it self, but also for the technology sector and bitcoin as well.
We will see how market react, but from an Elliott wave perspective market can still be in a corrective pullback, rather than making a topping pattern.
Lets see.
Grega

Bending Trends Can Warn of Institutional RotationThe Daily chart of NASDAQ:PANW shows a short term bend in the trend which is common when Giant Buy Side Institutions are in quiet rotation mode to lower inventory, attempting not to disturb price.
Also, Volume Oscillators and Money Flow indicate selling hidden mostly in price that is being carefully controlled.
The stock reports today. This doesn't mean that HFTs have this information nor does it mean that HFTs won't gap it up. It means IF you are holding this stock for a swing trade, risk has increased for a possible run or gap down.

NXE - Good earnings could lead to big profitsI like this chart a lot. Definitely a few resistance zones to watch out for above us (i.e green top of green tapered buying channel that has bounced us a few times) but we are within our strong purple buying continuation channel which is exactly what is needed to take us out of this resistance level.
We are also digging at the bottom of our controlled selling yellow channel with support from purple and teal continuation - so with good earnings expectations this could be a good level to enter at.
As always, will keep you posted once news is released and price continues to develop!
Happy Trading :)

BMRI: Hidden Bullish Divergence, New All-Time High Soon?Hello Fellow Stock Traders, Here's a Technical Analysis of BMRI!
After successfully overcoming a significant resistance area, BMRI (Bank Mandiri) experienced a subsequent pullback, thereby establishing a new support level. Analyzing the trend perspective, it is observed that BMRI's price movement surged above the EMA 34 Line, which is a promising indicator of a bullish trend.
Additionally, the stock has formed a symmetrical triangle pattern, accompanied by an impulsive breakout represented by a bullish candlestick formation. Such patterns typically imply potential upward momentum and are considered positive signs for further price appreciation.
Furthermore, the MACD (Moving Average Convergence Divergence) indicator has displayed a hidden bullish divergence, indicating the possibility of the ongoing bullish trend extending further.
In summary, the technical analysis of BMRI reveals multiple favorable factors, including the breach of a substantial resistance area, a bullish trend indicated by the EMA 34 Line, a symmetrical triangle pattern breakout, and the hidden bullish divergence on the MACD. Traders and investors may interpret these signals as potential indications of an upward continuation in BMRI's price movements. As always, prudent risk management practices should be employed before making any investment decisions.
It is essential to note that the analysis will no longer hold validity once the target/support area is reached.
Please support the channel by engaging with the content, using the rocket button, and sharing your opinions in the comments below!
Disclaimer:
Please note that this analysis is solely for educational purposes and should not be considered as a recommendation to take a long or short position on IDX:BMRI .

Fundamental Value Levels via Technical Analysis: GOOG ExampleNASDAQ:GOOG had a mega gap down on earnings news. The stock was simply over-speculated.
The price of this stock was way above the true fundamental values. So the stock gapped down to its current fundamental value level.
See the chart attached. The green rectangle outlines the last range where there were Dark Pool Buy Zones. Indicators like Accumulation/Distribution help to confirm a consistent level of accumulation.

$ALV - Ready to go!NYSE:ALV reported today and looks like a potential long.
I see here potential H&S breakout (106.60).

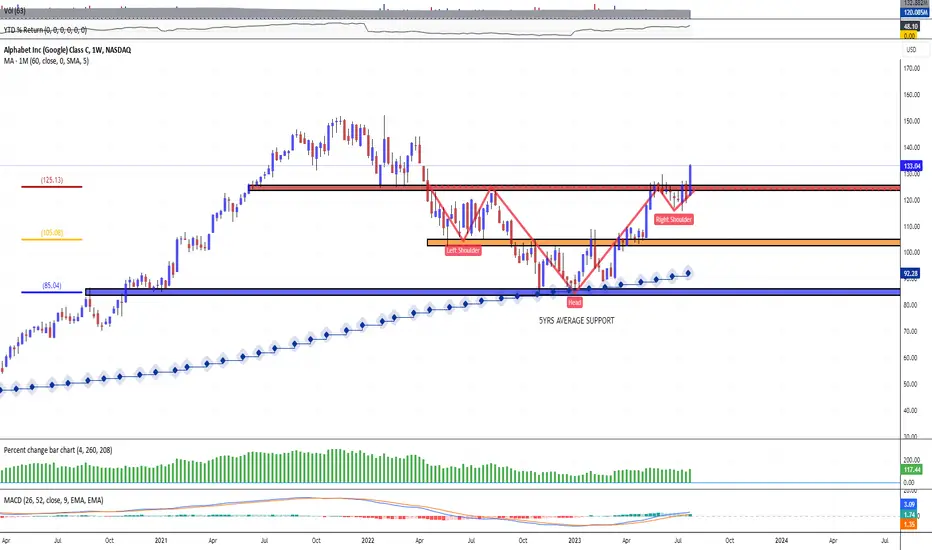
👋 Alphabet Inc (Google) — Bear Trap EscapeAmerican company Alphabet Inc. two days before has published a quartrely statement and announced an increase in net profit and revenue in the second quarter ended in June.
In addition, the company said its chief financial officer, Ruth Porat, will take over as president and chief investment officer of Alphabet and Google from September 1, 2023.
At the same time, Porat will temporarily remain as CFO of Alphabet and Google until her successor is found.
The company reported net income of $18.4 billion, or $1.44 per share, compared to $16 billion, or $1.21 per share, a year earlier.
Revenue, meanwhile, rose from $69.7 billion a year earlier to $74.6 billion, also above the market's forecast of $62.06 billion. Cloud revenue was up 28% year-over-year.
Comments by Sundar Pichai, CEO of Alphabet and Google:
“Our products and company performed well this quarter. Our continued leadership in artificial intelligence and our excellence in engineering and innovation are driving the next evolution of Search and improving all of our services.
With 15 products serving half a billion people each, and 6 of them serving more than two billion people, we have a lot of opportunities.”
Comments by Ruth Porat, Chief Financial Officer of Alphabet and Google:
“Our financial results reflect continued resilience in search with accelerating revenue growth in both search and YouTube, as well as momentum in the cloud.
We continue to invest for growth while prioritizing our efforts to long-term reorganize our company-wide cost base and build the capacity to deliver sustainable value over the long term.”
As announced on April 20, 2023, the Company has merged part of Google Research (the Brain team) and DeepMind to significantly accelerate advances in artificial intelligence (AI).
A group called Google DeepMind is reflected in Alphabet's unallocated corporate expenses starting in the second quarter of 2023.
Shares of Google rose more than 6 percent in premarket trading on Wednesday, with a lot of room for further gains.
Technical pictures indicates that major breakout of $125 resistance is happening right now, hitching the price above the neckline in reversed Head and Shoulders chart pattern structure.
TSLA Earnings After HoursTSLA reports earnings today after hours. QQQ is pretty overbought, but TSLA has been hammered down lately. Really interested to see what they do. I'm technically long shares, but not getting overly optimistic. Gapping down seems to be the crowded trade at the moment. We'll see after the bell!

Uninspiring Technical Patterns Ahead of NFLX EarningsLike many others, NASDAQ:NFLX has shifted to a wide sideways trend ahead of its earnings report today after the close. There is no pre-earnings run here. Current volume and price trend are not patterns that inspire a good earnings surprise.
HFTs are always watching news ahead of open on high-profile stocks to get ahead of retail market orders. A gap is likely at tomorrow's open.

Decide: Buy or Sell - Netflix vs. Tesla EarningsSome analysts anticipate that Netflix's stock could reach a new 52-week high above $500 per share following the release of its fourth-quarter earnings report this Tuesday. The $506 mark is considered a target, representing the price it fell to at the beginning of 2022.
Positive sentiment towards Netflix has grown as profit estimates have been revised upward 17 times since the last earnings report. The company's revenue is expected to increase by 11% annually to $8.71 billion, driven by the introduction of a new, lower-cost, ad-supported basic subscription tier and efforts to combat illegal password-sharing.
If the forecasted revenue materializes, it will mark the highest quarterly sales total in Netflix's 17-year history, representing an 11% increase from the previous period to $8.7 billion.
However, this quarter's earnings might not live up to the company’s last earnings call, which generated a ~15% bump.
Meanwhile, Tesla's fourth-quarter update, scheduled for release on Wednesday after the close, may have a different trajectory. Tesla shares declined by 4.4% after the last earnings report, experiencing their third consecutive earnings-reaction-day selloff.
A fourth occurrence is possible, although it's also possible that the bottom is in. It will likely come down to whether investors are disappointed in their forward guidance for the first quarter of 2024
Tesla's margins are expected to face pressure due to its ongoing price-slashing strategy in recent quarters. However, this might already be factored into the current stock price.
TSLA has shown a pattern of lower highs and lower lows since the peak in July 2023, and it remains to be seen if support will materialize at its support levels of $200 and $194.

Tesla reporting this week! $TSLATesla will report as soon as this Wednesday, Jan. 24, after the market close. Personally, I don't plan any trading activity here before the report. But at the moment the stock is in a technically interesting zone.
I see a double technical pattern here - Inv. Head and Shoulders. Based on the structure of the daily chart, the price is now in a potential right shoulder (RSh) zone, which could be a good area to start a position.
Meanwhile, the entire daily structure is a right shoulder (WkRsh) for the weekly pattern, which gives the current price zone more strength.
Of course, the report could break the technical pattern, but I will be watching and waiting for one of my triggers to occur.

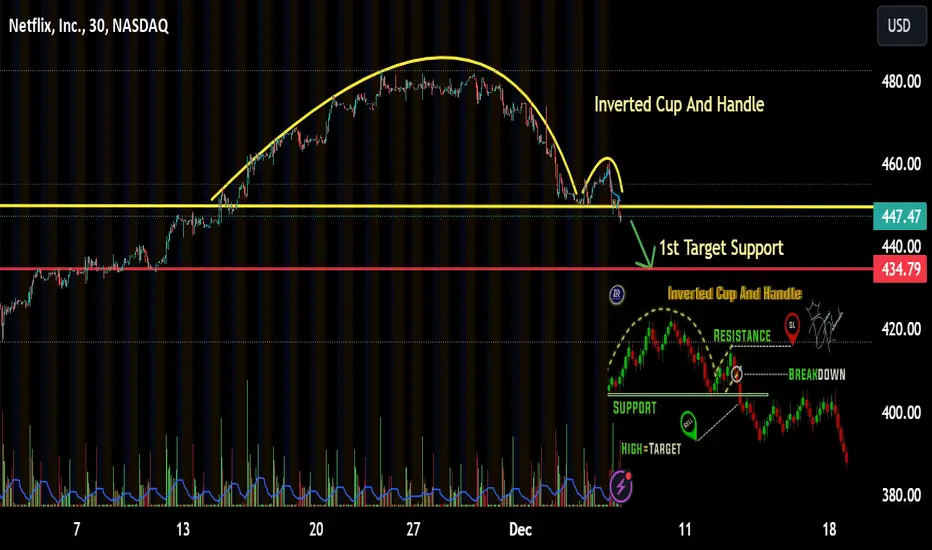
$NFLX Inverted Cup And Handle NASDAQ:NFLX I Found a Cup And Handle for you. My 1st target for next week would be 434ish area. Also tomorrows NASDAQ:AVGO ER should have an adverse effect on the market tomorrow along with eco data. It will be an interesting Thurs and Fri
MSTR Evening Star Poses Whipsaw Risk"Evening stars" are not as reliable as they used to be. They occur after heavy speculation and a steep angle of ascent. A few days ahead of earnings, NASDAQ:MSTR could not break through the resistance above.
The Gap up was HFT driven. This stock has a lot of retail interest at the moment, with every eye on AI. But the selloff from last quarter's reporting season is creating resistance on the daily scales. It is a very pricey stock for this market condition and the emotional state of most investors.
MSTR is likely to gap on earnings news as there are leaks out that it is going to be a blockbuster earnings report.

Pro Trader Patterns for Swing TradingThis important exchange has been doing very well with options and futures contract sales.
NASDAQ:CME had a classic pre-earnings run up fueled by professional traders swing trading, out of a platform support level.
The retracement was only a sympathy move with retail knee-jerk reactions due to the fear around the stock market at this time, not an indication of the company's earnings report or growth potential.
The stock is not at its all-time high level yet, so it can run further before slamming into strong resistance.
On the monthly chart, it has a Double Trough on DPO, which is a strong indication for the stock's long-term cycle.

IBM: A Risky Earnings TradeNYSE:IBM Reports after the market closes today. It is probably at or near its fundamental levels even if the report is weak.
The chart shows a strong support level as the stock price is at the neck of the bottom completion level.
IBM is in a long term trading range when viewed on a long term trend. The problem is a weak CEO who has failed at reinvention and a stock that is pricey for its growth potential.
However, it has more upside potential than downside. It would take a really negative report to create a strong run down. That is not likely.
PSHI is very low so less savvy investors own almost half the outstanding shares. This means trading the earnings report is riskier.

GOOG Sympathy Move Ahead of Earnings TodayThe run down to Monday was a sympathy run. It doesn't mean that NASDAQ:GOOG is headed for a bad report. Rather, retail investors are selling ETFs or moving money out of stocks into safe havens, or other adjustments to portfolios and 401(k)s. The selling dug into the most recent weak support level.
However, NASDAQ:GOOGL has not sent out any advisor in recent weeks regarding its earnings report. Any company this size, and as a veteran company of the stock market, would warn if earnings were going to miss the retail-side analyst estimates. So this is a sympathy move merely because the retail-side selling is moving big-name companies down at this time.
If it has a great earnings report, which the previous runs suggest , then the HFTs may trigger a gap up at open tomorrow. Alphabet had improvement in its quarterly report last quarter. Yearly revenues have been up for 4 years but earnings are up and down as it invests hugely in AI.
