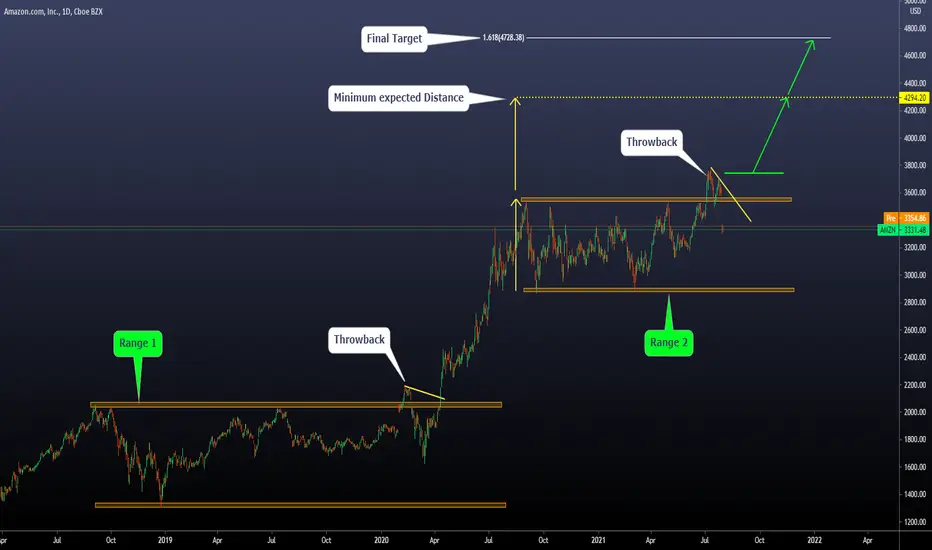
Breakin Ranges on AMZN, can we expect a repetition?Today, we will speak about the current situation on AMZN
- The price has been trading inside a range from September 2020 until July 2021 where we observed a Breakout.
-Currently, we can see that the price re-entered the broken range. What can we expect from here?
KEY IDEAS:
-From a technical perspective, it's extremely common that after daily breakouts (structures with a duration higher than 100 days), we observe a throwback (or a retest). As you can see on the previous range, we saw the same sequence.
-It's commonly accepted that the target of broken ranges is at least the size of it on the broken direction (we can see some notes of this idea on Wykoff Theory). That is the minimum target that we should expect.
With all that clear, let's go to the interesting thing, what is our view on this?
IF the price breaks the descending trendline of the current throwback and reaches our green activation line, we will take that as a confirmation of the bullish movement towards the minimum target, of course. At those levels, you should be protecting your capital by moving your stop loss to the entry-level (that is what we do). From there, we want to let the price keep going up towards the final target at 4700
Let's speak about the stop loss and risk:
-IF the entry is executed, we always set our stop loss below the throwback, and we use a risk between 1% to 2%, never more.
-IF the entry is never executed and the price keeps falling, and we lose acceptable risk-reward ratios, we will cancel this idea.
-IF everything goes as expected, we think this movement can last 150 to 200 days
Thanks for reading!
Ecommerce
Grocery App Dingdong Maicai: Sky-high GMV, High Costs amid IncreThe popular fresh on-demand e-commerce platform has built its competitive strength in just three years.
Dingdong Maicai has maintained a high growth over recent years, achieving the largest GMV and user base in the sector.
High fulfillment and marketing costs, increasing competition between top players and a somewhat fragile business model are the main challenges facing the company.
Impacted perhaps by Missfresh 's bad performance on the IPO day, Dingdong reduced its ADS offering amount, with some investors turning bearish on the newly listed shares.
We deem the stock undervalued.
On June 29, 2021, Dingdong listed its shares on the New York Stock Exchange with the ticker of 'DDL.' Just one day before the IPO, Dingdong submitted a new prospectus, reducing the size of the offering by 73.5% (from 14 million to 3.7 million ADSs), which was far lower than the funding it raised in Series D and D+ in H1 2021 (USD 87 million vs. USD 1.03 billion). On the first day of listing, the stock rose by more than 19% to break through USD 40, but the momentum disappeared rapidly. As of July 7, the share price had fallen below the level of USD 27, showing a lack of investors' confidence.
Launched in 2014 as an app, Dingdong was transformed into a food logistics company that provides fresh on-demand e-commerce services, building an efficient supply chain. When a user places an order, the goods are distributed by frontline fulfillment stations (warehouses) near the user and delivered within 29 minutes, as the company claims.
To date, the company has accumulated a huge user base – 30 million accounts nationwide. According to its latest prospectus, as of March 31, 2021, Dingdong had set up 950 frontline fulfillment stations in 29 cities in China and developed over 12,500 Stock Keeping Units (SKUs).
The CEO, Changlin Liang, is a serial entrepreneur. In 2003, he founded parenting discussion platform iYaya.com, which achieved an annual net profit of over CNY 26.5 million, attracting over 70 million mobile users by 2016.
Since 2017, Dingdong Maicai has raised over USD 1.75 billion and has been supported by several famous institutional investors, such as SoftBank and Tiger Global Management. Before the IPO, the CEO and other board members held 58.9% of the firm's shares. Now, Tiger has become the largest institutional investor, holding 5.7%, while SoftBank has 5.6% of the grocery platform's shares.
Financials: an outlook typical for a growth-stage company
Dingdong maintained a growing momentum over recent years. According to its prospectus, Dingdong achieved revenue of CNY 11.34 billion in 2020, surging 192% year-over-year. Its gross merchandise value (GMV) increased from CNY 740 million in 2018 to CNY 13.03 billion in 2020, with a CAGR of 319%, indicating a grandiose expansion.
Meanwhile, Dingdong has been suffering from substantial losses. In 2019, the net loss of Dingdong was CNY 1.87 billion and continued to increase in 2020, hitting CNY 3.18 billion. The net profit margin improved over the same period from -48.3% to -28.0%. In the first quarter of 2021, the company reported a net loss of CNY 1.38 billion or more than five times of that reported in the March quarter of the previous year. The company's expansion in the community group buying field pushed the margin back to -36.4% in that quarter.
The company's high expenses are an apparent bottleneck. According to its prospectus, the cost of goods sold (COGS) and fulfillment cost are two categories showing the highest figures. The latter, for one, reached CNY 4.04 billion in 2020, up 109% year-on-year: while Dingdong is expanding its business, its operating cost is also rising rapidly. Nevertheless, the fulfillment-expense-over-revenue ratio decreased from 50% in 2019 to 36% in 2020, showing a slight improvement.
Money-burning business, intensifying competition
On-demand e-commerce businesses in China usually rely upon two primary modes of fresh products distribution: the so-called 'community group buying' and instant delivery. The former type allows to cut logistics costs but is mainly focusing on the frozen products due to the time lag between the wholesale and individual purchases.
By contrast, delivery through frontline fulfillment stations is well suited for working with fresh products. Along with the consumption upgrade, delivery through frontline fulfillment stations attracts more and more users. According to Chao Sun, a Strategic Investment VP at Red Star Macalline, the penetration rate of online fresh food in the Chinese market was less than 10% in 2020, indicating a great potential in the sector.
Dingdong is implementing a frontline fulfillment, station-based model. Providing cultivation standards for upstream agriculture, this mode is a prerequisite of building an ecosystem foundation of the supply chain. Such a system allows farmers to optimize their production, meeting the market demand.
Dingdong's competitive edges are valuable for maintaining a steady position in the market. Also, the processing centers and frontline fulfillment stations now have expanded offerings from fresh produce to other daily necessities, including ready-to-eat, ready-to-heat and ready-to-cook (3R products), plants and home/personal care products. The company's product scope is likely to further expand in the following years.
But the new lucrative sector attracts other players. Since 2011, the number of newly registered fresh e-commerce companies has been climbing at a 20% CAGR, reaching 4,103 in 2020.
At the same time, the competition among the top players is becoming sharper. One of Dingdong's main competitors is Missfresh, a company following a similar business model. Dingdong's larger SKU figure (12,500 vs. 4,300) and broader clout in China (29 vs. 16 cities covered) puts the company at an advantage over its nemesis. Dingdong's strategic moves have also proven to be more to the point. For instance, it almost immediately started focusing on China's third- to fifth-tier cities in early 2020, as the epidemic began. Owing to this and other strategic decisions, in the first quarter of 2021, Dingdong's revenue increased by 46%, while Missfresh 's decreased by 9% year on year.
While there are a few other rivals in the field, competition is not the largest of Dingdong's concerns. Its complex supply chain requires well-coordinated but flexible operation mechanisms to facilitate rapid expansion. Small errors in these mechanisms can lead to considerable losses to the company.
Valuation
Though the stock, along with those of many other Chinese tech companies, has been recently dumped by some investors, we remain optimistic about the company's potential. The average EV/revenue ratio of its five industry peers – MF, PDD, KR, GO, and MPNG.F – is 5.23x, indicating a 12-month target price of USD 38.11. Enhancing profitability and reducing fulfillment fee rates will be key in achieving further progress.
For the full article with the charts, please visit the original link.

PINDUODUO Inc. (PDD) | Chinese E-commerce Inside a Buying Area!Hi,
Pinduoduo Inc., through its subsidiaries, operates an e-commerce platform in the People's Republic of China. It operates Pinduoduo, a mobile platform that offers a range of products, including apparel, shoes, bags, mother and childcare products, food and beverage, fresh produce, electronic appliances, furniture and household goods, cosmetics and other personal care items, sports and fitness items, and auto accessories. The company was formerly known as Walnut Street Group Holding Limited and changed its name to Pinduoduo Inc. in July 2018. Pinduoduo Inc. was incorporated in 2015 and is headquartered in Shanghai, the People's Republic of China.
Technically speaking, the price of PDD has landed inside the possible rejection area. Quite strong criteria matching each other around $81 to $106:
1. Fibo 62%
2. Minor trendline
3. 50% from the ATH
4. Role reversal
5. Round number
Do your own fundamental research and if it looks attractive then you have the technical confirmation from my side to buy it!
Regards,
Vaido

Global-e Online: Strong Price Action in Recent IPOA lot of recent IPOs have struggled, but strong price action has stood out in one particular firm: Global-e Online.
GLBE went public for $25 on May 11. That doesn’t provide much price history to analyze, but some patterns stand out.
First, the stock ripped to new highs in late June, then pulled back to hold its rising 21-day exponential moving average (EMA).
Second, notice how it bounced slightly above $51 on July 6 and 8. That was the high on June 16, which suggests old resistance has become new support. Previous stair-stepping occurred around $33.25, $35.75, $39.50 and $45.
GLBE is closely associated with Shopify , helping smaller businesses compete globally. Revenue more than doubled in the last year. The growth story could be especially interesting, given its access to this immerse but fragmented market.
TradeStation is a pioneer in the trading industry, providing access to stocks, options, futures and cryptocurrencies. See our Overview for more.

$AMZN breakout @ $3500?*Before reading the information in this please understand the risks associated with both the stock market and investing as a whole. ALWAYS do your own research; invest with conviction, rather than emotion.*
*Please understand I am in no way a professional and offering investment advice, all ideas shared are simply opinion.*
*I work with a team of individuals that does research into potentially undervalued publicly traded companies. We use a mix of fundamental and trend analysis to formulate a trading plan for our securities.*
I hope everyone is enjoying their 4th of July weekend, you know everybody at the @SimplyShowMeTheMoney team is.
Nobody is arguing with Amazon's performance in the market in the last several years, the multi-facet company is continuing to dominate the industries they touch in 2021. Amazon ($AMZN) has a lot to look forward to in the next few weeks, most especially this coming week. Current CEO Jeff Bezos is expected to step down tomorrow, July 5th. Bezos is expected to maintain a large roll in Amazon's operations, moving to the roll of Executive Chair; Bezos will act as a special advisor to incoming CEO Andy Jassy.
Knowing Bezos will remain at large on Amazon's Board of Directors allows the corporate giant to turn a new leaf as a company with this transfer of leadership. It is no surprise Amazon broke through a $3500 resistance this past Friday with this news trending, but the company also has quarterly earnings reports to look forward to July 29th. They are expected to achieve a 12.21 EPS, but investors know that Amazon has a tendency to smash expected earnings; this trend being true these past four earnings reports.
The breakthrough of a $3500 gives Amazon room to run the rest of this year. A long term bullish trend is apparent, this trend started in March 2020 when Amazon was trading at a share price of $1500. Jassy taking over as CEO paired with another expected smash-hit earnings report could give Amazon momentum to smash through
the still-seen $3500 resistance level, and eventually push a $4000 share price.
My team is seeking an entry this coming Tuesday, July 6. Our price points are as follows:
ENTRY: $3500
STOP LOSS: $3150
TAKE PROFIT 1: $4000
Be sure to follow me @bigshotrob for future updates and posts.
Check out my team over at @SimplyShowMeTheMoney
Members of our team are followed there.

AMZN the no-brainer stock.In today’s post, I will be covering Amazon($AMZN). I am sure you all have heard of the company due to do its reign in e-commerce. However, that is just a drop in the bin. I believe that cloud computing, AWS, is the main driver of its net income. I will not get into specifics but they are powering big-name players like; Netflix, Twitch, Facebook, LinkedIn, Twitter, etc. Along with their e-commerce and cloud computing, they offer one of the best streaming services that will soon be broadcasting global events such as NFL, Premier League, and more. Additionally, they own a large market share in gaming and audiobooks through Twitch and Audible. Did I forget to mention they own Whole Foods, an outlet for retail distribution?
They are revolutionizing everything they do while providing low prices to consumers, one of the main reasons I think they will not be broken up. However, today’s headline, “Biden Weighs New Executive Order Restraining Big Business” (WSJ), brings some skepticism. Regulation in various facets is their biggest headwind. Nonetheless, even if they are broken up, you would still want to own the previously mentioned businesses in isolation.
As seen in the image, the company has been trading in a range from 2900-3500 (Red/Blue horizontals) for about a year now, while the rest of Mega-Cap Tech (Microsoft, Apple, Google, Facebook) has steadily made all near all-time highs. I think it is on the verge of a technical breakout (breaking out of the previous trading range) as they continue firing on all cylinders and growing the business vertically and horizontally.
In the world of finance, I often do not like to make decisions in isolation. That being said the conjugation of all previous factors provides a decent investment thesis. It is currently around $1. 74T. I think it will, sooner than later, cross the $2 trillion market cap, (+12%) that competitors Microsoft and Apple smashed. Could you imagine a world without Amazon? It wouldn’t be better in my opinion and I do not see that changing in the near future. In the long run, the companies growth will slow and the company will transition away from reinvestment to shareholder distribution (dividend).
Con: Regulation + Tech Drawdown + Treasury Rate Increases
Pro: Businesses + Technical + Smart Money

Alibaba warms the engines for a full-bodied climb ?According to algorithmic advisor Market Miracle $BABA is ready to rise again.
In fact, an input signal was produced at a price of USD 211.06 for a target of USD 235.59 or a potential profit of 11.62%
According to the reference sites that I follow for the fundamental analysis, Alibaba is a healthy, well capitalised company that has no particular risks and is below the fair price of about 32 %.
Both the reasons of which I am have made me interested to the Stock and analyzing it from the graphical point of view I would expect a price action similar to that one from me imagined on the diagram.
I will definitely take positions on the title in the next few days.
This idea is based on the signal generated by the Marketmiracle advisor whose link you can find by scrolling at the bottom of this page.


9988.HK Alibaba Pyramid of Doom over soon?After all the apocalypses they experienced since last year, It seem china BABA, gaining momentum soon. What's your take?

BABA - 1D candle - Long Above 220$ BABA can interest me for a cute swing.
This stock is a strong company, with good Revenue, future prospects and technological innovations.
China’s e-commerce is testing a critical point in the graph as it reaches its rising trend line, outlined from the start of its IPO.
--------------------------------------------------------------------
Recent News (Fundamental):
* It announces that it will produce robots that will enter the Chinese economy.
* It announces that it will start producing electric trucks.
-------------------------------------------------- -------------------
The average analysts' rating by "TipRanks" is positive.
With a consensus of 25 buy recommendations right now!
-------------------------------------------------- ------------------
technical analysis :
Above price 220$ it will prove that it breaks the descending triangle
Under 195 I would less recommend holding it
PT1 - 268.50$ (Conservative)
PT2 - 297-300$
-------------------------------------------------- -----------------
* For traders who like to measure price levels with Fibonacci, it appears for you in the graph, from the highest price to the price at which the stock is currently
* There is no recommendation, you are big kids, do your research .. I just share with you my trading ideas
* Let me know what you think, your opinion is important to me !

JD falling wedge, long on breakout Holding 80c 1/23, 80c 1/22
Gap was filled, triple bottom
Growth every quarter

Alibaba is in the zoneA market capitalization similar to what it had in January 2020 despite growth, a greater presence of e-commerce and good future prospects in various sectors.
In trading area according to the volume profile since October of last year.
In long-term uptrend.
It is closing a triangle, from my perspective it would be close to looking for a breakout.
MACD hitting the bottom, announcing a reversal signal.
It has strong support around $ 210-200.
Resistances at 250, 270 and 300.
Sounds like a good entry point to me.
NYSE:BABA

Stag: trendlines broken new lines filled STAG ...what can we say technical about it.
The purple is a long term July '2017 trend line and the pink is a Aug '2018 trend.
We pass the 2017 trend line and are now touching, ever so slightly, the 2018 trend line.
We passed all resistance levels (long ago) and we are $3 a share away from the 50MA.
In the short term we expect some profit taking and a pull back but with the limited supply of large industrial spaces (suitable for ecommerce or distirubtion) we don't see a problem keeping these levels in tact.
Happy upside trading on STAG

WMT 1Q Earning Target 2021WMT flopped its fourth quarter earnings in 2020 announcing -.74 cents a share. I expect a report with a lot more strength with integration of E-commerce into it online store models as well as less fear surrounding COVID-19 creating boost in sales. With only 1% of shares floating short, The slow grind up, which has been evident since the middle of March, is likely to continue without any strong resistance. Being the largest retailer in 2019 boasting 523 B in sales (NRF.com) doubling AMZN sales, this stock is a solid frontrunner as we move into a post pandemic economy. The NFP report on April 2nd of 916k (almost double the previous month report) compared to the 652k estimate is also encouraging as this could lead to more consumer spending. Still to come this month are MOM retail sale reports on the 15th and 16th which will could potentially back this thesis. Furthermore, with the market creating new highs quickly, there could be a tinge of uncertainty or heightened volatility as the rally hasn't really had much catalyst other than jobs, but with WMT's Beta of .47 (Zachs) this stock is relatively safe. With a debt to equity ratio at a 2 year low as well, this stock is definitely a strong buy in my opinion and I have set my post earnings target for 160 with this stock. This would be an all time high and about a 2% increase from current highs which is definitely within reason all things considered.
$JMIA 4/6-7 UPDATE (Technical Analysis) Video breakdown on $JMIA going into 4/7 Up over 4% today with a nice bullflag into the 1hr 9ma. Should see at least $41 tomorrow if the market trends up.

BIGC potential falling wedgeBreakout? Possible. Got spreads for 60/70 May. Shopify will have a good run off its double bottom and this will move in sympathy.

BIGC: Searching for bottom (more pain or attractive entry?)I'm still somewhat bullish on NASDAQ:BIGC (been feeling uber bearish so going to post this long play for balance) Price is looking for support but larger market factors can lead to continued sell pressure. Accumulation is the name of the game here. Bearish divergence building since Dec. '21. Loose stop on this one. Targets and additional info on the chart.

Facebook Is Attempting a BreakoutFacebook has gone nowhere since August, but now the social-media giant could be squeezing toward a breakout.
The first interesting chart pattern is the descending trendline running along the November and January peaks. Prices are now challenging that line.
Second, notice how the 50-day simple moving average (SMA) tried to serve as resistance in late February and early March. But then the rising 200-day SMA emerged from below as support. (See the red and green arrows.) Prices are also breaking above the 100-day SMA.
Next is the $255 area. This was near the top on July 31, when FB gapped higher on strong earnings. That level was another source of support in the recent consolidation pattern along the 200-day SMA.
Finally, notice how MACD is now turning bullish for FB.
The fundamental story could also be interesting because advertising revenue has been strong across the Internet space. Additionally, FB is a member of Communications . That sector, created in September 2018, has broken out as other Nasdaq-heavy buckets like Technology and Consumer Discretionary remain below old highs. Thanks to advertising, Communications may offer the cleanest cyclical exposure of the three.
TradeStation is a pioneer in the trading industry, providing access to stocks, options, futures and cryptocurrencies. See our Overview for more.

E-commerce dislocation The main competitors of e-commerce, including Ebay, Amazon, MercadoLibre, Jumia, Square, PayPal, Pinduoduo, Etsy, Shopify, JD and Alibaba, are experiencing a major correction, some are touching crucial support levels, so there is the possibility of rebounding, but also the possibility of them falling further.
In any case, they continue to belong to a growing sector with future potential.

ETSY testing 50EMA presents a buying opportunity since OctoberWe had speculated that ETSY will present a solid buying opportunity, and it did on a dip down to $190 right before earnings and blew it out of the park. ATH today! Should continue bullish trend unless there's broader market capitulation.

Support and Resistance for SHOPThe dashed lInes repersent some weaker support and resistance where I expect some price reactivity. The solid lines are historical supports and I expect for rejection or larger moves to take place off of. Lows have been swept up last week with large volume which could be a combination of short covering or confident buyers adding to their position. This is significant because it shows that despite the markets downturn, there is still some bullish activity in the stock. This stock has a beta of 1.56 so it will be generally more prone to market volatility. After a worse than expected Earnings report coming in at .99 a share (1.24 expectation) the stock corrected from its pre earning run up. From here a full retrace to 1204 which was a generally accepted price between buyers and sellers is possible. There is also the possibility that price runs back up to the gap at 1322-1335, this could be a very reactive area. Sitting under the December highs I would say that there isn't much of a bull bear bias for this stock quite yet as the market corrects and with the bad earning's report. Note that while Shopify is a leader in it's category- companies like e-Bay, Amazon, and Walmart all offer integrated e-commerce. Furthermore BigCommerce now offers their sellers a chance to directly market and sell their products on the Walmart Marketplace which could be huge for the brand.

SHOP - Nice bounce- going to $1460If you saw my previous post "SHOP- The Big Picture" then you would see that SHOP has bounced at one of my trend lines higher than I expected. I have followed this stock and made a lot of money on it since the $200's. I really think after Friday and the bullish close that we are going to $1460 were there will be resistance. Can we break through the 52 Week High recorded recently? That will be a major test. If it does pass $1500 the next peak will sell off so be aware of that.... GL!

Bull Flag (long)Ozon Could test $80 before the end of the month, if breakout is confirmed.
Personally going to buy June Calls ( Q4 Earning March 30 )
Strong Growth in Russia eCommerce and holiday season earning could make Ozon go Parabolic.
(Not Advice) , do your own DD, I am a novice investor.
