A breakout for BNB looks imminentAccording to its range, the technical target for BNB in this cycle is $2,100.
Economic Cycles

Solana possible reject off the 21 smaThis is just an observance that I've made. The last time we rejected off this 21 sma, we dropped 93% to the bottom. I am by no means a bear, but I like to read what the charts are telling me. Bitcoin rejected in the same exact way last cycle but blew through it this cycle. Maybe this will change things. Let's just keep on eye on it.

bullish bitcoinonce the 4hr candle turns bullish an entry and stop loss
tp 1 = 105,000 (and move stops to break even)
possible targets 110,000.

XAUUSD (GOLD) favors rally to new highXAUUSD (GOLD SPOT) ended the double correction at 3120.205 low and expect continuation in daily bullish sequence targeting 3635 high. Above 3120.205 low, it expects at least 3 swing bounce or continue bullish sequence. A break above trend channel will confirm the more upside.

Bitwise Bitcoin ETF | BITB | Long at $46.25It definitely should get everyone's attention when a US Senator (David McCormick) is willing to dish out up to $600,000 in a Bitcoin ETF ( AMEX:BITB ):
Feb. 27: Bought $50,000 to $100,000
Feb. 28: Bought $15,000 to $50,000
March 3: Bought $50,000 to $100,000
March 5: Bought $15,000 to $50,000
March 10: Bought $50,000 to $100,000
March 11: Bought $15,000 to $50,000
March 13: Bought $15,000 to $50,000
March 20: Bought $50,000 to $100,000
Something may be brewing this year with the "U.S. crypto reserve" and I'll throw down a couple grand at $46.25 with a self-proclaimed wild prediction into 2026: Bitcoin to $120,000.
Bitwise ETF Targets:
$50.00
$55.00
$60.00
$65.00

BTC Primary trend. Secondary - expanding triangle.Logarithm. Time frame 1 week. Linear for clarity. Now the price is in consolidation in the key resistance zone of the "psychology 100" zone. Everything is as before, nothing new.
The price moves from dynamic zones of support and resistance of the large channel, and with the observance of the proportions of decreasing % from the previous maximums and minimums, adhering to a conditional 4-year cyclicality. Which is also initially embedded in the Bitcoin halvings, and the understanding of increasing demand, with a decrease in supply through halvings (but, here is a nuance with ETF, that is, conditionally with "fake bitcoins", which significantly increases the supply).
With a huge degree of probability, in the next cycle (possibly the final one), Bitcoin will be driven above or around $ 1 million, depending on the maximum that will be set in this cycle. Perhaps it will be much higher (parabolic growth as at the end of 2017) than the average distribution price. Mass digitalization is underway... and there are more and more dollars, they need to be somehow utilized in the future.
I specifically refreshed the old ideas of the main trend (2 and 3 years ago published) of this scale, and made it on a linear chart, for greater visualization of the trend direction and patterns that are formed on a smaller scale.
BTC/USD Secondary trend cycles and halvings. 1 07 2022
BTC/USD Halving 518 When will the minimum and maximum price be cycles. 27 09 2023

EGX30 Neutral Zone AnalysisEGX30 stock is currently in a neutral zone, between the 31,970 resistance line and 31,424.07 support line, reflecting the buyers' and sellers' wait and taking their time for market analysis, especially with the investment atmosphere that is full of unaligned points of view. In case of taking an upward trend, it is expected not to breach the resistance line at 32,464.493 points, but in case of falling, it's expected not to break the support line at 29,989.245.

BTC | New ATH Incoming | + 135% ??A very interesting fractal from 2021 lead to a 135% increase - and a new all time high.
Bitcoin has been following similar patterns to the bullish twin-peaks in 2021. After a multi-month correction, the price proceeded to increase another 135% over the next few months. Some weeks fast, and some weeks sideways.
Is it possible that BTC follows a similar pattern - and increase another 135%, all the way to 170k?
Hec, I'd even be happy with just a 100% ! That would lead us up to around 149k, which can also be considered a phycological resistance zone.
While you're here! Check out this post on PEPE:
_________________
BINANCE:BTCUSDT

DXY 1W Forecast until the end of MAY 2025Up-trend will resume and last until the end of February 2025 topping no higher than 114. Current bottom is in at 105.9
Hence, it shouldn't fall below.
After February a consolidation period of 1,5 months will trap price action between the bottom of 122.16 and upper level of 114.9
The spring squeezed during consolidation will provide enough energy for further upwards movement starting in the end of April 2025. This will ignite a chain of devaluation of national currencies followed by epidemic inflation across the globe. This will finish/cool-down at DXY reaching the mark of 148.
New reality after May 2025?

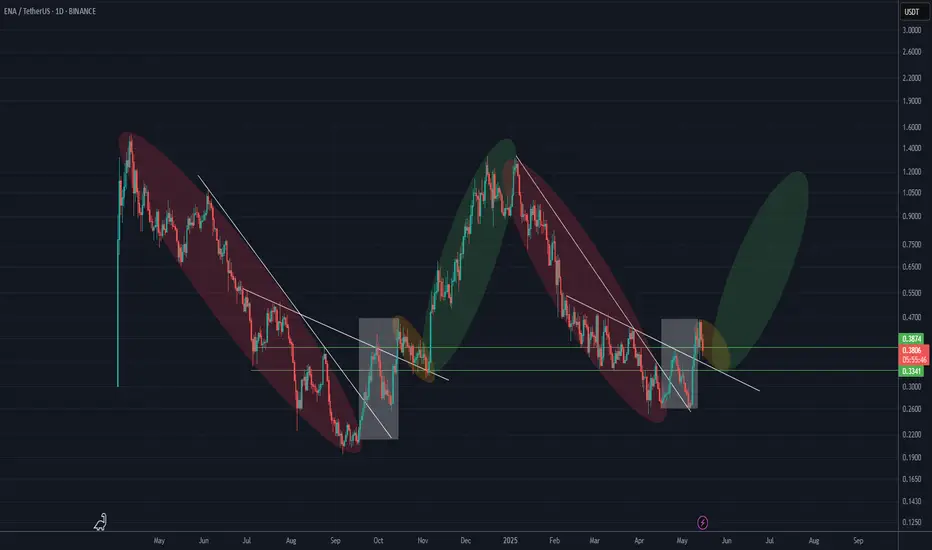
ENA is repeating a bullish fractal (1D)Look at the red, white, yellow, and green boxes in order, and then pay attention to the white trigger lines. You’ll notice that the previous phases | the end of the bearish trend (red box), followed by a bullish move for breakout (white box), then a pullback (yellow box), and finally the main bullish move (green box) | are now repeating.
Also, the price is currently sitting within the trading range marked by the two green lines, which is a key area. After the pullback is completed, a bullish wave is expected to begin, potentially reaching at least around the previous all-time high (ATH).
For risk management, please don't forget stop loss and capital management
Comment if you have any questions
Thank You
Bitcoin Dominance $BTC.D just bounced off the 62.0%Bitcoin Dominance just bounced off the 62.0% zone and held the 100 EMA.
Altcoins had a moment — but the tide may be turning.
📉 Pullback held above key demand (61.0%–61.5%)
📊 Now reclaiming 62.7% with EMAs curling up
💥 Break above 63.5% = renewed pressure on alts

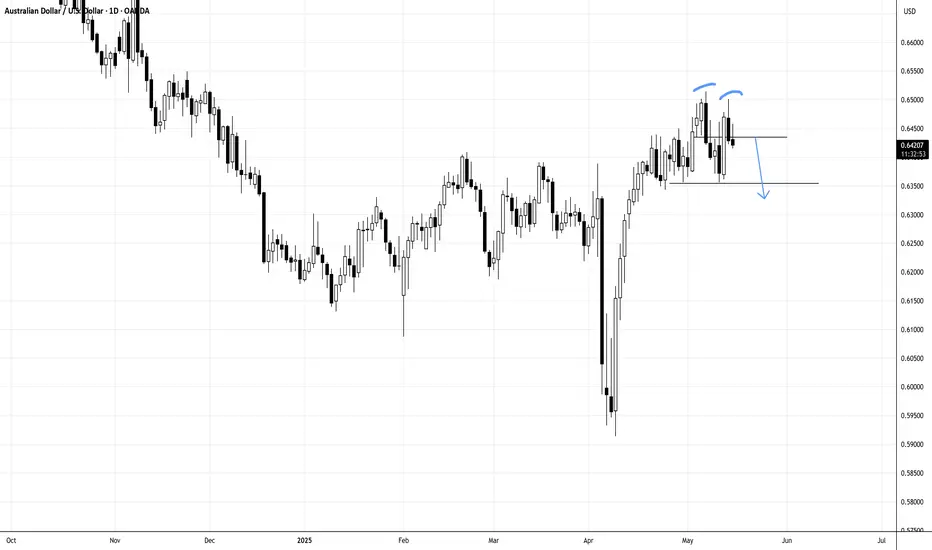
AUDUSD IN DOUBLE TOP, MAY REVERT TO ITS MEAN...AUDUSD
N.B!
- AUDUSD price might not follow the drawn lines . Actual price movements may likely differ from the forecast.
- Let emotions and sentiments work for you
- ALWAYS Use Proper Risk Management In Your Trades
#audusd
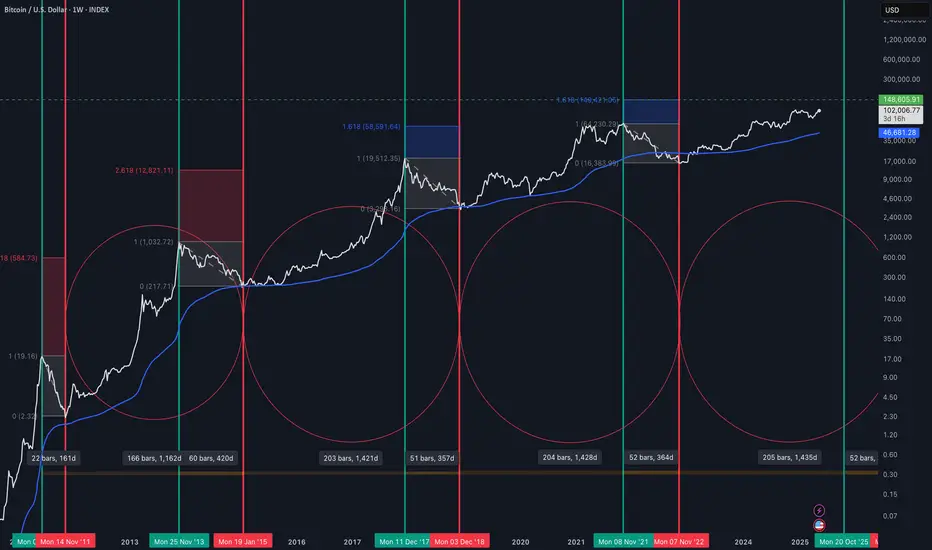
Bitcoin SeasonalitySince 2013, the distance between each Bitcoin bottom and peak is approximately 205 weeks. Similarly, the distance between the peak and the bottom is approximately 52 weeks. In addition, when the Fibonacci correction is applied to each bear season, the new target appears to be the 1.618 region, so Bitcoin currently has the potential to run to 148k. As long as seasonality continues, the peak will come at the end of 2025.
History repeats itselfOANDA:EURUSD
Here’s a technical analysis of the higher timeframes, specifically the monthly chart for EUR/USD.
As clearly visible, price action is currently moving within a respected descending channel. The saying "history repeats itself" seems particularly relevant here, especially in the context of Trump’s presidency. While this topic has been discussed frequently, I wanted to highlight the striking similarities once again.
The current market cycle closely mirrors the previous one from 2016-2017 — in terms of structure, timing, and volume. At present, we appear to be in the distribution phase, which is far from complete.
It’s quite plausible that we may see further downside before another significant move to the upside begins. If we take the 2017 distribution phase as a reference (lasting approximately 300 days), the current phase has only been unfolding for around 80-100 days.
Of course, there is no guarantee that price will rise again — but I consider it very likely that this market cycle has not yet fully played out. Technical analysis on higher timeframes often provides stronger probabilities and a clearer picture of the overall trend.
On the right-hand side of the chart, I’ve marked a weekly imbalance (not directly visible on the monthly chart), which aligns with the 50% retracement level of the Fibonacci tool. I view this confluence as a strong potential entry for a swing trade targeting the upper boundary of the descending channel.
This outlines my current trading outlook.

XAUUSD DAILYHallo everyone,
Volume indicator, basic but powerful
Price move also the volume increase, if not increase.. this is the question..
i will be keep on short this trade, cause the volume not increase too

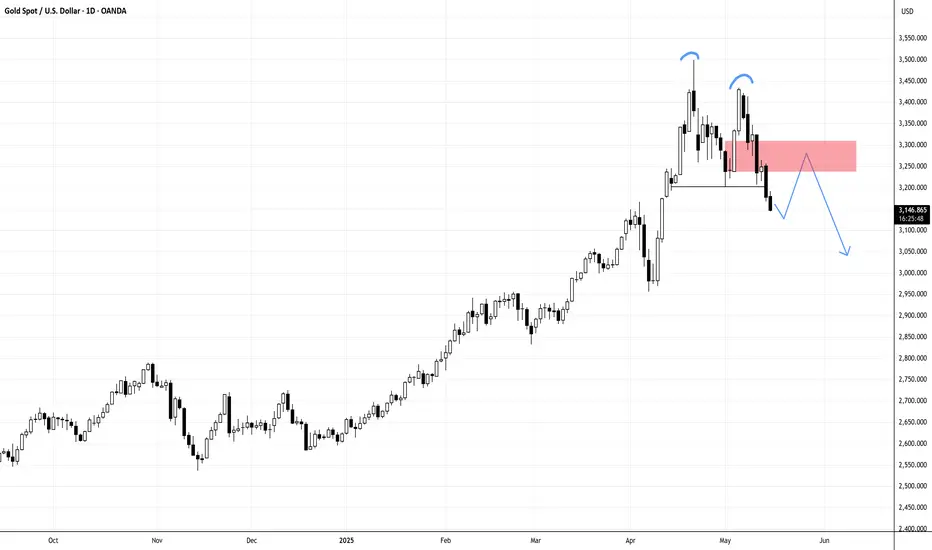
Gold Bearish Outlook Will Drag Price Further Down!Gold has just closed below a low (making lower high and lower low); a price pullback above 3,200 will likely cause XAUUSD price to further go down...
N.B!
- XAUUSD price might not follow the drawn lines . Actual price movements may likely differ from the forecast.
- Let emotions and sentiments work for you
- ALWAYS Use Proper Risk Management In Your Trades
#gold
#xauusd
$BTC 55 EMA Cross Over 50 W MA on a Daily Chart 162% Gain?
The last time that the 50 Day MA crossed under the 50 Week MA and the then the 55 EMA crossed over the 55 EMA it took 8 bars or 56 days. This move led to about a 162% gain.
The same thing just happened today, the 56th day within 8 bars, the 55 EMA crossing over the 50 Week MA. The Stoc RSI, RSI, and MACD are near the same or very similar values.
Will history repeat?

EURUSD/M15
💫 The Euro structure is bearish in the higher time frame, while we have a bullish trend in the intermediate time frame.
👈 According to the marked zones on the chart, if the price returns to the green zone and we see a trigger, we can enter a sell position targeting the lower green zone.
👈 Given the bearish structure of the higher time frame, we anticipate further decline. However, for lower targets, we will wait for the price's reaction to the lower zone, which will confirm the trend change in the intermediate time frame.
⚠️ Please note that if you enter a sell position, your first target should be the lower green zone.
⚠️ Be cautious: If the price touches the lower green zone without returning to the upper zone and then moves back up, the upper zone is invalidated, and no further positions should be taken in that area.
#Eurusd/M15

DYM New Update (3D)It seems a fractal pattern is repeating. The red boxes represent the drop waves, while the green boxes indicate the sideways waves.
It appears that the second drop wave, with over a 92% decline, has ended, and the price has entered a trading range phase.
The price corrections can be considered as opportunities for buy/long positions, and the top of the red box can be regarded as the peak of this wave.
For risk management, please don't forget stop loss and capital management
Comment if you have any questions
Thank You

BTC longterm overviewIt seems that we have around 4 months to the end of this bull-run and Bitcoin top.
-------------------------------------
Share and follow me for further analyses.

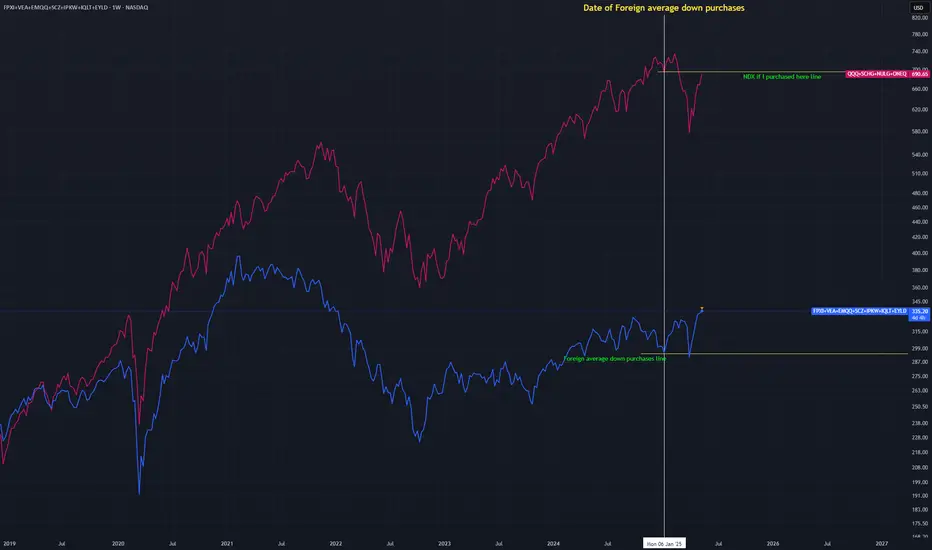
NDX Index Funds Vs Foreign NDX funds performance post rotationThis nothing but an idea I am publishing to track my performance for rotating profits in NDX funds into averaging down foreign funds in a retirement portfolio. I want to point out had taken profits previously and was trading bitcoin and GME with them until i found a candidate for rotation at a price point i liked.
I am neither bullish or bearish. The publication is for me others to learn how well rotation performs over time versus setting and forgetting.
Bitcoin Dominance is testing the monthly 100 EMA — and stalling.Bitcoin Dominance is testing the monthly 100 EMA — and stalling.
Price action shows clear hesitation at a key macro level.
If this holds, alts could catch a bid for the first time in months.
Break it? Altcoins stay sidelined.
Critical moment for market rotation.

ETHUSDTEthereum will definitely return from this price range to the target of $4000, the price range is the price retracement ($1428-$1125-$802).
