DOGE Daily MA Hints and CluesDOGEUSD Daily Outlook: Signs of Accumulation?
Thanks for taking the time to check out my analysis on DOGEUSD. Let’s dive in.
Most traders are familiar with moving averages and crossover signals — and while these are often viewed as lagging indicators, I’ve found that using multiple moving averages together can offer much clearer insights, especially when paired with other supporting tools.
On this chart, I’m using a combination of simple moving averages (SMA) and exponential moving averages (EMA). I’ll break down the specific MAs I'm using in a follow-up post, but for now, I want to highlight what the moving average structure is showing us right now — and how it compares to similar price action in the past.
Take a look at the yellow arrows on the chart:
The arrow on the right marks the current price position relative to the moving averages.
The arrow on the left points to a similar setup from the past.
As the old saying goes: “History doesn’t repeat itself, but it often rhymes.”
The last time DOGEUSD price action sat in this zone, we saw about 45 to 50 days of consolidation and chop before the market broke into a strong parabolic move higher. Projecting that same timeframe forward puts us somewhere around mid-June.
While nothing is guaranteed in the markets, this chart suggests that accumulation around this zone could present a favorable risk-reward setup for a potential run in the near to mid-term.
My Approach:
I began accumulating a position today and plan to add on pullbacks if the opportunity presents itself.
As always, this is not financial advice — just sharing my personal outlook and strategy. Wishing you all success out there — stay patient, stay sharp.
Economic Cycles

UNH Long $400 - Wyckoff Re-Accumulation SchematicWyckoff Re-Accumulation on UNH after recent ER sell off. Look for $400 to be supportive. Potentially an excellent addition the long term portfolio.
NYSE:UNH

With Last Trading Week Indecision Next Week Will be BIG for GoldGold shows indecision after the close of trading hours for last week, and with the long sellers' wick exhibited on the candlestick, XAUUSD will require a huge geopolitical uncertainty news for price to continue to rise. A further rejection will drag gold's price to its mean.
N.B!
- XAUUSD price might not follow the drawn lines . Actual price movements may likely differ from the forecast.
- Let emotions and sentiments work for you
- ALWAYS Use Proper Risk Management In Your Trades
#gold
#xauusd

The most simple BTC time chartThis simple chart have been working for many years, now the expectation is around Dec 2025


ETHThe chart looks like Bitcoin’s movement in 2020. I think it will rise to $4,000 by autumn. If it breaks that level, we could see $8,000–$10,000 by 2026, and and possibly even reach $14,000.
At the moment, it’s hard to believe this forecast, but the market can move any way, and there’s always a chance this scenario could happen.

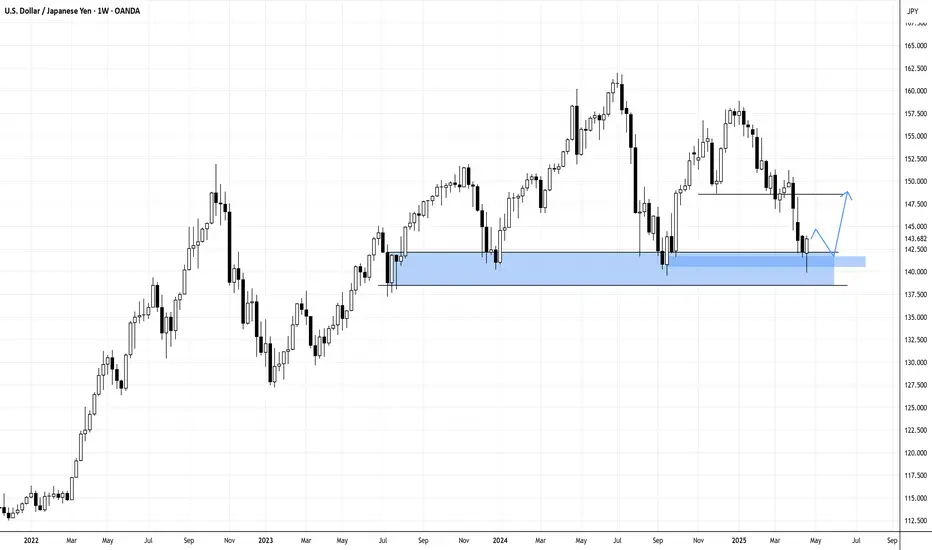
USDJPY Weekly Rejection at Support-Revisit Bearish Order Block?USDJPY pair last trading week got rejected at the same level that the pair has previously acted as a support level. Will this rejection cause USDJPY to rally towards a bearish order block above 147.50?
Risk Zones: 146.50
N.B!
- USDJPY price might not follow the drawn lines . Actual price movements may likely differ from the forecast.
- Let emotions and sentiments work for you
- ALWAYS Use Proper Risk Management In Your Trades
#usdjpy
#usd
#jpy
Buy idea on Crude Oil (CL1!)Based on :
- US10Y Leading long spike
- Commercials and Non Commercials at Extremes
- Open Interest at Extremes
- Cycles and quantitative data
- Undervalued conditions
-Demand zone

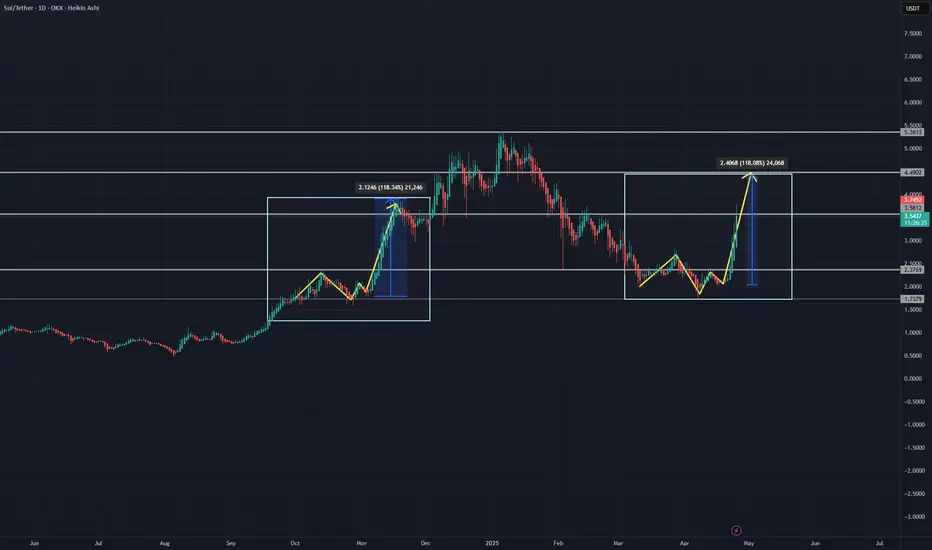
SUI: History Rhyming? A Potential 118% Repeat Pattern in PlayKEY POINTS:
- SUI/USDT previously formed a consolidation pattern with structured higher lows.
- This setup led to a strong breakout rally, resulting in a 118% price increase.
- The current price action is showing a very similar consolidation and breakout structure.
- A projected move could mirror the previous breakout, targeting a similar 118% gain.
- Key resistance levels overhead could act as major targets if the pattern plays out.
- Although history appears to be repeating, no two market cycles are exactly the same — caution is advised.
Traders should closely monitor for confirmation signs and always apply proper risk management. #paldogs
DOTUSDTIt should be at $6 and then a correction and a rally to $12 and then a stronger correction and finally a major rally to $24.210
Market geometry is doing its job

$USDT.D Cycle Top ProjectionI could see CRYPTOCAP:USDT.D playing out like this.
This November data also coincides with my BTC Cycle Thesis in November.
Lotsa other macro factors and indicators at play for a cycle top, but this lines up nicely and where I'll be taking a heavy chunk of profits.

Us30 Upward or downward?In the 5-minute timeframe, you can sell at the top of the trading range and buy at the bottom of the trading range (by observing reversal candles and patterns).
Alternatively, you can wait for a breakout and enter in the direction of the breakout.
Be mindful of fake breakouts

GBPUSD AnalysisGBP could potentially start its next bearish leg from the current level.
Price has reacted off a lower timeframe IFVG, which is currently acting as support.
If we get a clean close below this IFVG, along with proper short confirmation,
I'll be looking for bearish setups to target lower levels

Bitcoin Cycle Update – Are We Nearing the Peak?Check out this BTCUSDT chart – we’re at GETTEX:92K today, and seems like things are heating up!
▸We’ve seen a Cycle Bottom in late 2022 - early 2023, followed by strong Bull runs in 2023 and 2024.
▸Those Consolidation phases (sideways channels) gave us the perfect setup for massive pumps!
▸Right now, we’re in a Pause Triangle after a big rally – but the Cycle Top could be just around the corner in mid-2025.
▸After that? A potential Bear phase – time to plan your moves!
💡 What’s your strategy? Are you riding this wave to the top, or preparing for the next dip? Let’s discuss 📨

Enphase power and Amazon comparison from 1999
The similarities are very striking from Amazon's IPO into the 1999 Dot Com speculative bubble and the bust afterwards. History could be repeating itself. This is the EV/Solar bubble. The tech revolution is already played out. Now the S curve will be solar panels on everyone's homes and commercial buildings. The big buying opportunity could be coming.

$BTC Tracks $GOLD Very Closely With 12-Week LeadCould it really be this simple?
Maybe we can just throw Global M2 out the window and track TVC:GOLD with a 12-Week Lead.
Someone pointed this out to me yesterday when I posted Gold's near 1/1 tracking with Global M2.
*Note the deviation in CRYPTOCAP:BTC PA from the ETF hype.

BTC reach his topElliot wave count + Fibonacci time line shows btc gonna enter to a bear market soon

Bitcoin Aligns with the 2017 Cycle ModelThere’s growing speculation that the current Bitcoin cycle mirrors the market behavior seen in 2017.
Intrigued by this, I conducted my own analysis. I overlaid the 2014–2017 cycle pattern onto the current chart for comparison.
The results?
A striking resemblance in both the overall shape and the distinct correction and impulse phases.
It seems history may not repeat itself exactly, but it certainly rhymes. 📊

BTC Intraday Cycle ClustersThese are mathematically calculated cycle clusters based on hourly price and time data.
Cycle clusters can signal potential shifts in price action, including:
Changes in direction
Momentum shifts (acceleration or deceleration)
Breakouts
Gaps
Bold vertical lines indicate periods where more cycles are clustered. Dashed lines reflect clusters with fewer overlapping cycles.
I've also added some charting work—mainly channels—to help visualize and potentially trade the price movement between clusters and between channel lines.
Questions are welcome!

BTC Analysis - Bullish BiasMy current outlook on Bitcoin remains bullish, anticipating a move towards higher price levels.
I am specifically watching for the potential formation of a Fair Value Gap (FVG).
Should an FVG form, I will be looking for price to potentially retrace and touch this gap.
Upon a successful interaction with the FVG, my expectation is for price to then continue its ascent towards the higher levels I have marked on my chart.
I am focusing on identifying confirmed long opportunities based on this potential FVG setup and retest.
Trade safe!

$GOLD Continues to Move in Lockstep With Global M2It's amazing how accurate TVC:GOLD follows Global M2 with NO LEAD.
Near instant liquidity injection into the asset as the money supply rises 🪙
I do not see the price of Gold falling until Global M2 does.

GBPUSD Analysis with ICT ConceptsMy current outlook on the British Pound is bearish, with an expectation of lower levels in the near term.
A key level I am anticipating price to reach is the Weekly Open, which has not yet been touched.
Yesterday's price action seems to be confirming this potential move towards the Weekly Open.
Therefore, I am actively looking for confirmed short position opportunities to align with this view.
Trade safe!

COTI WAVE 3 is coming COTI has completed its initial phases, Wave 1, 2 of Elliot waves and is preparing for Wave 3📈.
Also COTI V2, released recently, aims to revolutionize web3 privacy.
COTI’s market capitalization is $96 million, suggesting substantial potential gains during the upcoming bull market🚀.
This information is not financial advice. Conduct thorough research before making investment decisions.
