$BTC HTF IdeaLooks like the starting of "Major Correction"
If the price goes above $93k, there are chances CRYPTOCAP:BTC could make a new ATH, if not 40s seem to be the bottom before the next rally.
Neutral Thoughts.
Economic Cycles

BTC Dominance ~75% ?Bitcoin continues to move in an ascending channel, gradually regaining its dominance
AltSeason may not exist :-)

[ TimeLine ] Gold 24-25 March 2025Hello everyone,
I will be using the high and low price levels formed on March 24 and 25 , 2025 (Monday and Tuesday), as entry points for my trades.
We will wait for the price range from these candles to form, as indicated by the green lines.
The trade entry will be triggered if the price breaks out of this range, with an additional buffer of 60 pips.
If the price moves against the initial position and hits the stop loss (SL), we will cut or switch the trade accordingly and double the position size to recover losses.
📉📈 Below is the chart with the estimated Hi-Lo range of March 24 and 25, 2025. You can copy the unique code and add it to the TradingView URL.
TV/x/hjaa6bzW/

BTC Swing Points (Linear Scale) ISTRUCTURAL AWARENESS
This analysis seeks to provide structural insights by identifying key levels and understanding historical price patterns to anticipate the limits potential future scale of price movements.
Indicators in use:
I'd start with retrieving HH LH HL LL points by script I've designed based on Pivot Points to be as aware as possible of key levels of the historic structure:
Adding altered Zig Zag that shows only percentage change of the swings. This would be another layer of the historic pattern capture:
BOTTOMS:
Wave analysis from '22 - '24
Logarithmic Trendline: It looks like a curve on linear scale, which we will use to link the composite but significant lows and extend it to the right. This gives a sense of a low levels which we assume would be hard to break anytime soon because of the price is a range away:
Breaking below and staying under that level for more than a few bars would signal a bearish trend, depending on emerging patterns at smaller scales as price nears the curve.
Since a Double Top pattern could develop, an additional line curve aligned with the HL and passing through the next bottom (black dashed curve) is necessary. If price breaches the main curve’s orange dotted line, it may descend toward the secondary curve, a significant lower boundary derived from historical curvature. A break below this level would require an even stronger bearish effort to actually keep it below because of high volatility and existing frequency of reversals.
Adding short-term trendlines which would be easier to break (Red and dark orange dotted continuation of the lines)
TOPS:
To anticipate how high it can grow, we'll connect the extreme tops as well.
2021 ATH ➡︎ 2024 ATH
2021 TOPS
2017 ATH ➡︎ 2021 1st TOP
Price breaking above "2017 ATH ➡︎ 2021 1st TOP" is a sign to switch to log scale where identical distance resembles identical % change to capture a bigger scale move relative to the structure.

APPLE: Fibonacci Fractal Mapping IApple Inc has some complex cycles which we're about to breakdown to composite phases via fibonacci ratios.
REGULARITIES
Continuous Fractal
Since start 00's, bearish trends in Apple have notably shrunk in percentage terms, painting the past two decades as a period of ever growing optimism. Many long-term cycles remain incomplete for an extended time amplifying the opposing force.
A linear extensions through local tops can serve a future support level.
A parallel line of that same angle carries the same deterministic properties.
This unlocks use of Fibonacci channels to further analyze the structure factoring in specific side tilt.
Continuous Fractal Type - forces alternative approach in interconnecting critical points
Fibonacci Fractal Mapping
Fractal Hierarchy

Nasdaq - When Rebound? There is a possibility that another major wave 5 is possible here, just like on SPX

TONBTC - The 1st TargetAfter a prolonged three-year correction in an irregular ABC zigzag, the cryptocurrency TON has promptly bounced off the bottom and is heading North

Skeptic | EUR/USD Breakdown: Key Levels & Trade SetupsWelcome back, guys! I’m Skeptic, and today we’re diving into a multi-timeframe breakdown of EUR/USD. We’ll analyze EURX (Euro Index) and wrap it up with some high-probability trade setups. Let’s get started! 🚀
EURX Analysis
Looking at the EURX chart, after a secondary uptrend, we’ve formed an upward channel. When price enters a channel after a sharp uptrend, it typically signals a loss of momentum, increasing the chances of a continuation of the major downtrend—which is exactly what’s happening now.
Currently, price is testing a key support at 1037.8 . This is a critical level, and if broken, we can expect further downside for EUR pairs.
EUR/USD Technical Breakdown
In the 4-hour timeframe, after the previous uptrend, EUR/USD has entered a consolidation phase. However, bearish momentum is more visible:
✔ SMA 7 is sloping downward and positioned above candles, reinforcing selling pressure.
✔ Given the EUR/USD and EURX analysis, we can afford to be more aggressive with short positions while remaining cautious with longs.
Trade Setups & Key Levels
📉 Short Setup:
Trigger: Break below 1.07124
Confirmation: RSI breaking support at 34.40 & increasing bearish momentum
Target: Next support at 1.07154
📈 Long Setup:
Trigger: Break above 1.09453
Confirmation: Strong bullish momentum & breakout of consolidation range
⚠ Important: These levels mark the highs and lows of the 4H consolidation zone, meaning whichever way price breaks, it’s likely to continue in that direction.
Thanks for sticking around until the end—drop your thoughts in the comments & let me know your setups! See you in the next analysis <3

Skeptic | DXY Showdown: Battle at 104.403Welcome back, guys! 👋I'm Skeptic
Today, we're diving deep into the DXY (U.S. Dollar Index), analyzing key levels and potential triggers.
🔍 Recap & Current Structure:
As highlighted in our previous analysis , the major daily support (0.618 Fib) held strong at 103.303 , with price reacting precisely at this level.
Currently, the DXY is testing a critical 4H resistance at 104.403 , which aligns with:
A 4H consolidation range breakout zone
A potential fakeout trap if price fails to sustain momentum
The RSI (65.92) suggests building bullish momentum, but confirmation requires a clean break above 104.403.
📈 Bullish Scenario (Long Setup):
Trigger: Break & close above 104.403
Confirmation: RSI holding above 65.92
Invalidation: Rejection + close back below 104.000
📉 Bearish Scenario (Short Setup):
Trigger: Rejection at 104.403 + drop below 103.936
Confirmation: RSI reversal below 50 + bearish 4H candle close
⚠️ Key Notes:
Fundamentals: Recent economic data favors dollar weakness—trade longs cautiously.
Risk Management: Avoid overleveraging—wait for confirmed breaks.
Stay sharp, and I’ll see you in the next analysis!


this is a golden time to buy FILUSDT(136% Profit)Golden Signal :
Buy in this zone about 3.200
Sell Zone For Step 1 and Take Your profit 50% Is First Red Box ,4.333 USDT (34% Profit)
Sell Zone For Step 1 and Take Your profit 50% Is Secound Red Box, 7.578 USDT(136% Profit)
Enjoy
:)


Buy idea on Crude Oil (CL1!)Based on
- Cyclical analysis and quantitative data
- Undervalued Conditions
- Commercials hedging higher

Buy Idea On CADCHFBased on :
- Cycles and quantitative analysis
- Demand zone created by engulfing candle
- Small speculators shorting are 156w extremes on weekly chart
- Divergence on Poiv and Progo

SPX us500The index has a target price range of 5991, there is a possibility of going up from this moment, but another possibility is that the range of 5520 will be touched and then it will move up.

$SPY Bullish Next WeekHere we are in a red market, a market correction some might say. We all know AMEX:SPY is about as trendy as it gets, despite all the macroeconomic headwinds that we currently are enduring, I am seeing a green week ahead. Follow that trend line of the past year, in the twos it has retreated, an average of 7.5% increase occurred in the following 15 trading day. It seems that investor confidence has increased this past week especially with the strong push to end the week. Also, volume of this 15 day segment is 24% ahead of the pace of those previous 15 dat segments - Could we see major green next week?

ETH’s Secret Pattern Exposed! Why Is No One Talking About This ?Hello Traders 🐺
When I opened the ETH chart today and switched to the weekly timeframe, I saw something unbelievable with my own eyes! 🤯 That’s why I decided to share it with you, my friends. I truly believe there’s a very high chance for ETH to explode to a new ATH! Let’s break it down:
Why am I still bullish and not talking about anything bearish these days? 🤔
✅ The BTC.D Chart – The Most Important Factor
BTC.D is sitting at its most critical resistance level. Not just one, but two bearish divergences have already formed on the weekly chart, signaling a potential reversal. I will also update my last idea about BTC.D, so make sure to follow me for upcoming updates! 🔔🔥
Other Reasons to Stay Bullish on ETH & Altcoins 💎
📉 Weak hands are leaving the market
💰 Inflation is falling, which means we could see rate cuts very soon
🏦 Quantitative Tightening (QT) is ending soon
🇨🇳 China is printing money, and the FED will likely turn the printers back on
📍 ETH/BTC is sitting at a key monthly demand area
📊 Binance has increased its ETH holdings by over $600 million just this week!
These are the reasons why I remain extremely bullish on ETH and Altcoins. And now, let’s dive into the ETH chart—because that’s exactly why you’re here!
ETH’s Repeating Pattern – A Bullish Setup! 🔄🔥
As you can see on the chart, ETH has a history of repeating the same pattern over and over again. 🌀 Back in 2020-2021, before the massive ETH & Altcoin rally, we saw a huge weak hands shakeout. Just before the shakeout, everyone thought ETH had formed a double bottom and was ready to fly—but then BOOM! 💥 A huge shakeout happened, followed by a rally to new all-time highs. 🚀
Now, the same pattern is unfolding again! We have an Inverse Head & Shoulders, which is a bullish pattern. Then, we saw a massive shakeout just below the previous low, causing a bullish divergence on RSI—and now, things are starting to change! 🔥📈
✅ Make sure to act accordingly, my friends!
🐺 KIU_COIN 🐺

When altseason? Very soon! But then major market crash end 2025.Here is my vision of the Total-3 market cap (all crypto market excluding BTC and ETH). Altseason preliminary in 2 big waves till September-October, and then market crash -90..95% during next year.

BTC | 90K or 40KBTC is seemingly in the early days of a brand new bearish cycle.
This is somewhat surprising, since ETH did not make a new ATH - which has happened every single time in the past rallies.
The bounce zones I will be watching for the coming bearish cycle:

BTC’s Historical Pattern Is Back—Are You Watching ?Hello Traders 🐺
In this idea, I want to talk about a pattern that almost nobody is talking about these days—so make sure to fasten your seatbelt and get ready, because this chart is about to blow your mind! 💥📊
On the monthly chart, after breaking out from its previous ATH, BTC formed an ascending channel and started moving up steadily—not like a parabolic run. 🚀 Just when everyone thought the BTC rally was over and a bear market was incoming, BTC made its final explosive move, shocking the entire world. 🌍⚡
🔍 So What Now?
Are we about to experience a full year of bull market, or will this run last only 2–3 months?
In my opinion, we’re entering the final phase of the BTC move. Historically, this phase is shorter than the major wave after halving, but percentage-wise, it’s often even bigger. And this time, we might witness the real explosion—because as I mentioned in my recent ideas, BTC.D is on the edge of collapse! 📉🔥
Considering all this, we can expect a massive pump in Altcoins market caps. Also, if you take a look at the Global M2, you’ll see there's more than enough liquidity to fuel the market and push it through the final phase of this bull run! 💰📈
So make sure to follow me to stay up to date with market movements—and ride the profit wave all the way up! 🏄♂️💎
and always remember :
🐺 Discipline is rarely enjoyable , But almost always profitable 🐺
🐺 KIU_COIN 🐺

Is altseason soon?Hi, traders 👋
I’d like to share my thoughts and observations regarding Bitcoin dominance and the timing of the long-awaited altseason.
In general, I like to determine the phase altcoins are in by analyzing one of the oldest representatives of this group — Litecoin.
Like other financial instruments, cryptocurrency tends to follow certain patterns. Although each cycle comes with its own unique characteristics, historical similarities are often present.
Let’s take a look at the Litecoin chart.
When reviewing the chart, we can see a number of similarities with the previous cycle. Based on this, and if we assume that markets are cyclical and certain chart patterns and behaviors tend to repeat, it appears we are currently either in the equivalent of March or September 2020.
The case for March is supported by the fact that we haven’t yet seen a final liquidity sweep according to the Wyckoff model — the so-called “spring” phase. On the other hand, the case for September is supported by the timing following the end of the previous bear market phase.
Now, let’s take a look at the Bitcoin dominance chart.
In this cycle, the dominance chart has been showing clear and reliable chart patterns.
The pattern that has been forming since November 21, 2024, could potentially be either a Wolfe wave or an ending diagonal triangle according to Elliott Wave theory. At the moment, waves 1, 2, and 3 are clearly visible, and wave 4 is currently in the process of forming. There is also a clear alternation between waves 2 and 4, which strengthens this observation.
If the assumption about the Wolfe wave pattern is correct, we should still see one final push higher in Bitcoin dominance as part of wave 5. This would likely lead to a further decline in altcoins. In that case, referring back to the Litecoin chart analysis, it would confirm that we are currently in the equivalent of March 2020.
I’m glad to share my observations with you.

Potenial inverse head and shoulders pattern for Bitcoin This is the scenario I’m believing in for the near term for BINANCE:BTCUSD .
One more leg down to confirm the neckline around 78,300 USD.
Quick reversal price action to retest the 92,300 USD (ish) level.
If the breakout takes place to the upside, then I think we will retest the previous highs, with a higher probability of going much higher. Although I believe the tariffs will have a big impact on the USD (DXY index), which I believe will have a strong effect on BTC for the near term, around the coming 6 months. So, I believe the new high will most likely come in Q4 this year, making this cycle different from the historic crypto cycles. Although, there is still a chance that other countries will start to adopt more crypto-friendly policies for crypto or Bitcoin, making this thesis more uncertain. If the policies come out as positive, then I think there are good chances of reaching new highs earlier than Q4, 2025.

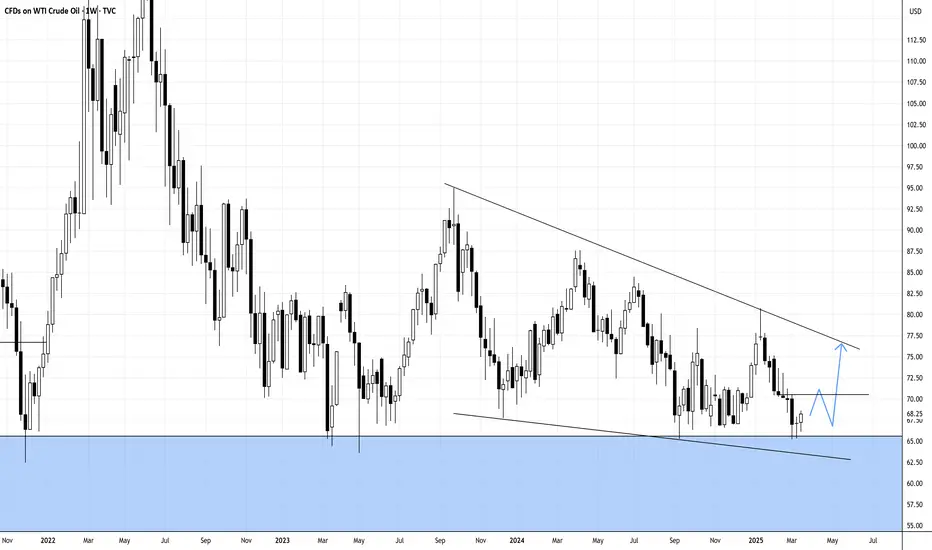
WATCH OUT FOR OIL'S DESCENDING TRIANGLE...A potential close above 70 will signal the likelihood of oil price to test trendline is sloping downward or the bearish order candle.
N.B!
- USOIL price might not follow the drawn lines . Actual price movements may likely differ from the forecast.
- Let emotions and sentiments work for you
- ALWAYS Use Proper Risk Management In Your Trades
#usoil
#wti
#ukoil