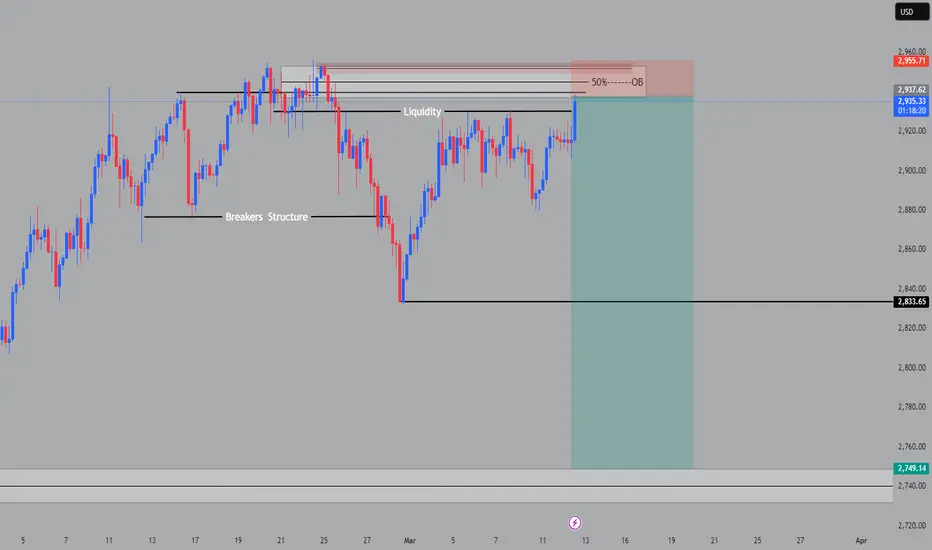
SELL GOLD Gold flat after Eu and China vow to counter US tariffs earlier this Wednesday.
A US-brokered ceasefire deal on Ukraine is up for Russia to consider in the coming days.
Traders are awaiting the upcoming US inflation data on Wednesday.
Economic Cycles

BTCUSDT During the American Session (Short from IFC)The price is in the premium zone on the 15-minute timeframe. An IFC bar has formed. A short trade from the IFC bar is possible.
In the inner block, a correction is expected: there is an opportunity to trade long against the trend up to the nearest liquidity.

Don't Panic! Good times around the corner for BitcoinGlobal M2 Money Supply
Global M2 has been leading BTC price action very closely by 10 weeks.
Roughly 12 days from today for upward price action to strongly resume, if the correlation holds.
A wick down to 73-74k is nothing to worry about. In terms of time we are likely very close to the bottom, if it's not already in.
You can use the indicator on your chart for free below.
Shout out to @Mik3Christ3ns3n for the original indicator.

Elliott Wave View: GBPUSD Extending Higher in Wave 5 ImpulseShort Term Elliott Wave View in GBPUSD suggests cycle from 2.3.2025 low is in progress as an impulse. Up from 2.3.2025 low, wave ((i)) ended at 1.2679 s the 1 hour chart below shows. Wave ((ii)) pullback unfolded as an expanded Flat Elliott Wave structure. Down from wave ((i)), wave (a) ended at 1.2603 and wave (b) ended at 1.2716. Wave (c) lower ended at 1.2557 which completed wave ((ii)) in higher degree. Up from there, wave (i) ended at 1.2614 and wave (ii) ended at 1.258. Wave (iii ) higher ended at 1.292 and wave (iv) ended at 1.286. Wave (v) ended at 1.294 which completed wave ((iii)).
Pullback in wave ((iv)) ended at 1.2858 with internal subdivision as a zigzag. Down from wave ((iii)), wave (a) ended at 1.287 and wave (b) ended at 1.294. Wave (c) lower ended at 1.2858 which completed wave ((iv)). Pair has resumed higher in wave ((v)). Up from wave ((iv)), wave (i) ended at 1.2966. Expect wave (ii) pullback to hold above 1.2858, and more importantly above 1.2557 for further upside. As far as pivot at 1.2557 low stays intact, expect dips to find support in 3, 7, or 11 swing for more upside.

FPI: Irony Behind The DeclineFibonacci interconnection between Higher Low, Higher High and series of Lower Highs and Lower Lows. The side of breakout from this narrowing formation will determine the direction of trend. The fibonacci lines derived from the structure covers the limits of breakout wave.
If the price resumes its downtrend, I can only assume the market is still digesting the impact of deteriorating fundamentals. When I first learned about the situation, I could hardly believe it. Essentially, the anti-immigration and protectionist policies Nebraska’s farm owners voter for, have triggered a labor exodus, as migrant workers in masses preemptively abandoned farms to avoid impending ICE crackdowns. This sudden labor shortage lowered rental income potential and more importantly affected land valuations — both of which are fundamental drivers of financial performance. At the same time, the fact that the farms depend on fertilizers 90% of which come from Canada - adds another layer of uncertainty amid ongoing trade tensions. This raises the risk of input cost spikes that could further erode profit margins. As operating costs rise and productivity declines, farmland becomes an increasingly unattractive asset class, prompting investors to reassess the value of agricultural holdings. The result is a broad collapse in prices — ironically driven by the very political and economic decisions that were believed to protect these rural businesses. If this isn’t something out of parallel universe, I don’t know what is.

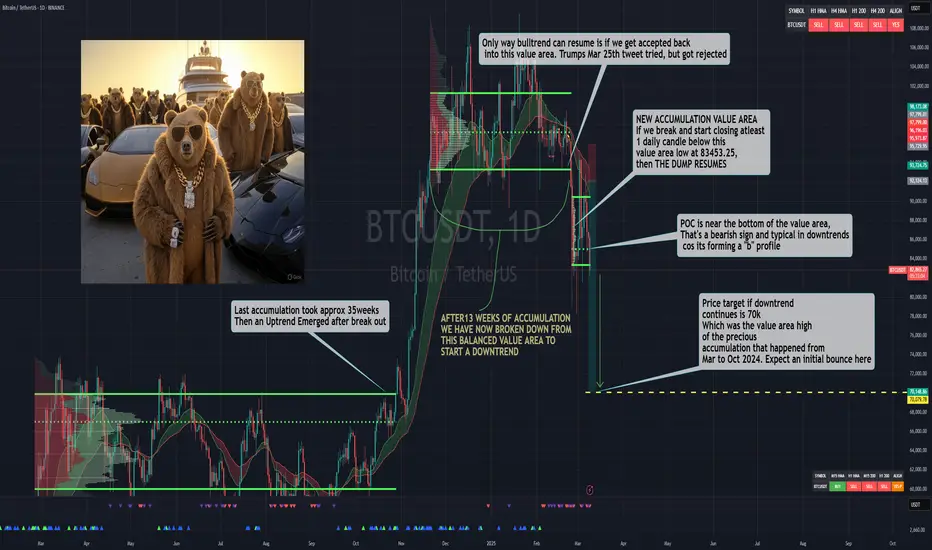
Sweet Spot To Sell The BTC Pullback In a strong downtrend. Every pullback on the 4hr and Daily chart will be hyped by the bulls & super cycle evangelists as a "WE'RE BACK" moment.
I will continue to take this same setup, selling Major swing highs on 4HR & Daily chart on BTC until the Daily Chart flips bullish. Until then or some news come out, we will remain in the downtrend until we hit the target shown in my last analysis, see link below.

Eur/UsdPrice breaks through major resistance level and use for support to rally to potential highs.
1.09000 Major key level

Solana's important supporthello friends
Due to the heavy demand of Solana and the construction of new floors based on the market cycle, we expect a new floor within the specified range.
If we reach the support range of 105-110 dollars, we can buy with confirmation, of course, with capital management...
*Trade safely with us*

Best Long Entry in this situationDon't try to catch a falling knife with your hands.
Just wait for a good entry.
waiting is a key to success in financial markets

BTC Upward WedgeWedge patterna usually require 5 touch points to confirm the pattern. Which, officially, Bitcoin has done.
This upward wedge means revearsal for a bear market, while a downward wedge means reversal for a bull market.
We are still inside this wedge which means even though this pattern is hypothetically confirmed on BTC, we could either see a rally up through the wedge until it finally breaks, or we may even break now into the end of March if BTC continues sideways.
This pattern overall suggests that we are likely to see an early top for BTC if the pattern confirms in the next few weeks, otherwise there's still room for a late 2025 top for BTC even with the upward bearish wedge in play.

Correction to 5145A minimum target that is set technically and not fundamentally
And the next target is the maximum target of 4815, a certain price reversal
The possibility of a price reversal from this current range is possible with news


DAX indexDAX at 22510.88 is worth a long trade with a stop loss of 22316.46 and a target of 22908.80.

DOW JONESThe price of 42276.9 is suitable for a long trade with a stop loss of 42153.7, with a target of 44100. Note that I checked the prices on theCapital.COM broker chart.

GOLD XAUUSD It is possible to make a short trade at 2945.278 with a stop loss of 2956.835 and targets of 2945.278 and 2890.245. The risk is your responsibility.

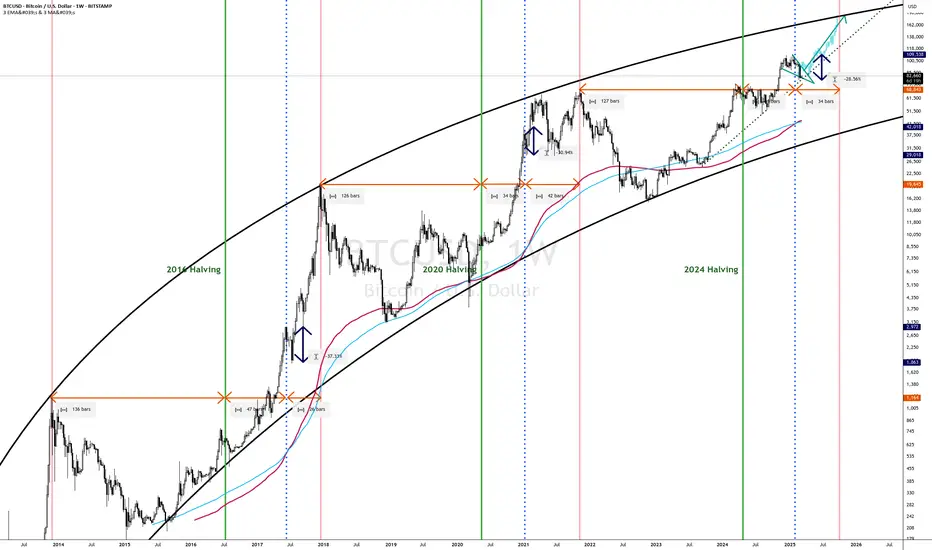
Normal Cycle Despite DespairEvery cycle, when the weekly 233 EMA crosses above the weekly 200 MA, shortly after there is a circa 30% drawdown. That is happening now and is normal but feels more intense because 30% of 100k is bigger than entire price range of 2017 cycle.
2013 - 2017 cycle
• 136 weeks from top to halving
• 48 weeks to 233/200 cross
• 37% dump from cross swing high
• 26 weeks to 2017 cycle top
2017 - 2021 cycle
• 126 weeks from 2017 top to halving
• 41 weeks to 233/200 cross
• 31% dump from cross swing high
• 42 weeks to cycle top
2021 - Now
• 127 weeks from top to halving
• 41 weeks to 233/200 cross
• 28% dump from cross swing high so far
• Estimted hitting upper band - late October early November if cycle follows previous
Bought more BTC last night at 81.1k
Welcome To The Long Awaited BTC Bear Market Fade the trend at your own risk.. It's always a good idea to SELL into WEAKNESS, and BUY into STENGTH.
The daily btc chart is confirmed bearish. Only the monthly and weekly chart are still bullish, but if the downtrend continues on the daily trend, then it will make its way to the Weekly chart and eventually the monthly chart.. This is going to happen slowly or a mega dump could speed it up. but the target remain the same.
We were all promised a "SUPER-CYCLE" and alot of people are still riding the narrative fueled by social media and constantly getting rekt . Trust ONLY what you see on charts ONLY !!.
I already started shorting the market way back since January when i stopped listening to the hype and started focusing on trading the trend on the chart as soon my trend indicator gave me a sell signal on the daily timeframe, everyone taught i was crazy in the chats for my bearish call outs. So far its been the BEST DECISION EVER !!
If you want to buy anything, just make sure its on Spot, you buy with the mindset that you are buying to hold until at least 2027 .There is no magical super cycle..The party is over until something crazy bullish happens or trump does something that sparks a new rally.
Reworked Kaspa Weekly and Daily Cycles using KAS/USDReworked Cycle counts on Kaspa/USD chart
Using Fiance Camels "How to set up Cyvle count on a specific Asset", I reworked the Dailt (DCL) and Weekly (WCL) counts.
DCL form in 60 days (+/- 10%), and there are 5 DCL within the larger WCL (D/WCL-DCL-DCL-DCL-DD/Wcl)
WCLs are ~ 32 WKs (+/- 10%)

USDJPY longIt seems that USDJPY can fall to 145.112 to 144.050 and then start an upward movement to 151.357, from which it can be limited to a loss of 141.668 and a long trade can be made for a target of 151.357.

DXY ( US dollar ) $ In my opinion, the index will continue to fall from 101.474 to 100.938, and then start to move up from that area to 107.255.

XRPUSDT XRPUSDT has the possibility of long trading from the price of 1.3854 to a stop loss of 0.9947, and if it reaches this price range, it is worth a good trade.
The risk in trading is your choice.
