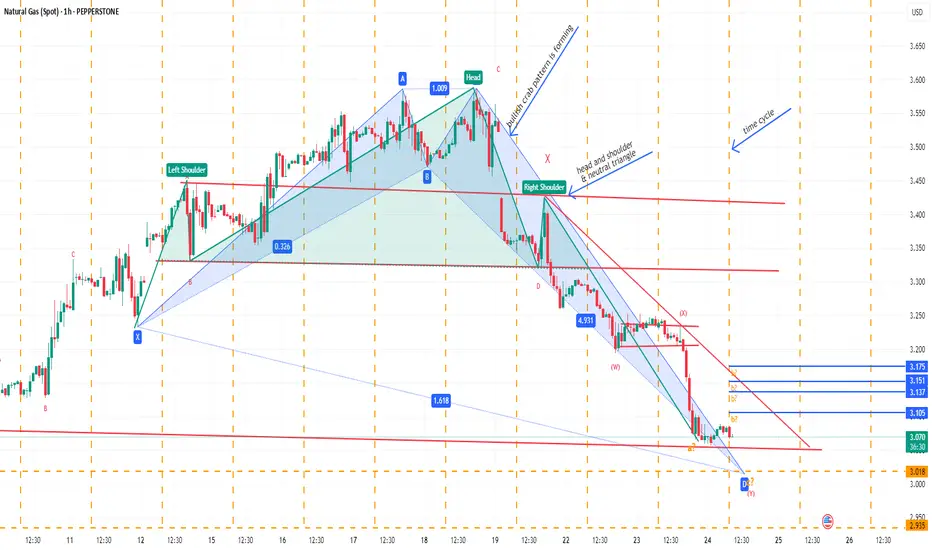
NATURAL GAS SPOTBullish crab pattern may form, if another harmonic pattern may develop later.
Neo wave wise may be in wave Z need confirmation.
Time cycle high low break may be trend continue in break out/down direction.
Not sebi research analyst.
Economic Cycles
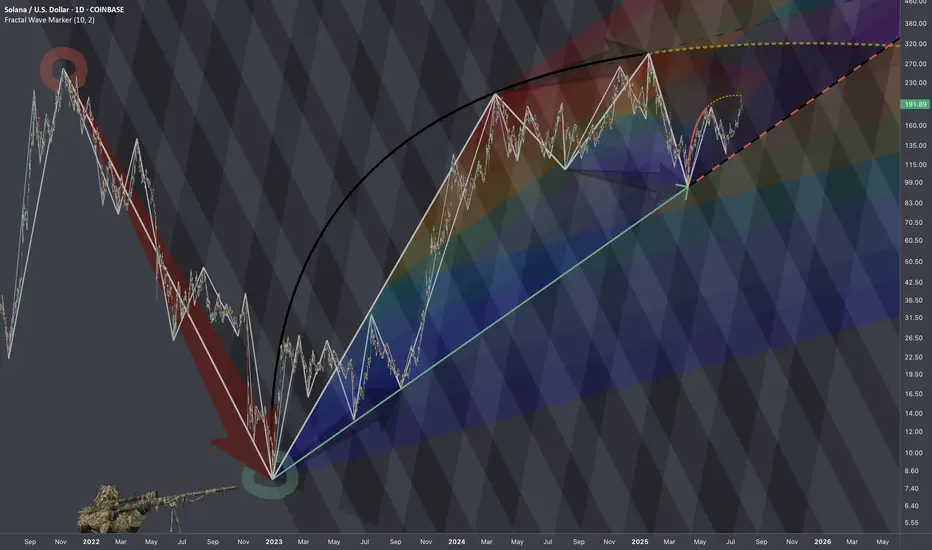
$SOLUSD: Scaling LawsResearch Notes
Progressions here are evident so I'll use the historic bits and organize them into structure that would determine the levels inside dark highlighted zone of the local scope.
If we scale back, it's hard to avoid the massive drop that structurally can serve as reference point.
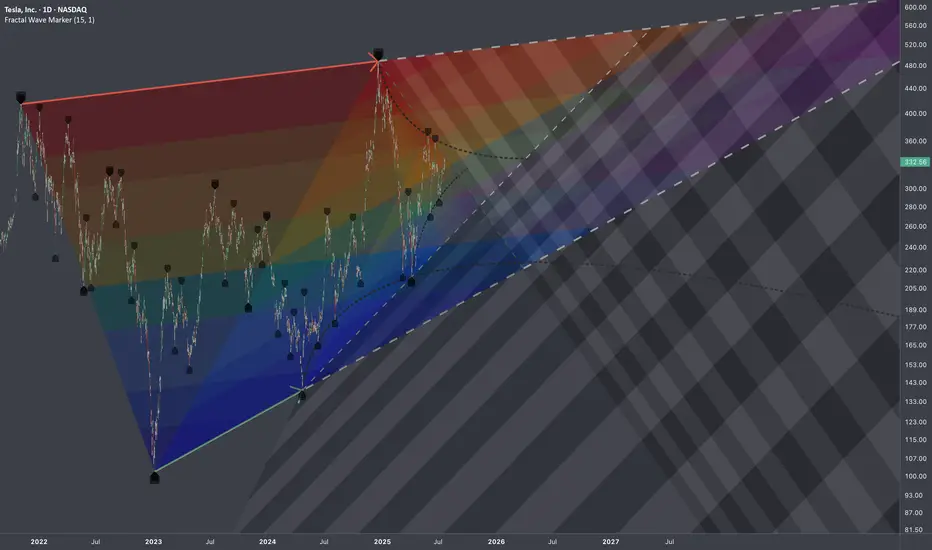
$TSLA: Multi-Scale DensityResearch Notes
Identified structural compressions happening within two periods:
This set has provided a perfect opportunity to study exponential fibs with growth rate starting from phi^1/4 applied to area of expression of squeeze.
Geometrically, gives a better sense of a continuity than regular fibs.
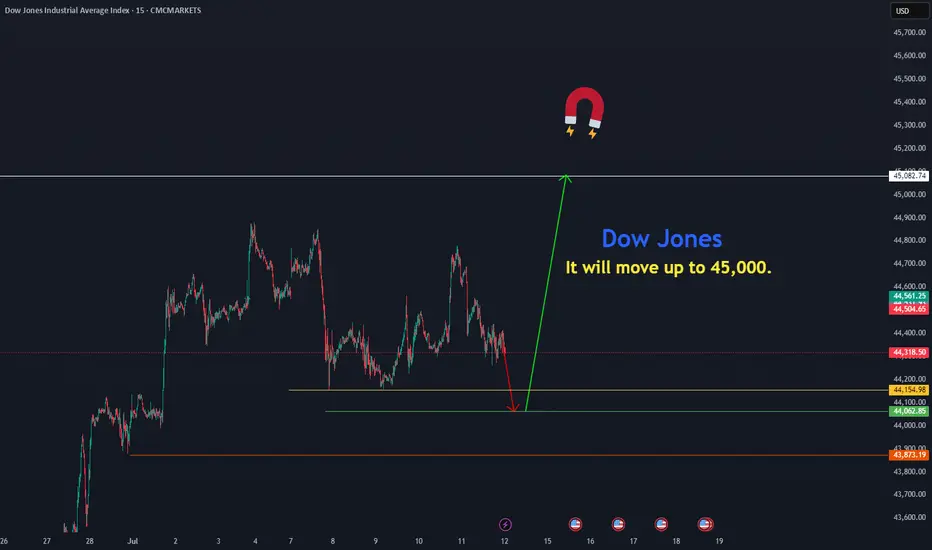
Dow Jones move upThe Dow Jones is resuming its rally toward 45,082 from the price zones of 44,154.97 and 44,000.
CMCMARKETS:US30
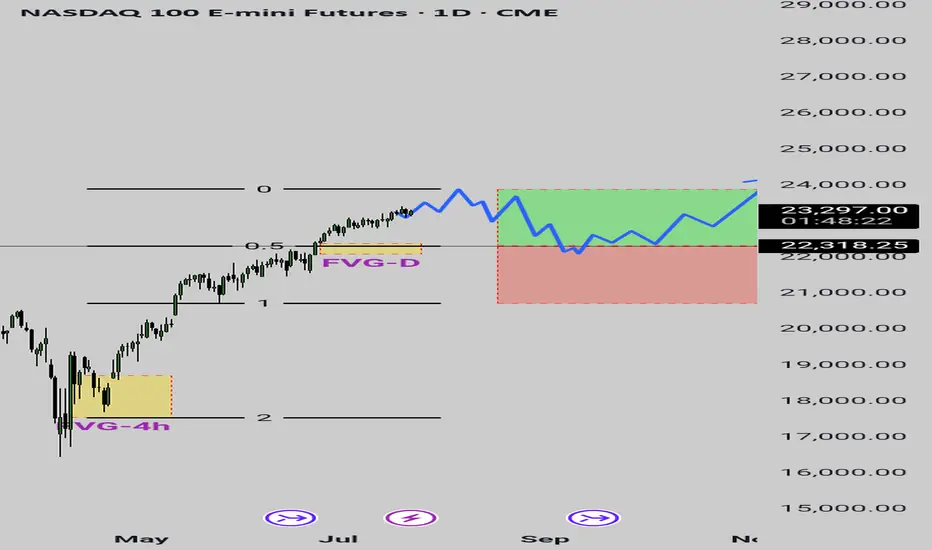
Nasdaq in future Everything's clear on chart
I wanna see a bullish move on NQ first to create a up run leg and come back to the lower 50 percent of that leg then ...
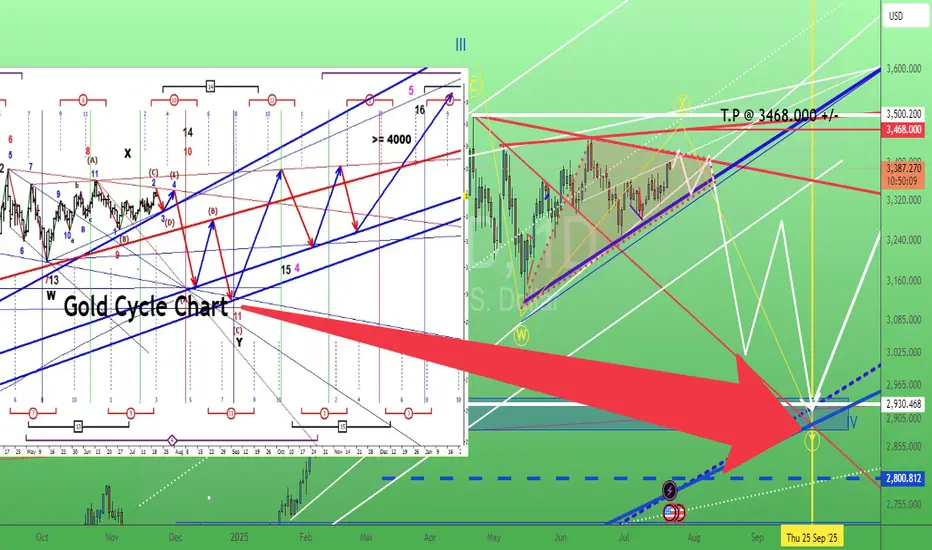
Gold is forming a bull or bear triangle. 22/July/25XAUUSD. is gold forming a bearish or bullish triangle, but the cycle chart shown it is pointing to the "south", maybe my analysis s is "wrong"...
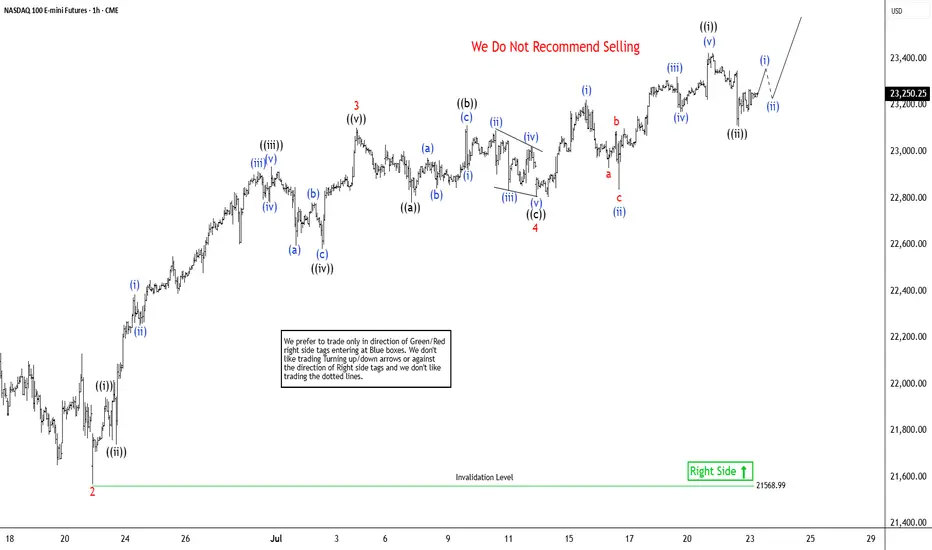
Elliott Wave View: Nasdaq Futures (NQ_F) Poised To Extend HigherThe Nasdaq Futures (NQ_F) favors higher in bullish impulse sequence from April-2025 low. It already broke above December-2024 high & expect short term pullback in 3, 7 or 11 swings to remain supported. Impulse sequence unfolds in 5, 9, 13, 17, 21….. swings count. It ended daily corrective pullback in double correction at 16460 low of 4.07.2025 low. On daily, it should extend into 28864 – 26152 area to finish April cycle before next pullback start. Above there, it favors rally in (3) of ((1)). It placed (1) of ((1)) at 21858.75 high, (2) at 21071.50 low as shallow connector & favoring upside in 5 of (3) against 7.13.2025 low. Every pullback after 4.21.2025 low was shallow & unfolded in 3, 7 or 11 swings calling for more upside as long as it stays above 5.30.2025 low. Within (3), it ended 1 at 22222 high, 2 at 21566.75 low, 3 at 23102.50 high, 4 at 22803 low & favors upsides in 5 of (3). Wave 4 as flat correction ended in 7.13.2025 low of 22803 low.
Below 3 of (3) high, it placed ((a)) at 22779.75 low, ((b)) at 23112 high & ((c)) at 22803 low as flat connector against 6.22.2025 low. Above there, it ended ((i)) at 23424.75 high as diagonal & ((ii)) at 23108 low in 3 swing pullbacks. Above there, it should continue rally in ((iii)) of 5, which will confirm above 23424.75 high to avoid double correction. Within ((i)), it placed (i) at 23222.75 high, (ii) at 22835.5 low, (iii) at 23320.75 high, (iv) at 23169.50 low & (v) at 23424.75 high. Currently, it favors upside in 5 of (3) into 23493.5 – 23934.5 area, above 7.13.2025 low before (4) pullback. Based on swing sequence, it already has enough number of swings in (3) to call the cycle completed. But as long as it stays above price trendline, passing through 2 & 4, it should continue upside into extreme area. We like to buy the next pullback in 3, 7 or 11 swings at extreme area for intraday rally. It favors upside in April-2025 cycle & expected to remain supported in (4) & later in ((2)) pullback as next buying opportunity.
XAUUSD buy Idea!Xauusd has printed its low in the past week and currently looking for a high nearing 3400 region. 3400 could be a very important rejection or breakout zone.

Ethereum to $8000On the monthly chart, Ethereum has reached major resistance at $3,800 again and, in my opinion, can break through this time. This is the final leg to $8,000 soon.

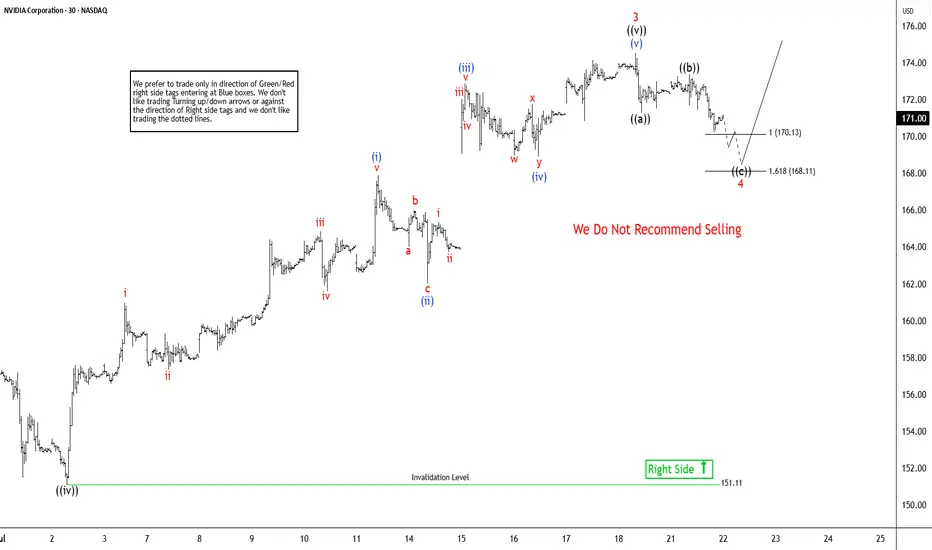
Elliott Wave Sequence In NVDA Suggests Rally From SupportNvidia (NVDA) continues rally to new all-time highs from April-2025 low and reinforcing a robust bullish outlook. In daily, it ended 7 swings pullback at 86.62 low in 4.07.2025 low started from 1.07.2025 high. Above April-2025 low, it confirmed higher high bullish sequence & pullback in 3, 7 or 11 swings should remain supported. Since April-2025 low, it favors rally in (3) of ((1)), while placed (1) at 115.44 high & (2) at 95.04 low in 4.21.2025. Above there, it placed 1 of (3) at 143.84 high, 2 as shallow connector at 132.93 low & 3 at 174.53 high. Wave (3) already extend beyond 2.0 Fibonacci extension of (1) & yet can see more upside. Within 1 of (3), it ended at ((i)) at 111.92 high, ((ii)) at 104.08 low, ((iii)) at 137.40 high, ((iv)) at 127.80 low & ((v)) at 143.84 high. Above 2 low, it placed ((i)) of 3 at 144 high, ((ii)) at 137.88 low, ((iii)) at 159.42 high, ((iv)) at 151.10 low & ((v)) at 174.53 high as 3 of (3).
It already reached the minimum area of 170.04 as inverse extension of connector. But it can see more upside as daily move showing highest momentum from April-2025 low. In 1-hour, above ((iv)) low, it placed (i) of ((v)) at 167.89 high in 5 swings, (ii) at 162.02 low, (iii) at 172.87 high, (iv) at 168.90 low & (v) of ((v)) at 174.53 high ended as 3. Currently, it favors pullback in 4 targeting into 170.13 - 168.11 area before rally in 5 or at least 3 swing bounce. Within 4, it ended ((a)) at 171.26 low, ((b)) at 173.38 high & favors lower in ((c)) of 4. It should find support in extreme area soon to turn higher for two more highs to finish ((1)). The next move in 5 of (3) can extend towards 175.9 or higher, while pullback stays above 168.11 low. The next two highs expect to come with momentum divergence to finish cycle from April-2025 low. Later it should see bigger pullback against April-2025 low in 3, 7 or 11 swings. But if it extends higher & erase momentum divergence, then it can see more upside.
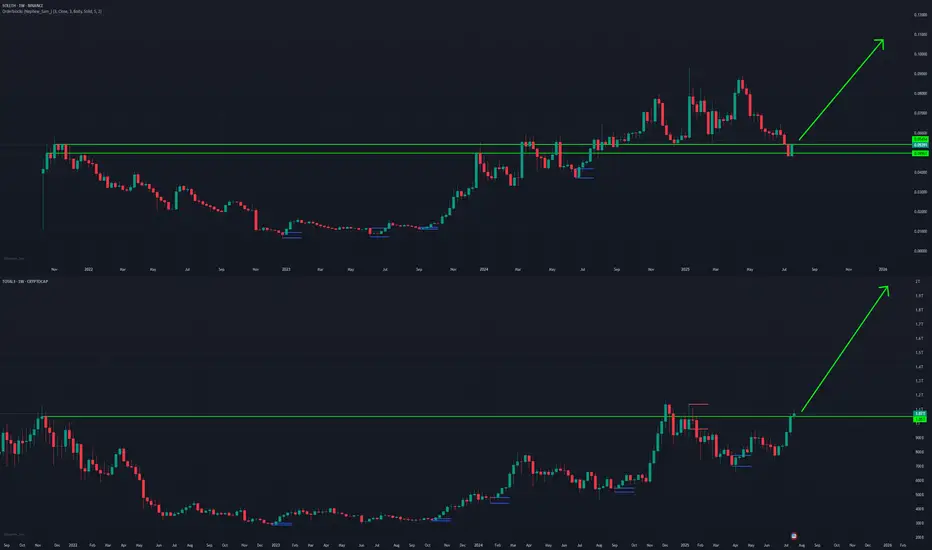
ALT SEASON Cycle Finale Special | SOL/ETH & TOTAL3Our last analysis of BTC.D ⬇️ and ETH/BTC ⬆️ () is now playing out, and we are entering the final stage of the 4-year crypto cycle -- ESCAPE VELOCITY for the rest of the crypto market.
As money flows up the risk curve, expecting SOL to outperform ETH from here, and the rest of the crypto market to outperform majors.
Welcome to the cycle finale special!
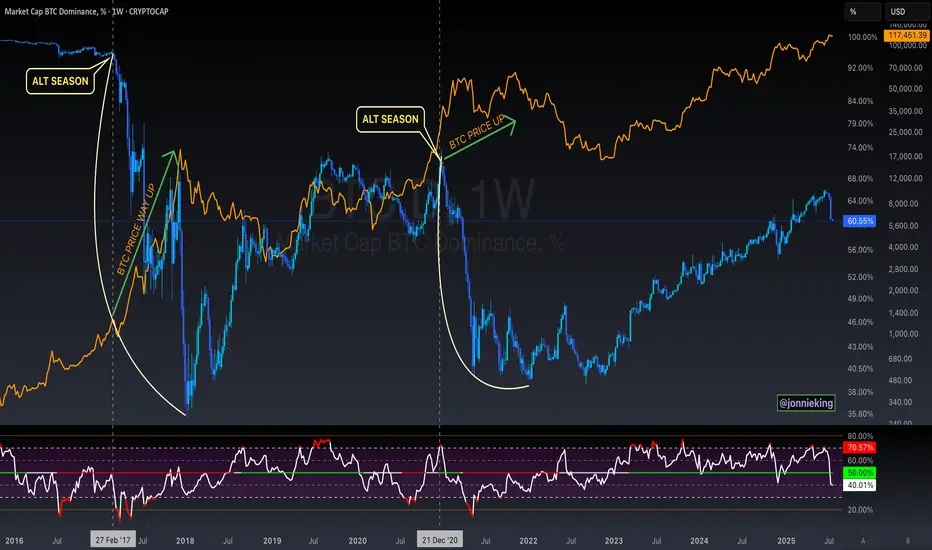
$BTC Will Go Up Alongside Alt SeasonSomeone posted on one of my tweets the following:
" Jonnie my bro, the only problem for me right now is that btc didnt top yet. You also talked how btc shoud top around 200k range. Alt season can only come when btc reach top"
MYTH DEBUNKED ✅
CRYPTOCAP:BTC does NOT need to top in order for Alt Season to commence.
Both can and will occur in tandem 🤝
$XRPUSD: Limits of Expansion🏛️ Research Notes
Documenting interconnections where historic area and coordinates of formations are used to express geometry of ongoing cycle.
If we scale out the chart back starting from roughly 2016, we can see more pretext like how the price was wired before decisive breakout from triangle.
Integrating fib channel to the angle of growth phase of the previous super-cycle, so that frequency of reversals match structural narrative.

ACH - LongWeekly Chart Pattern: Ascending Triangle
An ascending triangle does not guarantee that the stock will enter bearish territory, it can go either way.
ACH is a bit lagging coin comparing to other mainstream cryptos. I have played it twice to the big resistance at ~0.058
PT1: ~.058
PT2: After retesting 0.058
Resistance: ~0.033
Support - Stoploss :~.017

BTC Cycle Low July/August 2025I still keep track of my BTC cycle count, which is a little bit unclear, since the last daily cycle low had a SFP. We will see how it plays out this time.(It's funny that the second one is aligning perfectly with a weeky cycle low, but thats for later)

Altseason-2025: the moment of truthA long BTC.D uptrend is about to be over. The next 2 months will be altseason. Keep your altcoin bags, soon we will be rich. Don't be too greedy, don't skip a possibility to exit from the market with a profit.

Target remained gold.All markets, especially gold, have been the most manipulated in the last month.
(Market manipulation is completely different from market volatility due to news)
Previously, this happened maybe once or twice a month, but in the last month it happened more than 10 times
Last word: The price of the bottom 3247 will never be hit until the target 3257 is touched

AMD Overview & Elliott Wave CycleAMD recently reported strong Q2 2025 results, with growth driven by Data Center and AI segments, notably thanks to the Instinct MI300 chip family. Revenue rose +15% YoY, with a significant boost from AI-related demand. Future projects include next-gen GPUs, AI platforms, deeper cloud integration, and investments in 3nm architectures.
From a technical perspective, AMD appears to be in a primary Elliott Wave cycle, which may have begun around October 2022. Such cycles typically last between 3 and 10 years. This insight comes from years of study, hands-on practice, and applied quantitative models,not guesswork.
If you found this interesting, share it with others: spreading thoughtful analysis matters.

Elliott Wave Analysis: SPY Poised To Extend Higher In Bullish SeElliott Wave sequence in SPY (S&P 500 ETF) suggest bullish sequence in progress started from 4.07.2025 low. It expects two or few more highs to extend the impulse sequence from April-2025, while dips remain above 6.23.2025 low. SPY ended the daily corrective pullback in 3 swings at 480 low on 4.07.2025 low from February-2025 peak. Above there, it favors upside in bullish impulse sequence as broke above February-2025 high. Currently, it favors wave 3 of (1) & expect one more push higher from 7.16.2025 low in to 630.31 – 651.1 area before correcting in wave 4. In 4-hour, it placed 1 at 596.05 high, 2 at 573.26 low as shallow connector & extend higher in 3. Within 3, it placed ((i)) at 606.40 high, ((ii)) at 591.89 low, ((iii)) at 627.97 high & ((iv)) at 618.05 low.
In 1-hour above ((ii)) low of 591.89 low, it ended (i) at 605.96 high, (ii) at 603.17 low, (iii) at 626.87 high as extended move, (iv) at 620 low & (v) as ((iii)) at 627.97 high. Wave ((iv)) ended in 3 swing pullback as shallow connector slightly below 0.236 Fibonacci retracement of ((iii)). Within ((iii)), it ended (a) at 619.8 low, (b) at 624.12 high & (c) at 618.05 low on 7.16.2025 low (this week). Above there, it favors rally in ((v)) of 3 targeting in to 630.31 – 651.1 area before correcting in 4. Within ((v)), it placed (i) at 624.73 high, (ii) at 623.08 low & favors upside in (iii) of ((v)). We like to buy the pullback in clear 3, 7 or 11 swings correction at extreme area in 4 and later in (2) pullback, once finished (1) in 5 swings.

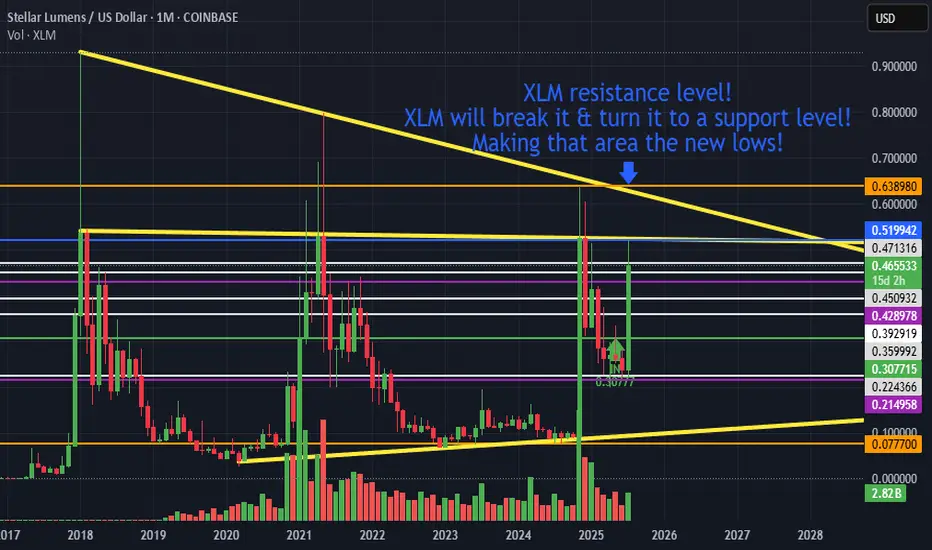
XLM new lows!XLM resistance level!
XLM will break it & turn it to a support level!
Making that area the new lows!
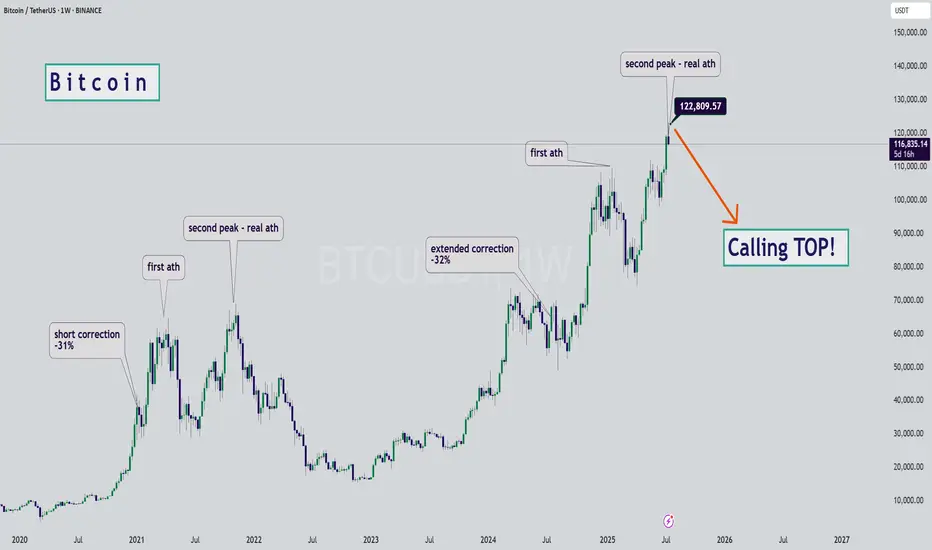
BTC - Calling the Start of the Bearish SeasonHello Watchers ☕
This was my previous Bitcoin update where I had a target of $116K, and also then closed all open positions at $122K:
I'm calling the top here mainly because of the way the chart looks, it really is classic Wyckoff if you look at the duration of the current bullish cycle, which has lasted a whole 973 Days with a 564% increase. What goes up, must come down!
Just for interest sake, the previous bullish cycle ran for 600 days with a 700% increase.
Elliott Wave View: XAUUSD (Gold) Should Continue RallyElliott Wave sequence in XAUUSD (GOLD) suggest bullish view against September-2022 low in weekly. In daily, it should remain supported in 3, 7 or 11 swings to continue rally to extend higher. In daily, it ended ((4)) correction in 7 swings sequence at 3120.20 low in 5.15.2025 low against April-2025 peak. Above May-2025 low, it should continue rally targeting 3589 or higher levels, while pullback stays above 3246.55 low. In 4-hour, it placed 1 at 3452.5 low in proposed diagonal sequence. Within 1, it ended ((i)) at 3252.05 high, ((ii)) at 3245.20 low, ((iii)) at 3365.93 high, ((iv)) at 3245.20 low & finally ((v)) ended at 3452.50 high. It ended 2 in 7 swings correction at 3246.55 low in 6.29.2025. Within 2 pullback, it ended ((w)) at 3340.18 low, ((x)) at 3398.35 high & ((y)) at 3246.55 low in extreme area. It provided short term buying opportunity in extreme area, corrected 0.618 Fibonacci retracement of 1.
Above 2 low, it is showing nest in 1-hour sequence expecting further rally. It needs to break above 6.15.2025 high of 3452.5 to confirm the upside to extend daily sequence. Short term, it placed ((i)) of 3 at 3365.70 high, ((ii)) at 3282.43 low, (i) of ((iii)) at 3374.96 high & (ii) of ((iii)) at 3319.50 low. It is showing higher high since 2 low in 5 swings, which can be nest or a diagonal sequence, if breaks below 7.09.2025 low before rally higher above 6.29.2025 low. In (i), it ended i at 3330.32 high, ii at 3309.91 low, iii at 3374.02 high, iv at 3353.43 low & v at 3374.96 high. In (ii) pullback, it placed a at 3340.76 low, b at 3366.38 high & c as diagonal at 3319.50 low. It already broke above (i) high, confirmed upside can be possible as long as it stays above 3319.50 low.
Currently, it favors pullback in ii of (iii), while placed i at 3377.48 high. It expects pullback in 3 swings to hold above 3319.50 low before rally continue in iii of (iii). The further upside confirms when it breaks above 3452.50 high. Five swings rally from 6.29.2025 low, suggests more upside should be unfold. The next leg higher expects to erase the momentum divergence in 1-hour to be (iii) of ((iii)). Alternatively, if it breaks below 7.09.2025 low, it can be pullback against 6.29.2025 low, while ended ((i)) in diagonal at 3377.48 high. Gold is choppy after April-2025 peak. It can even do double correction, if breaks below 6.29.2025 low, correcting against May-2025 low before rally continue. We like to buy the pullback in 3, 7, or 11 swings pullback as it is bullish in weekly sequence.

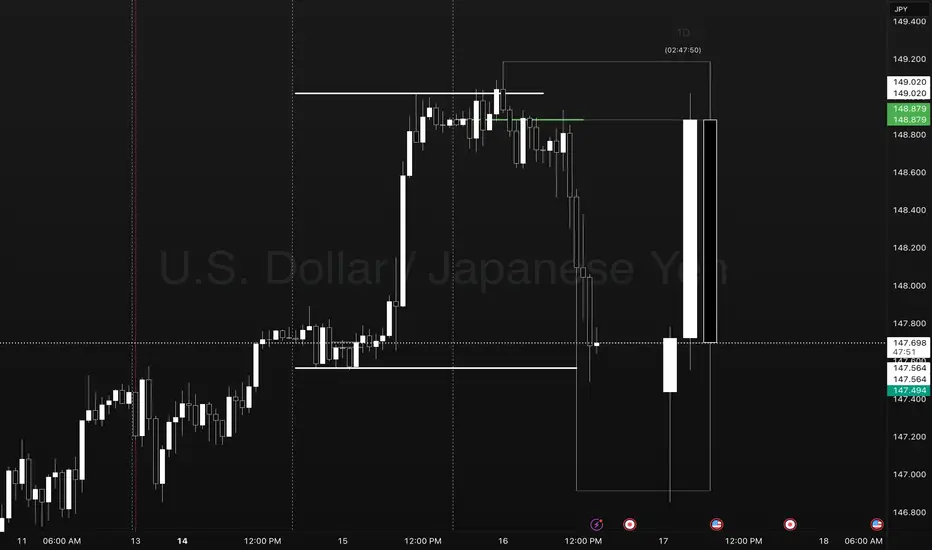
Pump Coil Dump Day 1-2-3 USDJPYUSDJPY Reversal Trade.
Points to Notice
Day 1 - Sets the new week high and low. Establishes a new week closing price as a target for a day 3 setup.
Day 2 - Typically expands Mondays range in the direction of the underlying oder flow. This occurs as a pump/ dump leading to the Asia and London coil sideways.
Day 3- We take note of the previous day high and low to observe price going into the NY session. In this case Price gave signs of a coiling reversal into the evening setting up for the move below Day 2 closing price.
Ideally what you want to see in this template is traders faked into a breakout move in the direction of the pump. This can present as a candle close above yesterdays high or closing price.
After trapping traders in we see the change in order flow creating a new lower low. This is the confirmation to look for an entry at the previous days closing price.
We set a stop at the high of day 3 level or at the previous days high with a target at the previous days low. In extreme cases we may see a setup that expands to the LOW level.
THE ONLY IMPORTANT DATA POINTS.
- PREVIOUS DAY HIGH AND LOW
- CLOSING PRICE
- LOW HOW LEVELS
- DAY COUNT
MARKETS ONLY DO TWO THINGS
- BREAKOUT, FAIL, REVERSE
- BREAKOUT, RETEST, TREND.
ONLY LEVELS THAT ARE TRADED
- PREVIOUS DAY HIGH (STOP LOSS)
- PREVIOUS DAY CLOSING PRICE (ENTRY)
- PREVIOUS DAY LOW (TARGET) CMCMARKETS:USDJPY FX:EURUSD OANDA:USDJPY