$AAPL: Breaking Down Broader Cycle via FibsPublishing separately a specific interconnection type mentioned in idea below:
Testing this particular way of mapping the multi-scale cycles:
Economic Cycles

Altseason 2025 - Wave 3Bitcoin is approaching its next destination between $125K and $250K, and that means its time to shift focus to altcoins. We’re not in full-blown altseason yet, but the foundations are forming. BTC dominance needs to drop fast, that’s the key trigger. Once it does, the rotation into alts could accelerate quickly.
Favorites so far this cycle:
🥑 POLONIEX:GUACUSDT 🧱 MEXC:YBRUSDT ⛏️ MEXC:KLSUSDT
🌐 HTX:SYNTUSDT 🧪 MEXC:DEAIUSDT *⃣ MEXC:SAIUSDT
🔗 POLONIEX:LLUSDT 🎮 KUCOIN:MYRIAUSDT 🤖 COINEX:ENQAIUSDT

Altseason 2025 - Wave 3Bitcoin is approaching its next destination between $125K and $250K, and that means its time to shift focus to altcoins. We’re not in full-blown altseason yet, but the foundations are forming. BTC dominance needs to drop fast, that’s the key trigger. Once it does, the rotation into alts could accelerate quickly.
Favorites so far this cycle:
🥑 GUACUSDT 🧱 YBRUSDT ⛏️ KLSUSDT
🌐 SYNTUSDT 🧪 DEAIUSDT *⃣ SAIUSDT
🔗 LLUSDT 🎮 MYRIAUSDT 🤖 ENQAIUSDT

Altseason 2025 - Wave 3Bitcoin is approaching its next destination between $125K and $250K, and that means its time to shift focus to altcoins. We’re not in full-blown altseason yet, but the foundations are forming. BTC dominance needs to drop fast, that’s the key trigger. Once it does, the rotation into alts could accelerate quickly.
Favorites so far this cycle:
🥑 GUAC/USDT 🧱 YBR/USDT ⛏️ KLS/USDT
🌐 SYNT/USDT 🧪 DEAI/USDT *⃣ SAI/USDT
🔗 LL/USDT 🎮 MYRIA/USDT 🤖 ENQAI/USDT

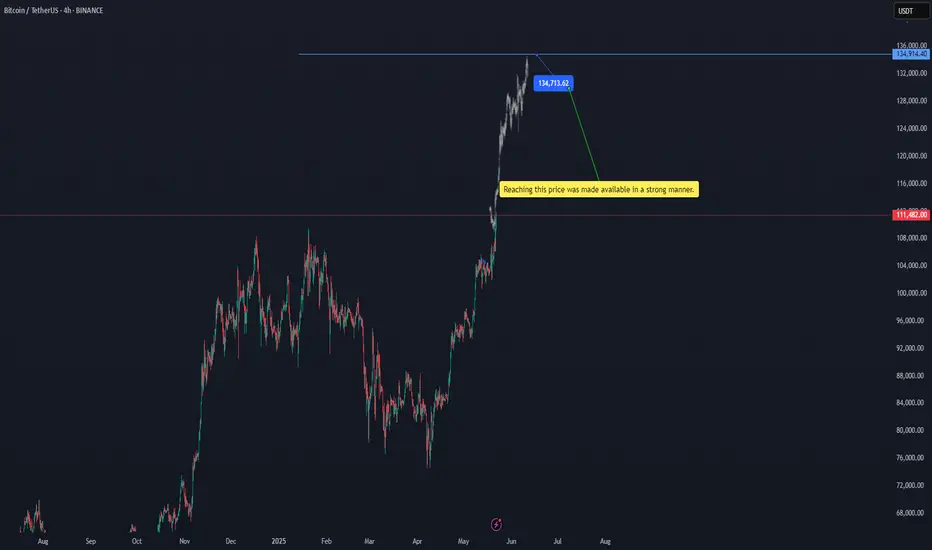
btcusdtReaching this price was made available in a strong manner. 134713.16$ BINANCE:BTCUSDT
Of course, there is a possibility of a temporary correction at the current price, but the target is $134,713.
#btc
BITCOIN's PUMPs are Getting LARGER this Bull Market...However, it may take a bit longer to realize those expansionary moves.
If Bitcoin adheres to the established cycle pattern, we can anticipate a minimum surge of 103% that should carry us into the fourth quarter of this year.
Consolidation ----> Fake breakdown ----> then expansion.
Are you ready?

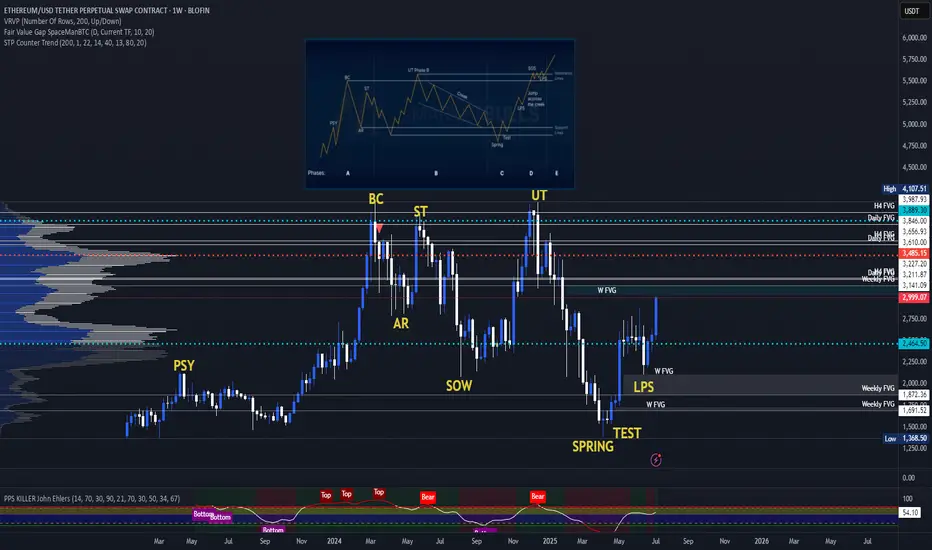
ETH Wyckoff Re-AccumulationETH (and many of the major altcoins) has a macro re-accumulation going on right now. The targets would be well beyond our current all-time highs. There has been a lot of bullish news recently with large investors buying heavily into ETH, which should act as a catalyst to jump-start the mark-up phase of this re-accumulation and "Jump Across the Creek" as they say.
BTCUSDTBitcoin may be looking to complete the downward correction from the $101,000 price range to $99,000 and then begin a long-term upward trend. Pay close attention to the extent of the correction and don't give in to fear or greed.
In any case, it should go to $1300,000.
BINANCE:BTCUSDT

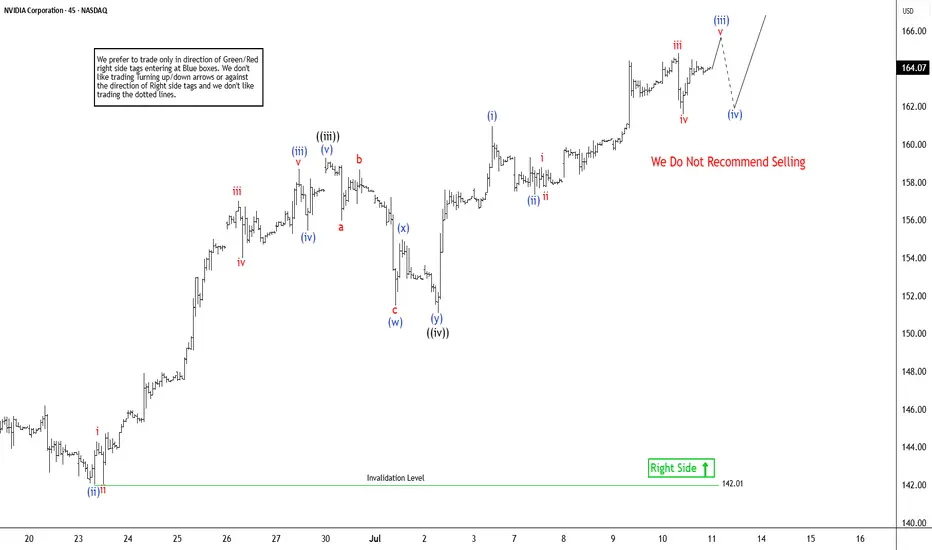
NVIDIA ($NVDA) Elliott Wave Outlook: Larger Pullback on the HoriNvidia (NVDA) continues its remarkable ascent, consistently reaching new all-time highs and reinforcing a robust bullish outlook. The ongoing rally, which began from a significant low on April 7, 2025, remains structured as an impulsive wave pattern, indicative of strong upward momentum. However, despite the potential for further short-term gains, the cycle appears mature. This suggests a larger-degree pullback could be imminent. Investors should exercise caution when considering chasing this rally in shorter time frames, as the risk of a corrective move grows.
In the short term, the cycle initiated from the June 2 low is progressing as a lower-degree impulse. From this low, wave ((i)) peaked at $144, followed by a corrective pullback in wave ((ii)) that concluded at $137.88. The stock then surged in wave ((iii)) to $159.42. The subsequent wave ((iv)) correction unfolded as a double-three structure, with wave (w) ending at $151.49, wave (x) at $154.98, and wave (y) completing at $151.10, finalizing wave ((iv)). Currently, Nvidia is advancing in wave ((v)), exhibiting a five-wave subdivision. Within this, wave (i) of ((v)) reached $160.98, with a minor pullback in wave (ii) concluding at $157.34. As long as the pivotal low at $142.01 holds, any near-term pullbacks are likely to attract buyers in a 3, 7, or 11-swing pattern, supporting further upside potential. This technical setup underscores Nvidia’s strength but highlights the need for prudent risk management.
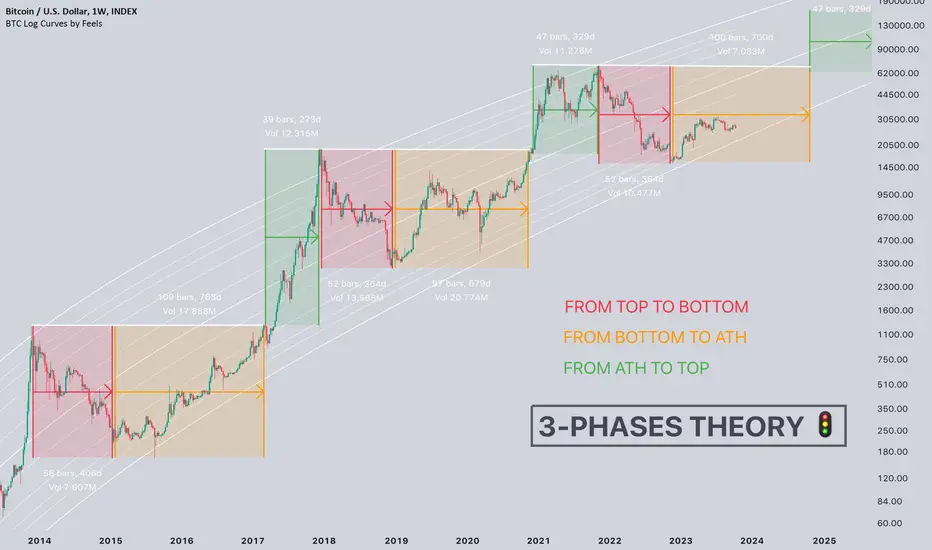
#Bitcoin 3 Phases Theory 🚦Today I saw a headline that surprised me "The current bear market has become the longest in the history of the crypto industry"📰
And I had a question about whether they were living in the past, or where they saw the bear market.🤔
💡I want to remind you that it ended with a duration of exactly one year, just like the last cycle. And it was much shorter than in 2014.
Now CRYPTOCAP:BTC is +70% from the bottom, this is a classic phase of accumulation.
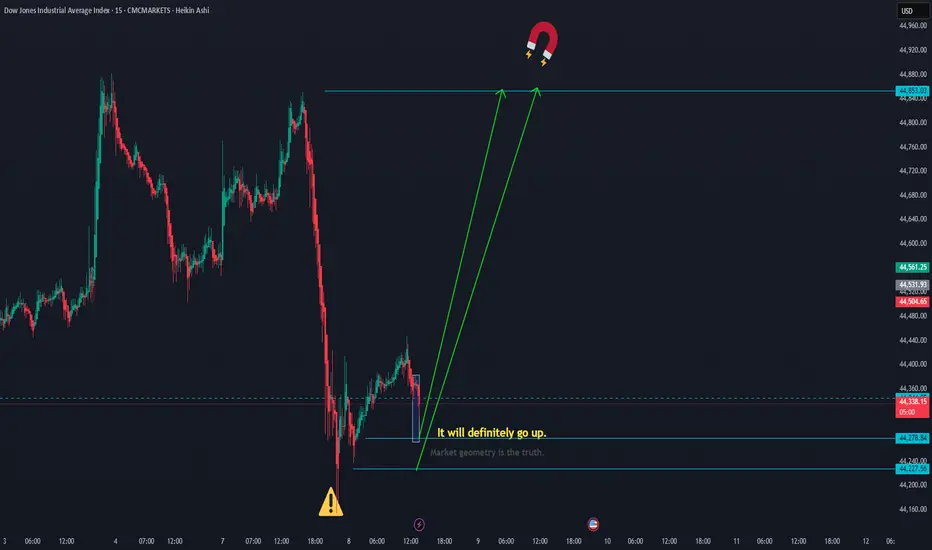
The dowjones should move upThe Dow Jones should move up to 44,853.
The levels 44,278.84 and 44,227.56 are good potential points for a bullish reversal. CMCMARKETS:US30
The price is climbing toward the top of the channel.OANDA:XAUUSD
We are currently in a wide descending channel on the 1-hour timeframe, and a potential move upward toward the top of the channel is expected.
Note: Our previous analysis on gold (XAUUSD) remains valid and intact.

ETHUSDTThis is very easy...
best support level 2300 to 2500 for jump price. but was needed for jump price for get enrgy for movement to high levels by fake breakout.
First level of resistance 2800 to 3000.
⚠️Control Money Management in your capital.

Are we in for a 3-wave cycle in BTC? 👀#Bitcoin Keltner Channels 📈
The current BTC cycle is often compared to the cycle of 2020 or 2016. Well, let's consider what if this cycle is different.
In the first cycle, we did not have substantive and protracted corrections. The second cycle had a more pronounced mid-cycle peak, and a longer consolidation after it, and even then the 2nd wave of movement.
The current cycle can have a 3-wave movement. What does this indicate?
💡For example, if now the ETF inflow continues to be positive, and in a month everyone will understand that the halving is very soon, this may lead to the fact that there will be no substantial corrections for another 2-3 months.
📝The third wave will begin already after a decrease in sales from miners and an increase in liquidity from lowering interest rates and infusions into the economy.

Lower time frameI've shared an analysis from a lower time frame, that could indicate the start of a big move.
