EUR/USD forecast: Currency Pair of the WeekThe EUR/USD poked its head above the June high of 1.0916 to reach its best level since March, after the US Empire State Manufacturing Index came out weaker than expected earlier. The US dollar has remained under pressure against most major currencies, albeit not so much against the likes of the New Zealand dollar following last week’s dovish RBNZ meeting. Still, against the likes of the euro and pound, as well as gold, the greenback has fallen further after last week’s weaker-than-expected US CPI data boosted expectations that the Federal Reserve will loosen its monetary policy at its September meeting. Already cutting rates in June, the European Central Bank will be in focus again this week. This time, no rate cuts are expected from the ECB, which, together with reduced political uncertainty in Europe and weakness in US data, should all help to keep the euro supported against the US dollar, maintaining the short-term EUR/USD forecast in bulls’ favour.
EUR/USD forecast: Key macro highlights this week
Apart from retail sales and a handful of other macro pointers, the US economic calendar is quite quiet this week. The same could be said about Europe’s data calendar had it not been for the ECB policy decision on Thursday. Here are this week’s key macro highlights, relevant to the EUR/USD pair:
- Tuesday -
US Retail Sales & Core Retail Sales m/m
- Wednesday -
US Building Permits
US Industrial production m/m
- Thursday -
Eurozone Main refinancing rate & monetary policy statement
US unemployment claims
ECB Speech
EUR/USD forecast
Already, we have seen the Empire State Manufacturing Index print a below-expected -6.6 reading this week, which helped to keep the pressure on the US dollar. But it is all about retail sales on Tuesday, when building permits and industrial production data will be published too.
US retail sales expected to fall
The health of the US consumer is deteriorating, as was reflected by last month’s release of the May retail sales estimate, which came in at just +0.1% month-over-month. That followed a downwardly revised 0.2% fall in April. Sales at gasoline stations were particularly weak last time, falling 2.2%, while those at furniture stores, an indication of demand for long-lasting goods, slipped 1.1%. Meanwhile, recent data releases have mostly surprised to the downside and inflation has cooled more than expected. If retail sales again disappoint, then the odds of a September rate cut could surge, especially in light of last week’s weaker consumer inflation data (and UoM’s Inflation Expectations survey).
ECB rate decision
The European Central Bank’s next rate decision is on Thursday, July 18 at 13:15 BST. Don’t expect any fireworks this time, after it delivered its first rate cut in June. That decision was built up so much by the ECB that they simply had to cut even if policymakers were unsure about the path of inflation. Indeed, the minutes of that meeting have since revealed greater uncertainty in ECB staffs’ outlook for inflation, while private consumption showed no convincing evidence of picking up either. The ECB will remain data-dependent, something which Christine Lagarde highlighted at the last press conference in June and said there will be no pre-commitment to a particular rate path. So, don’t expect another rate cut at this meeting, but watch out for clues about the next move.
EUR/USD forecast: Technical analysis
The EUR/USD has broken above a couple of bearish trend lines that were there from July and December of last year. Rates have also moved and stayed above their 21-day exponential and 200-day simple moving averages. The technical EUR/USD forecast is therefore bullish as things stand. But given that it had struggled around the current levels between 1.0900 to 1.1000 area earlier this year, I wouldn’t be surprised if it hangs around for a few days here, potentially until the ECB rate decision is out of the way. Still, the short-term path of least resistance is clearly to the upside, so I wouldn’t necessarily look for bearish trades here unless the charts tell me otherwise. Key short-term support is now seen between 1.0840-1.0865 area, followed by 1.0800, where the 200-day average now resides.
Economicdata

75: China Export Analysis - Fundamental and Technical OverviewThe European Union (EU) and the United States have increased scrutiny and imposed higher tariffs on Chinese imports, particularly electric vehicles and strategic materials like gallium and germanium. These measures are designed to protect domestic industries from what are perceived as unfair trade practices and subsidies by the Chinese government.
Additionally, the EU's new Critical Raw Material Act and battery regulations aim to reduce dependency on Chinese imports and secure supply chains for critical technologies. These regulatory changes have led to a noticeable decline in Chinese exports to the EU.
In response, China has imposed export restrictions on key materials, further straining trade relations. These geopolitical tensions and trade barriers have significantly impacted China's export figures.
Currently, China's export trend is showing a downward trajectory. The export figures have struggled to reach the $350 billion mark and are at risk of dropping significantly lower, potentially towards the $140 billion level.
Chart Overview:
Trend Line: A clear downtrend is visible on the chart, with lower highs and lower lows indicating sustained pressure.
Support and Resistance Levels:
Resistance: The $350 billion level is the upcoming resistance. That has not yet been reached.
Support: Immediate support is observed around $250 billion. A break below this level could accelerate the downward move towards $140 billion.
Will We Reach $350 Billion or Go Lower?
Given the current economic and geopolitical landscape, it seems still likely that China will reach the $350 billion export mark in the near term because there has not been a really corrective wave in the chart. But the downward pressure from increased tariffs, export restrictions, and the EU's push for supply chain independence are significant hurdles. If these conditions persist, a further decline is a plausible scenario.

Premium Gold idea for this upcoming week $$$Based on historical trends and current market conditions, XAU/USD is likely to be bearish for day trading with a starting price of 2414.44. Traders should monitor real-time market dynamics and economic data releases for potential price movements throughout the upcoming week.
Entry: 2414.44
SL: 2422.72
Target 1: 2370.95
target 2: 2332.10
#Xauusd #bearishtrend #daytrading #marketanalysis #financialmarkets #priceprediction #economicdata #realtimemarketdynamics
Like share comment and click the follow button for more

China Caixin PMI SummaryChina Caixin PMI Summary
Surveys completed by 650 SME's in China have indicated that China's smaller manufacturing and service providers remain in expansionary mode in April 2024 with all three data releases coming in as expected or higher than expected with readings >50 = Expansionary.
Manufacturing - 51.4
Increased from 51.1 in Mar 2024 to 51.4 in Apr 2024
✅Above expectations of 51
Services - 52.5
Decreased from 52.7 in Mar 2024 to 52.5 in Apr 2024
✅In line with expectations of 52.5
Composite - 52.8
Increased from 52.7 in Mar 2024 to 52.8 in Apr 2024
✅Above expectations of 52.5

SPY Daily - Rising WedgeTreading lightly here as the SPY looks to be right at the end of a bearish rising wedge following a bearish ABCD Elliot Wave heading into a major week economically speaking. On Wednesday we have retail sales numbers, core CPI, and Core CPI YOY coming out, followed by jobless claims on Thursday. Will be watching closely, some support levels and RSI-based supply and demand zones to keep an eye on in the meantime, bearish and hedged- (Original Chart Attached Below)
- Rising Wedge following a bearish ABCD Elliot Wave
- Hidden Bearish Divergence on the RSI
- Sitting right on its 50-Day SMA
- Bearish ABCD Elliot Wave

Today's Gold Price and Future DirectionAmidst prolonged tensions in the Middle East, global gold prices have surged, defying expectations despite robust economic data from the U.S. The sharp rise in gold prices comes as Israel signals readiness to retaliate against Iran's attacks, disregarding calls for restraint from Western nations.
In the face of escalating geopolitical tensions, global gold prices show no signs of slowing down, with projections pointing towards a potential climb to the $2460 mark. Additionally, the metal is approaching a critical Fibonacci 1.618 profit-taking level, aligning with predictions from Dow Theory."

Cracking the Code: XAU/USD Insights TodayToday, gold continues its upward momentum, eyeing the $2,400 milestone. Fueled by a weakening U.S. Dollar and subdued Treasury yields, gold remains a safe haven amidst global uncertainties. However, attention turns to Federal Reserve policymakers whose upcoming speeches may sway market sentiment. Stay tuned for key economic data releases and policy whispers shaping gold's trajectory.

Macro Monday 38 ~ The EU & German ZEW Economic Sentiment IndexMacro Monday 38
The Euro Area ZEW Economic Sentiment Index &
The German ZEW Economic Sentiment Index
(Released this Tuesday 19th Mar 2024)
ZEW is the German acronym for the Zentrum für Europäische Wirtschaftsforschung, which translates to the Centre for European Economic Research.
There are two releases from the Centre for European Economic research we will cover today both being released this coming Tuesday;
1. The Euro Area ZEW Economic Sentiment Index
(Reading of 25 for Feb 2024)
2. The German ZEW Economic Sentiment Index
(Reading of 19.9 for Feb 2024)
EURO AREA ZEW INDEX
This index is derived from 350 economists and analysts that operate from and represent the overall European Area. They include economists and analysts from different countries in the Eurozone that are using the Euro as their currency (20 countries out of the 27 members). In summary, while the EU ZEW index provides a broader perspective for the entire eurozone than the German ZEW Index discussed below, the exact methodology for distributing the surveys and their apportionment across individual countries within the eurozone is not explicitly disclosed. Historically, this index has proven very useful as a leading indicator of sentiment for the European Economy and it is closely monitoring for gauging economic sentiment in the EU by market participants.
EURO AREA ZEW CHART - SUBJECT CHART ABOVE
How to read the chart
The index ranges from -100 (pessimism) to +100 (optimism). 0 is neutral however the historical average reading for the EU chart is 21.39 which is the point where the red area meets the green area on the chart. We show on the chart if we are above or below the average levels of optimism.
The current reading of 25 indicates current optimism among analysts for the next 6 month
The Trend
Sentiment made a recovery from -60 in Sept 2022 to +25 in Feb 2024. We have moved from deep in negative sentiment territory to just above the historical average of the chart which is 21.39.
GERMAN ZEW INDEX
The German ZEW Index data is not derived from all the countries in Europe, it is derived from the views of collection of 350 economists and analysts that operate from and represent the German economy. As Germany is the largest economy within the Euro Area, its performance significantly impacts the overall region and this this metric could be considered the economic sentiment spearhead of Europe. Germany is also the 4th largest economy in the world by nominal GDP. As of 2023, its nominal GDP stands at approximately $4.43 trillion. This index could be monitored as a measure of not only European sentiment but as an important global sentiment gauge.
GERMAN ZEW INDEX CHART
How to read the chart
The index ranges from -100 (pessimism) to +100 (optimism). 0 is neutral however the historical average reading for the German ZEW chart is 20.79 which is the point where the red area meets the green area on the chart. We show on the chart if we are above or below the average levels of optimism.
The current reading of 19.9 indicates current optimism among analysts for the next 6 months, however we are below the historical average of 20.79 thus a definitive move above this level this coming Tuesday could be a confirmation step into potential sustained optimism.
The Trend
Sentiment made a recovery from -61 in Sept 2022 to +19.9 in Feb 2024. We have moved from deep in negative sentiment territory into positive numbers but we are not above the historic average of 20.79 yet.
Lets see how both perform this coming Tuesday. The beauty of these charts is that you can review both on my Trading View at any stage, press play and it will update with the most recent release. This way you will have a full explainer of what this dataset is and can keep yourself up to date on its direction with the color coded map, the average line and the neutral line, all of which will at a glance give you a good indication of where we stand in terms of trend and sentiment. I'll keep you informed here too
Thanks for coming along
PUKA

Macro Monday 13~Purchase Managers IndexMacro Monday 13
ISM Purchasing Managers Index
The ISM Purchasers Managers Index (PMI) measures month over month change in economic activity within the manufacturing sector.
The PMI is a survey-based indicator that is compiled and released each month by the Institute for Supply Management (ISM). The survey is sent to senior executives at more than 400 companies in 19 primary industries, which are weighted by their contribution to U.S. Gross Domestic Product (GDP).
A PMI above 50 represents an expansion in manufacturing when compared with the previous month. A PMI reading under 50 represents a contraction while a reading at 50 indicates no change. The further away from 50, the greater the level of change.
According to Investopedia "ISM data is considered to be a leading indicator of economic trends. Not only does the ISM Manufacturing Index report information on the prior two months, it outlines long-term trends that have been building over time based on prevailing economic conditions".
The ISM reports are released on the first business day of each month for the month that has previously closed. Thus, they are some of the earliest indicators of current economic activity that investors and business leaders get regularly. Something to look out for next Monday 2nd October 2023.
The PMI focuses mainly on the five major survey areas;
1. Employment (20%)
2. New orders (30%) Covered in Macro Monday 6
3. Production/Output (25%)
4. Inventory levels (10%)
5. Supplier deliveries (15%)
We covered the ISM New Orders Index in Macro Monday 6 as it is the largest component of the Purchaser Managers Index making up 30% of the overall index. I will leave a link to the chart.
The Chart
The chart outlines the last 12 recessions (shaded red zones) with the PMI readings over the same period. As we are already aware above 50 on the PMI reading is expansionary and below 50 is contractionary (red thick line).
Three Main Findings
1. In 11 out of 12 recessions a PMI reading at or below 42 was established. This means if the PMI falls to 42 there is a 92% probability of a recession. At present we have not reached that level, we are currently at 47.6.
2. The PMI has bottomed 10 out of 12 times in Quarter 1 (between Jan – March) with the remaining two bottoms happening in Quarter 2 (both in May). This means that 83% of the time the PMI cycle appears to bottom in Quarter 1 with the most bottoms in January (6) with Feb(2) and May(2) in close second place.
- It’s worth noting that the bottom of the PMI cycle
may not be the bottom of a stock market cycle. If
we are forward looking then a rising PMI is positive
for the economy and markets but ideally a move
above 50 is the true signal of economic expansion
from a manufacturing standpoint.
3. The average PMI bottom to bottom cycle timeframe over the past 6 cycles is 58 months with the shortest being 37 months and the longest being 86 months. We are currently at month 38 and the average month of 58 is Jan 2025 with the max of 86 months being May 2027.
- How interesting is it that both these potential PMI
bottom dates line up with our two most frequent
PMI bottom months indicated in point 2 (January
and May).
- Interestingly according to U.S. government
research, since WWII the business cycle in America
takes, on average, around 5.5 years which closely
aligns with our 58 month (or roughly 5 year)
indication for the PMI chart. The business cycle
incorporates an aggregate of economic data such
as the ISM data, GDP and income/employment
metrics. We might cover the business cycle in more
detail on a future Macro Monday.
The ISM New Orders Index (30% of the PMI)
Similar to the ISM New Orders Index Chart (covered in Macro Monday 6) which makes up 30% of the PMI, we have not reached below the 42 level on this chart either which has provided a 100% confirmation of recession when we have had a definitive move below the 42 level historically.
For ISM New Orders if we stay below a sub 50 level on the ISM New Orders Chart for greater than 7 months it has resulted in a recession every time except for 1966 and 1995 (8 out of 10 times). We are currently 14 months below the 50 level which is unprecedented, with the new orders index nudging a little lower on the August reading from 47.3 down to 46.8.
ISM Data Release 2nd October 2023
When we receive our next ISM Data release next Monday 2nd October 2023 we can refer back to the PMI chart and the New Orders Index Chart and see how things have progressed and if we have reached and critical levels.
These charts and the others I have completed on Macro Mondays are all designed so that you can revisit them at any point and press play on TradingView and see if we are breaking new into higher or lower risk territory.
I hope they all help towards your investing and trading decisions.
Have a great Monday guys, Lets get after it!
PUKA

Understanding Initial Jobless Claims as a Market IndicatorIntroduction
In the complex and multifaceted world of economic indicators, initial jobless claims hold a special place. As a measure of the number of individuals filing for unemployment benefits for the first time, this statistic offers a real-time glimpse into the health of the labor market, which in turn is a vital component of the overall economic landscape. This article delves into how initial jobless claims function as an indicator and their impact on the financial markets.
Understanding Initial Jobless Claims
Initial jobless claims refer to claims filed by individuals seeking to receive unemployment benefits after losing their job. These are reported weekly by the U.S. Department of Labor, providing a timely snapshot of labor market conditions. A lower number of claims typically signifies a strong job market, suggesting that fewer people are losing their jobs. Conversely, an increase in claims can indicate a weakening labor market, often a precursor to broader economic downturns.
Initial Jobless Claims as an Economic Indicator
Health of the Labor Market: The primary significance of initial jobless claims is its reflection of the labor market's health. A steady, low number of claims often correlates with job growth and declining unemployment rates, indicating a robust economy.
Leading Indicator for the Economy: As a leading economic indicator, jobless claims can provide early signals about the direction of the economy. Spikes in claims can forewarn of economic contraction, while consistent decreases might indicate economic expansion.
Consumer Spending: Since employment directly affects consumer income, initial jobless claims can also indirectly signal changes in consumer spending, a major driver of economic growth.
Impact on Financial Markets
Market Sentiment: Traders and investors closely watch initial jobless claims to gauge market sentiment. Fluctuations in these numbers can lead to immediate reactions in the stock, bond, and forex markets.
Monetary Policy Implications: Central banks, like the Federal Reserve, consider labor market conditions when setting monetary policy. Rising jobless claims can lead to a more dovish policy stance (like lowering interest rates), while decreasing claims might justify tightening policies.
Sector-Specific Implications: Certain sectors are more sensitive to changes in jobless claims. For instance, a rise in claims can negatively impact consumer discretionary stocks but might be favorable for defensive sectors like utilities or healthcare.
Analyzing the Data
Understanding initial jobless claims requires context. Seasonal factors, temporary layoffs, and unique economic events (like a pandemic) can skew data. Analysts often look at the four-week moving average to smooth out weekly volatilities for a clearer trend.
Conclusion
In conclusion, initial jobless claims serve as a crucial barometer for the economy and financial markets. Investors, policy makers, and economists alike monitor these figures for insights into labor market trends and the broader economic picture. As with any indicator, it's essential to consider jobless claims in conjunction with other data to fully understand the economic landscape.

$EURUSD Correction ImminentFX:EURUSD has been navigating sideways since January amid economic challenges, rising interest rates, and Western economic uncertainties.
Approaching yearly resistance at 1.10806, a rebound towards 1.05335 support is expected. By the end of the first financial quarter, a breakthrough of yearly resistance is anticipated, solidifying new support.
This aligns with expectations of improved global financial conditions and a revival of consumer confidence.
#ForexAnalysis #EURUSD #FinancialMarkets #EconomicOutlook #TradingStrategy #MarketTrends #GlobalFinance #CurrencyPairs #YearlyResistance #SupportLevels #ConsumerConfidence #FinanceNews

Unemployment Rate Double Bottoming at a 0.786The Unemployment Rate looks like it's getting ready to spike higher as it Double Bottoms at the 0.786 and cracks above the 21SMA. If this plays out, it will likely spike to the highs or even make a new higher high. During all of this, I expect the macroeconomic data charts below to also play out:
Consumer Credit Balances:
The Mortgage ETF:
US Interest Rates:
The REITs Sector:

Industrial metals continue to face headwinds as Chinese data disIndustrial metals were the worst performing commodity sector last month and were down 2.7%1. Over the last six months, the sector is down 15.2% and has created the biggest drag on the overall performance of commodities.
China's real estate sector, once the engine of its economy, is now teetering on the edge of crisis because of excessive borrowing, overbuilding, and a housing slowdown. The government's crackdown on risky practices and sudden intervention in 2020 to prevent a housing bubble have led to over 50 Chinese developers defaulting or failing to make debt payments in the last three years. The consequences include reduced consumer spending due to falling housing prices, disappearing jobs tied to housing, and decreased business confidence. While policymakers have taken modest steps to address the situation, the real estate turmoil has spread to financial institutions and the broader economy, prompting concerns of a larger crisis. A build-up in industrial metal inventories over the last 3 months is consistent with market expectations of ample supply of the metals for the rest of the year, given relatively modest demand. Zinc inventory is up 96% while lead inventory is up 85% compared to 3 months ago.
This is clearly weighing on sentiment towards industrial metals. Copper (COMEX) was down 2.8%1, and aluminium down 2.8%1. The only bright spot in the basket was lead, which was up 3.7% last month. Speculative positioning in COMEX copper has been oscillating between positive and negative territories in recent months and entered negative territory again last month after briefly becoming positive2. COMEX copper inventory is up around 46% compared to 3 months ago. And although copper held in COMEX is one of the smaller stores of the metal, when combining London Metal Exchange, Shanghai Futures Exchange and COMEX, copper inventory is still 27% above where it was 3 months ago.
Nickel was down 5.7% last month1. Although nickel is widely known for its use in electric vehicle batteries, a growing market, it still draws around two-thirds of its overall demand from the production of stainless steel. China's steel market has been facing pressure in August due to continued high steel production despite sluggish end-user demand. Blast furnace utilization rates have risen, but some local mills in key steelmaking provinces like Hebei and Jiangsu have not received official communication about output reductions. Uncertainty surrounds the extent of China's steel output cuts for the rest of the year, with expectations of smaller scale cuts targeting environmentally sensitive regions. Rising steel inventories are attributed to robust production and weak demand. Despite potential production cuts, market sentiment remains cautious due to these challenges, and steel prices have declined. This, in turn, is weighing on nickel.
Source:
1 Bloomberg as of 21 July 2023 to 21 August 2023
2 Commodity Futures Trading Commission (CFTC) as of 15 August 2023
3 change in inventory over the past 3 months by United States Department of Agriculture
This material is prepared by WisdomTree and its affiliates and is not intended to be relied upon as a forecast, research or investment advice, and is not a recommendation, offer or solicitation to buy or sell any securities or to adopt any investment strategy. The opinions expressed are as of the date of production and may change as subsequent conditions vary. The information and opinions contained in this material are derived from proprietary and non-proprietary sources. As such, no warranty of accuracy or reliability is given and no responsibility arising in any other way for errors and omissions (including responsibility to any person by reason of negligence) is accepted by WisdomTree, nor any affiliate, nor any of their officers, employees or agents. Reliance upon information in this material is at the sole discretion of the reader. Past performance is not a reliable indicator of future performance.

The case for a Weaker Yuan
The most recent Caixin Manufacturing PMI dipped below 50, landing back in contraction territory after two prints above the 50-mark. As the world's top exporter, China is acutely sensitive to fluctuations in both exports and manufacturing numbers. Historically, we've seen periods of Yuan devaluation during times of contracting Manufacturing PMI and exports as China works to invigorate export demand. With the latest PMI number trending lower, it's worth pondering whether this signals a movement toward a weaker Yuan.
A more detailed examination of Chinese economic data presents some reasons for concern. Chinese export-related economic data has collectively taken a downward turn. This could stimulate further Yuan weakening as the government strives to reinvigorate exports.
Moreover, as the world's second-largest oil importer, lower oil prices gives China additional leeway in weakening its currency, as the ripple effects of higher oil prices are tempered.
From a technical perspective, the CNH is teetering on the edge of the 200-day moving average, and prices have once more nudged above the 0.382 Fibonacci retracement level.
Meanwhile, in a shorter timeframe, we notice price action breaking out of the ascending triangle and nearing the top of the wedge pattern.
With the USD breaking to the upside coupled with the potential for a weakening Yuan, we think this makes the case for a higher USDCNH. Taking a risk-managed long at the current level of 6.9520, a prudent stop 6.8930 and take profit level at 7.0900. A Standard Size USD/Offshore RMB (CNH) Futures represents 100,000 USD. Prices are quoted in RMB per USD, each 0.0001 per USD increment equal to 10 CNH.
The charts above were generated using CME’s Real-Time data available on TradingView. Inspirante Trading Solutions is subscribed to both TradingView Premium and CME Real-time Market Data which allows us to identify trading set-ups in real-time and express our market opinions. If you have futures in your trading portfolio, you can check out on CME Group data plans available that suit your trading needs www.tradingview.com
Disclaimer:
The contents in this Idea are intended for information purpose only and do not constitute investment recommendation or advice. Nor are they used to promote any specific products or services. They serve as an integral part of a case study to demonstrate fundamental concepts in risk management under given market scenarios. A full version of the disclaimer is available in our profile description.
Reference:
www.cmegroup.com

THE MOST USEFUL TRADING SITES ...and how to utilize themIn this post, I will share the some of the most useful trading sites that are available to you and how you are able to utilize them to your advantage whether it's for fundamentals, charting, analysis, performance tracking, news events or just to follow your favorite professionals and their ideas & education that they share publicly.
First and foremost, if you haven't made this your PRIMARY trading platform, I want to encourage you to use and SUBSCRIBE to TRADINGVIEW
As we all evolve as traders, I'm sure we can all relate to one thing in common which is hard work and dedication. Trading is one of the hardest professions out there and without hard work, practice and dedication, we know that 90% of traders fail to make it in this industry. TRADINGVIEW gives you all the resources you need to be able to become one of the 10% as it enables you to become a content creator, it gives you a community to research ideas, you're able to watch livestreams, catch news flows, back test & analyze your own strategies and most importantly of all, you have direct support team to help guide you by sharing their own personal trading experiences, publicly as well as privately. Whether your choice of market is Forex, Stocks, Crypto, Bonds, Futures, Commodities or Yields, TRADINGVIEW has all the tools to be able get you well on your journey to become a professional trader.
See Figure 1: Subscriptions
WWW.MYFXBOOK.COM
MYFXBOOK has a variety of different tools to use ranging anywhere from position size calculators, COT data (Commitment of traders), Broker spreads/quotes/volumes, news flows, correlations and most importantly, account linked performance analysis. You may be a full time trader or a part time trader with a 9-5 job, either way analyzing your entries, exits, RR ratio, drawdowns etc. are necessary to find what works and what doesn't. Trading is about probabilities and if you're not making money in 25 trades, you need to reanalyze and change your approach. Myfxbook.com allows you to link your trading platform to breakdown your performance, ultimately being your own coach to find the approach that suits you the best.
See Figure 2: Performance Stats
WWW.TRADINGECONOMICS.COM
As many different crises happen throughout the world (especially the most recent ones within the last few years), understanding how the Federal Reserve operates to manage monetary policy is key to get an edge in your positions in the forex market. TRADINGECONOMICS gives you all the accurate information needed to be able to forecast and research throughout 196 countries like, economic indicators, exchange rates, stock market indexes, government bond yields and commodity prices. Micro and Macro economics are a big part of how this world operates and having access to all the most important information that drives the Feds decisions due to the economy being split between these two realms are valuable as they could be bridged together for more accurate forecasting.
See Figure 3: Inflation Rates/GDP Growth (By Country)
WWW.FOREXLIVE.COM
FOREXLIVE has many different helpful resources to keep you up to date in the market no matter what time zone or trading session you take part in. As our lives are busy with family, day jobs, business endeavors or simply being in different time zones, you may not be able to watch all sessions play out and in fact, taking a break from the screen is healthy for your mind and emotions. The great thing about FOREXLIVE is that you are able to read Session Wraps to keep you up to date with a summary after each session (Asian, European, U.S) completes. Psychology is a big part of why a trader either succeeds or fails which balancing your time on and off the markets are important to detach your emotions from your positions. Set a plan for how many times you will scan the charts a day and fill that in between time with activities like exercising, reading, chores, spending time with your family, going for a walk and much more.
See Figure 4: Session Wraps
WWW.INVESTOPEDIA.COM
INVESTOPEDIA was founded in 1999 headquartered in the heart of New York city U.S. This website provides comparisons of financial products, reviews, ratings, comparisons of different financial products and most importantly, it is a financial dictionary. With the broad range of information provided, it gives readers the confidence to manage every aspect of their financial life. Whether you're learning about money and investing for the first time or are looking to improve your knowledge and skills, anyone from an experienced investor, a business owner, a professional, an advisor, INVESTOPEDIA has all the information to build your skills.
See Figure 5: 4 Basic Things to Know About Bonds/Key Takeaways
WWW.INVESTING.COM
INVESTING.COM is a well known site that offers real-time market quotes, information about stocks, futures, options, analysis, commodities and most importantly an economic calendar. Keeping an eye out for the high impact news events will help you adapt and control the volatility during those peak hours. Another helpful aspect of this site is knowing what will drive the market mood for each upcoming week. The top 5 most important fundamental areas to watch for are explained and broken down to help your forecast and analysis so you can prepare your trade setups accordingly. Applying fundamental analysis along with technical analysis will help you become a better trader as when the high impact news events hit, markets get volatile which could cause a running profit turn into an absolute loss. Knowing when to be in or out of the market is valuable so you don't go into a draw down phase.
See Figure 6: Economic Calendar
As I only have mentioned a small number of sites that you are able to access, we all know there are so many other ones available out there, paid and free.
Researching and spending the time to read to broaden your knowledge in the financial world will only help you grow as a trader and essentially improve your trading results.
Check out some more free sites:
www.fxstreet.com
www.dailyfx.com
www.forexfactory.com
www.babypips.com
Please share the site that most helps you in by leaving it in the comment section. I would love to see the variety of ones available.
** If you felt this was helpful in anyway, please support by hitting the LIKE button and FOLLOW me for more educational and analysis ideas **
I appreciate all the feedback!
Thanks
Trade Safe

A Look at the Turkish EconomyAs we all know, the increase in foreign currency increases the general product prices extraordinarily, as it increases the input costs. The rise of the foreign exchange is a phenomenon that a country does not want. Every country aims to keep the exchange rate stable. But for some reason, Turkey came out of these countries.
As can be seen from this chart, from 2006 to 2020, Turkey continued to print money with a certain pattern. This is an acceptable factor for each country under certain conditions. The money supply, which increased with a trend of 23 degrees, started to rise more sharply after 2020, and especially after March 2021, the trend reached 53 degrees. This trend change is a clear indication of how fast the printing of money is. Therefore, as the money supply increases, there is a natural depreciation of the currency (Orange line shows the rising Dollar against the Turkish Lira).
In the same period, interest rates were reduced, as can be seen from the black line. By lowering interest rates, what a country normally aims at is to create consumption demand by reducing borrowing costs. Therefore, the demand for consumption has increased, and with it, demand inflation has arisen. Meanwhile, printing money decreased the value of the Turkish Lira (the exchange rate rose), which increased the input costs. The increase in input costs was reflected in the sales prices of the products. Therefore, inflation was fueled by both demand and foreign currency.
It will be impossible to know why the Turkish government did this, why it deliberately ignited inflation, which no economist can explain. If you have an idea, you can write it in the comments. Thanks.

impact of two important following news on DXYTwo important factors that been driving Dollar prices in last several month as we all know is Federal Funds Rate and Inflation data like CPI.
In this week we have both of them coming out on Tuesday and Wednesday, now we want to see how it can affect the market.
Price usually tend to be at important resistive or supportive areas at the time of important news hit the market and as we can see now price is at supporting area and at the Daily low which probably will remain here until the news hit the market so we can expect of low volatility movement on USD and other major crosses, But what will happen when the news releases?
As we know CPI balance is curving to downside and shows that inflation is cooling down and as we see the prediction of tomorrow CPI news we can see that the market expect this trend to continue. Now here is the tricky part, if CPI data put out like prediction or lower than the prediction this means that fed has the inflation under control which makes trader to believe that federal reserve would not need to raise prices very aggressively like before and as a result we may see a risk on environment in the market which can lead Dollar prices to come lower, but on the other hand SPX, TLT, EUR,JPY and also commodity currencies like AUD,NZD to take benefit from the situation.
But if CPI data comes out higher than expectation then we can argue that federal reserve do not have inflation under control so it needs to continue hiking prices like before and this situation may lead to higher prices for Dollar and lower prices for all the other assets that we covered above.
Also if the second scenario take place tomorrow we can expect USYIELD to continue going higher which have negative effect on US treasury bond and very bad effect on SPX index.
Put CPI analysis apart the other important news that can shake prices real hard is federal reserve which going to hit the market on Wednesday. On that time we can see that what exactly is in the mind of federal reserve and how they are going to impact the economy. In overall, if they raise rate same or below the expectation its going to be very good for risky assets since it shows that we are getting close to end of rate hiking cycle but if federal reserve going for raising rate higher than expectation then it will have a very good impact on Dollar but bad impact on risky assets.

XAUUSD new double bottom and potential price movementThis is the same double bottom from yesterdays rushed idea. Thursday 10th and 11th saw a rise from 1706 to 1764. Consequently, due to strong bullish pressure i have changed the neckline from 1706 to 1800. This will be determined in the coming days, if price challenges 1800, with XAUUSD needing to fill in from fib line 0.236 to 0 (This is nearly 4500 pips which seems like a lot however over the 10th and 11th of November price increased by a similar amount). If this occurs it can be considered a good indication for lasting bullish movement to come. If the arrow does get filled in and there are other strong indicators of bullish market pressure (such as candle types or chart patterns) i would look out for support and resistance and place buy signals for a semi long D1 entry and exit.
NEWS:
Friday 11th November:
Prelim UoM Consumer Sentiment came out at 3:00PM in the afternoon uk time.
FROM UNIVERSITY OF MICHIGAN
This measures the level of a composite index based on surveyed consumers.
The survey is of about 500 consumers which asks respondents to rate the relative level of current and future economic conditions.
THIS IS IMPORTANT BECAUSE FINANCIAL CONFIDENCE IS A LEADING INDICATOR OF CONSUMER SPENDING.
CONSUMER SPENDING ACCOUNTS FOR A MAJORITY OF OVERALL ECONOMIC ACTIVITY.
USUALLY: The 'Actual' is greater than 'Forecast' which is good for currency
(GREATER CONSUMER SPENDING THEN FORECASTED = MORE MONEY IN CIRCULATION + HIGHER BUSINESS CONFIDENCE = STRONGER USD
HOWEVER, ON THE 11th NOVEMBER:
ACTUAL LEVEL=54.7 FORECASTED LEVEL=59.5
THIS IS BAD FOR THE USD AS IT MEANS THERES LESS CONSUMER SPENDING WHICH WOULD DECREASE FINANCIAL CONFIDENCE WHICH WOULD WEAKEN THE USD AND THEREFORE HELP DRIVE UP GOLD PRICES. THIS COULD BE THE CLUE BULLS ARE LOOKING FOR TO KEEP PRICES UP.
IMPORTANT NOTE:
THE LAST TIME ACTUAL WAS LOWER THEN FORECASTED WAS SEPTEMBER 16TH AND WHEN THE NEWS CAME OUT AT 3, THE DOWNTREND STOPPED AND PRICE STARTED CONSOLIDATING BEFORE HAVING A SMALL BEARISH EPISODE AND EVENTUALLY HAVING BULLISH MOVEMENT OUT OF THE PRICE ZONE.
THIS SUGGESTS THAT ALTHOUGH THIS DATA HAS A SLIGHT EFFECT TO BOOST BEARISH PRESSURE, IT ISNT A STRONG EFFECT AND SO MAY NOT EFFECT PRICE AS MUCH.

US 10 Year Treasury Yield: What's Next?Quick Analysis on 10 Year Treasury Yield on a 1M Linear Chart.
1) The US 10 Year Treasury Yield has been respecting a falling channel for multiple decades going back to the 1980s.
2) It is currently headed to the top trendline of the channel with a possibility to break in the coming months.
3) The measured move of the falling channel would bring it back to Pre-2008 ranges.
4) This may fall in line with the US Dollar strengthening (in the idea section below).
5) If US 10 Year Treasury Yield goes lower, there is not much more room for it to get to 0.
What are your opinions on this?
If you enjoy my ideas, feel free to like it and drop in a comment. I love reading your comments below.
Disclosure: This is just my opinion and not any type of financial advice. I enjoy charting and discussing technical analysis. Don't trade based on my advice. Do your own research! #cryptopickk

SPY- Bearish Megaphone - UpdateJust posting another update here on the SPY as it closed out the week with a hard rejection off of its 200-Day SMA & a significant RSI-Based supply level. Additionally, it would appear that a bearish megaphone is still playing out as it was simultaneously rejected off the upper trendline (See previous charts below). On top of this, a bearish butterfly harmonic pattern has formed on the daily timeframe accompanied by some slight bearish hidden divergence on the RSI. On another note, the RSI is now in overbought territory & it would look like the MACD is about to form a death cross; with buyer volume decreasing relative to seller volume increasing, it will be interesting to see where the SPY goes from here, especially heading into a big week economically speaking. Just some FIB levels and RSI-based supply and demand zones to keep an eye on in the meantime- (Previous Charts Attached Below)
--Previously Charted--

This recession identifies as an apache helicopterChart displays the US inflation rate and US unemployment rate. Red zones mark recessions (from stlouisfed.org).
6/8 of the past recessions are lead by inflation rates surpassing 5%. Only the dotcom recession had an inflation rate below 5%, and the other was COVID, which we are experiencing the resulting inflation currently.
so, every time the inflation rate jumps, unemployment follows on a lag. we can see that the ends of recessions are usually marked by a declining inflation rate and peaking unemployment rate.
but remember, this is not a recession and our country is in great hands.
ECONOMICS:USIRYY
FRED:UNRATE

Stocks Markets Breakout or Reversal ? [Arabic Language]S&P500 gains a lot in the past week, is this the end or the downtrend? is it the bottom?
We should monitor the main levels here at $4200, it will tell us!

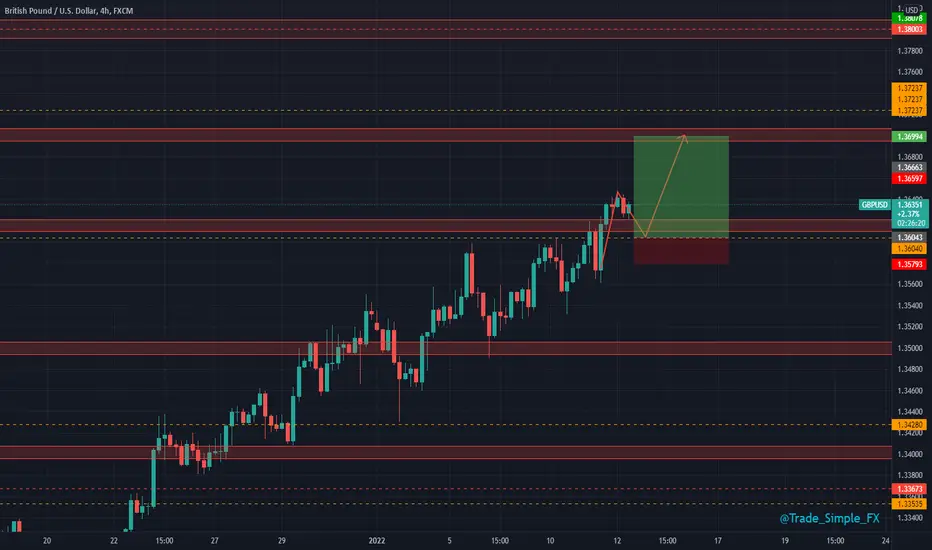
GBPUSD H4 - Long EntryGBPUSD H4
Need to trade with caution here as we have US CPI inflation data coming up this afternoon as we mentioned, but so far... This is playing out exactly as expected, we are just treading round the economic points we want to avoid unless we are holding a risk free position.
Looking for longs from this 1.36 handle as long as CPI doesn't throw us around!