Economy: A Social Science Shaped by Human Behavior and HistoryThe world of Forex trading, with its ever-fluctuating currency exchange rates and intricate financial instruments, may seem like a realm dominated by numbers, charts, and algorithms. However, beneath the surface, the Forex market is a vivid testament to the intricate relationship between economics and social behavior. In this idea, we will explore how the economy is a social science at its core, and how historical events have consistently reshaped and influenced economic dynamics.
Economics as a Social Science
At its essence, economics is not just about money; it studies how societies allocate their limited resources to satisfy their various wants and needs. The behaviors, decisions, and interactions of individuals, groups, and nations inherently influence this process. Economics is, therefore, a social science, as it explores the dynamics of human behavior and the collective choices we make.
Historical events, such as wars, pandemics, and technological advancements, have consistently demonstrated the profound impact of social behavior on the economy. Let's delve into some examples to understand this connection better.
World Wars and Economic Transformation
The two World Wars of the 20th century provide an excellent illustration of how historical events can shape the economy. These catastrophic conflicts forced nations to mobilize their resources and allocate them to the war effort. The result was significant shifts in economic priorities, with governments heavily investing in military production and infrastructure. These investments not only led to economic growth but also spurred technological innovation, such as radar and nuclear energy.
Furthermore, the post-war period witnessed the creation of international economic institutions like the Bretton Woods system, which set the stage for a more interconnected global economy. The forex market played a pivotal role in this period by facilitating international trade and currency exchange, reflecting the evolving economic landscape.
The 2008 Financial Crisis and Behavioral Economics
The 2008 financial crisis, driven by the bursting of the housing bubble and reckless lending practices, revealed the profound impact of human psychology and behavior on financial markets. Behavioral economics, a subfield of economics, studies how psychological biases and cognitive errors influence decision-making.
During the crisis, fear, panic, and herd behavior contributed to market volatility, massive losses, and a global recession. Understanding these behavioral aspects is essential for forex traders, as they need to navigate the market's emotional swings and avoid succumbing to the irrational exuberance or fear that can drive price movements.
Technological Advances and Financial Innovation
The emergence of the internet and electronic trading platforms has revolutionized the forex market, making it more accessible to individual traders worldwide. This technological shift highlights the ongoing impact of social behavior on financial markets. As more people participate in online trading, the collective decisions and sentiments of traders, often amplified through social media, can sway exchange rates in real-time.
In summary, the Forex market is not just a financial platform but a reflection of the intricate relationship between economics as a social science and human behavior. Historical events have repeatedly demonstrated how social behavior shapes economic outcomes, whether through the impact of wars, financial crises, or technological advances. To succeed in the Forex market, traders must understand and adapt to the ever-changing landscape influenced by the behaviors and choices of societies, governments, and individuals.
Do nothing.
Economy

S&P 500 Daily Chart Analysis For Week of Nov 3, 2023Technical Analysis and Outlook:
The stabilized selloff in the bond market in this week's price action sent the index raging upward all the way up to Mean Res 4378 and completing our Inner Index Rally 4375. On the downside, the index will likely go down toward the Mean Sup 4238, followed by a series of price targets marked on the chart. However, due to the reactionary nature of the market, sudden fluctuations in either direction are possible.

EUR/USD Daily Chart Analysis For Week of Nov 3, 2023Technical Analysis and Outlook:
Make no doubt that the Eurodollar has jubilantly bounced above our Inner Currency Rally of 1.070 with an eye on the ensuing Key Res 1.075 and Inner Currency Rally of 1.077. The upcoming pivotal reversal will likely take us down to Mean Sup 1.056 and Key Sup 1.047.

Bitcoin(BTC/USD) Daily Chart Analysis For Week of Nov 3, 2023Technical Analysis and Outlook:
Rest assured that the cryptocurrency has triumphantly bounced above our completed Inner Coin Rally 35000, indicating a promising upward trend towards Inner Coin Rally 36300 and beyond. However, the intermediate price action is currently posing to move lower towards Mean Sup 33600; it is only a matter of time before it regains momentum and surges higher.

🔥 The Number 1 Recession Indicator Signals Great Danger 🚨 The Sahm Rule Recession Indicator (white) is on the rise. Historically, a rise in this indicator has always signaled a recession and a corresponding fall in asset prices.
How it's calculated:
"The Sahm Rule identifies signals related to the start of a recession when the three-month moving average of the national unemployment rate (U3) rises by 0.50 percentage points or more relative to its low during the previous 12 months."
In other words, once unemployment starts to rise quickly, this indicator moves up and a recession is on the horizon.
Since it's inception in the 1950's, every time this indicator reaches above 0.3, the trend seems to be irreversible and only reverses back after the recession is "over". See the orange line for the performance of the SP500: it has an inverse relationship with the SAHM indicator.
Keep a close eye on this indicator. Seeing how fast it's rising, there's historically a huge probability that the US economy will see a recession somewhere in the next few months. Keep an eye out for bearish price action in stocks and crypto during this time.

Why Burry Bet Against the US MarketBurry has frequently expressed his views on Twitter (X), asserting that the market has not made a genuine recovery and is headed for a recession. He believes it's just a matter of time before we witness the ultimate impact.
Many individuals consider Burry to be an extreme pessimist, contending that he consistently focuses on the negative aspects. However, in the lead-up to the 2008 market crash, people also criticized him for being overly pessimistic and opposed his ideas.
The purpose of this post is to delve into his perspectives and examine some recent information I've been investigating in order to determine whether the market situation is indeed in line with his claims
Who is Michael Burry?
Michael Burry is a renowned American investor and former hedge fund manager. He gained widespread recognition for accurately predicting the 2008 financial crisis and profiting from it through his hedge fund, Scion Capital. Burry is also known for his contrarian investment style and is a proponent of value investing. His story is prominently featured in Michael Lewis's book, "The Big Short.”
Today, we will examine data that reveals the current state of the American market. Through this data, we will learn to understand the reasons behind why the market may be weaker than it appears, despite all the hype and the notion that the American market has "recovered.”
What’s Burry Concerns
Economic Concerns: Despite positive stock market performance and GDP projections, Burry, along with other notable investors like Warren Buffett, sees potential issues in the global economy.
Federal Reserve Actions: Burry and others believe this situation is unsustainable and may lead to economic stagnation next year, characterized by weak growth, rising inflation, and labor shortages.
1. Michael Burry said is
Velocity is nominal GDP/Money Supply (M2 here). QT + higher rates starting to use M2 down. Yet we are seeing a tick up in velocity, emerging from narrative obscurity, In 1978-79, rising velocity trumped failing money supply to drive inflation higher and higher redux would shock
Full Explanation:
"Velocity" is like the speed at which money moves in the economy.
Imagine money as a car. The car's speed (velocity) is how fast it's moving.
"Nominal GDP" is the total value of goods and services produced in the economy.
"M2" is a measure of the money supply, including things like cash, checking accounts, and savings accounts.
Now, let's break it down:
If the economy's car (money) is moving faster (velocity), it can boost economic growth (Nominal GDP).
"QT" means Quantitative Tightening, which is when the central bank reduces the amount of money in the economy. "Higher rates" means they raise interest rates.
When you reduce the amount of money (QT) and raise interest rates, the car (money) slows down (Velocity decreases).
When you reduce the amount of money (QT) and raise interest rates, the car (money) slows down (Velocity decreases).
Recently, we've seen the car (Velocity) speeding up, even though the central bank has been reducing money (QT) and increasing interest rates.
In the late 1970s (1978-79), a similar thing happened. The car's speed (Velocity) became more important than the amount of money (Money Supply) in driving up prices (inflation).
"Redux" means a repeat of something. So, the statement suggests that if we see a repeat of the 1978-79 situation, it would be surprising and could lead to higher inflation.
In simple terms, it's like saying that even though the central bank is trying to slow down the economy by reducing money and raising interest rates, we're still seeing fast economic growth. This reminds us of a situation in the late 1970s when fast economic growth led to higher prices. If this happens again, it would be surprising and could cause inflation.
2.The second thing Burry believes is that there is a bubble in the housing market, similar to the one in 2008.
Instructions chat above
green (rising market)
yellow (small drop market)
Red (absolute bear market)
He believes that housing prices are over inflated and that many homeowners are still carrying significant levels of debt he is warned that a housing market downturn could trigger a wave of default that would Ripple through the banking system and The Wider economy finally bury has expressed concern about the vulnerability of the banking system which he believes is over leveraged and under-capitalized he has warned that a wave of bank failures could trigger a major crisis similar to the 2008 financial crisis overall buries prediction that another major financial crisis is on the horizon.
Explanation for chart above
As you can see from the chart , we are not yet showing strong signs of a collapse like in 2008. However, there is a chain of signs that it is beginning to slow down and approach a potential downturn.
When a higher time frame displays characteristics in yellow between red, there is a chance of an impending collapse.
For now, we must treat this information as neutral and avoid letting our biases guide us.
3.The Third thing is Burry concern about the current state of the stock market.
Instructions chat above
green (rising market)
yellow (small drop market)
Red (absolute bear market)
Bury has expressed concern about the current state of the stock market, the housing market, and the banking system, all of which he believes are overvalued and vulnerable to a major downturn. Burry has also expressed concern about the high levels of debt in the U.S. economy, which he believes are unsustainable and could trigger a major crisis. He has pointed to the rising levels of corporate and government debt, as well as the growing number of (companies that can only service their debt but not pay it down), as evidence of this. Burry has also expressed concern about the current state of the stock market, which he believes is again overvalued and driven by speculation rather than fundamentals.
Explanation for chart above
As you can see in the chart, the market has not yet fully recovered despite the recent increases in the S&P 500 and NASDAQ. It's evident that the rally is weak compared to previous years. This analysis indicates a temporary market weakening, with no strong signs of a full recovery at the moment
Let's now take a deeper dive into less visible yet crucial information. We'll focus on areas that require understanding their unusual aspects and the reasons behind them. What do I mean?
To uncover something unusual, patience and extensive economic research are required. Through this process, we can discover intriguing insights that provide valuable context to the economic situation in the USA.
For example, let's examine:
a. M2 - MONEY SUPPLY
In the graph, you'll notice something that hasn't occurred since 1963. With the help of a tool, we can observe periods of increase (green) and slight decrease (yellow), but no instances of absolute decrease (red).
What does this signify?
What's the context behind it? After conducting research, I found an explanation. I'm referring to:
Financial Stress and Banking Issues: A sharp decline in M2 may indicate underlying financial stress or problems within the banking and financial sector. This is a significant reason as it highlights potential vulnerabilities in the financial system, which could have broader implications for the economy. It might prompt regulators and policymakers to address these issues to prevent a more severe crisis.
Do you still find this unremarkable? Remember, this is just one perspective on the situation.
b. Unemployment Rate
It is crucial to examine the Unemployment Rate, and I've specifically focused on the Unemployment Rate in California. This is because, in the end, the fundamental Unemployment Rate tends to converge to a similar outcome.
Currently, in the graph, we observe the color white, which indicates the start of an uptick in unemployment, representing slow growth.
White denotes a slow growth momentum or a potentially deceptive rally.
Therefore, it's important to note that we have not yet reached the green phase, which signifies a definite increase in the Unemployment Rate. Historically, every time the Unemployment Rate has turned green, it has been followed by an economic downturn.
it is essential to remain vigilant. If the Unemployment Rate continues to rise steadily, it may lead to economic stress. On the other hand, if M2 money supply is shrinking or experiencing volatility while the Unemployment Rate is increasing, it points to economic stress and potential issues. A declining money supply reflects reduced liquidity, making it harder for businesses to access capital for growth and causing financial stress. Simultaneously, a rising Unemployment Rate indicates that more people are struggling to secure jobs, further straining the economy. This situation can result in reduced consumer spending, decreased investment, and heightened economic uncertainty, potentially contributing to a market downturn or recession.
c. Gold Investors
Currently, there's something intriguing happening among certain investors worldwide. Over the past few months, some investors have been stockpiling gold.
Since March 2023, gold has displayed a (green) signal, indicating a bullish trend. This suggests that people have been accumulating gold from March until now, similar to the trend seen in 2003.
It's possible that some investors perceive the market as risky and view gold as a safety net. However, it's important to note that there can be instances of deception, as seen in 2016 and 2017 when gold turned green but didn't perform significantly and even dropped by 10 percent on three occasions.
Such situations occur periodically and not consistently. For instance, investors also purchased gold from 2019 until the end of 2021 (despite the significant impact of COVID-19 starting in 2020), indicating that some investors can spot signs ahead of time.
There are more examples from the past. Hence, it's fascinating to closely monitor recent developments in the gold market to see if it can break records or experiences setbacks like in 2016-2017.
There are many more examples, but I will stop here. The purpose of this post is to emphasize that thinking outside the box is often more fruitful. Instead of sticking to a linear approach, gather as much information as possible, seek connections between two factors, then three, and continue to cross-reference vast datasets.
By effectively cross-referencing, we enhance our ability to assess probabilities and reduce uncertainty. This reflects my personal viewpoint.
I observe that the market has reached a plateau in the SP500, NASDAQ, and most markets. There is a possibility that this is a temporary phase, or it may indicate an impending decline. My focus is on monitoring real-time data and responding accordingly, rather than attempting to predict the future.
Whenever I perceive the market as (red), I take action. Likewise, when I see it as (green), I take action. Ultimately, my goal is to remain adaptable and respond to prevailing market conditions.
In the future, I will continue to provide updates in the event of shifts in market conditions, inflation, new data, and additional information. This will contribute to assembling a comprehensive puzzle that offers clarity on the overall situation.

S&P 500 Daily Chart Analysis For Week of Oct 27, 2023Technical Analysis and Outlook:
In this week's price action, the index bounced back to our expected target Mean Resistance of 4255 but quickly fell to retest our previously completed Inner Index Dip at 4212. It then hit the strategic point of the next Inner Index Dip at 4150 and is currently resting at a Mean Support of 4113. On the downside, the index will likely go further down toward the Inner Index Dip at 4055, followed by Next #1 at 3961 and Next #2 at 3850. All this is just for starters. However, there is a possibility of it bouncing back to Mean Resistance 4156.

EUR/USD Daily Chart Analysis For Week of Oct 27, 2023Technical Analysis and Outlook:
As projected, the Eurodollar completed our Inner Currency Rally of 1.070 and retracted to the designated price target Mean Sup 1.053. The intermediate price action suggests the continuation of the Reignited Pivotal Down Move to retest Key Sup 1.047 and completed Outer Currency Dip 1.045 with an extension on the horizon of Next Outer Currency Dip 1.035. Rebound to Mean Res 1.060 is a possibility.

Bitcoin(BTC/USD) Daily Chart Analysis For Week of Oct 27, 2023Technical Analysis and Outlook:
The Bitcoin smashed our projections: Inner Coin Rally 30900, Outer Coin Rally 31700, and 34000, resting at completed Inner Coin Rally 35000. The next target is the Next #1 Inner Coin Rally 36300 Next #2 37800, with a near-term final projection of Outer Coin Rally 39200. Be aware that there may be some intermediate pullbacks along the way with the main target 39200. Nevertheless, the market may fall to the Mean Support 32600 before resuming its upside movement.

Xau Gold Long term analysis#XAUUSD analysis
Weekly Time Frame , it looks recession may hit hard ...
In Daily TF, The Price has Started a new up trend which is a pull back a previous Downtrnd leg. we may see a drop to 1681~1665$ :then Finishing 2nd Leg and run up
The potential Supply zone to reject the Price are 2 zones:
1) ~1873
2) ~1970
I can See that #GOLD may Reach 1450 Area if the Recession Hit ...
Stay sharp ...
#xausd #recession #Dollar

Again macro conditions don't foretell a crash soonIn May and August I made posts saying "Macro conditions don't foretell a market crash soon." Time has passed and it's all pretty much the same.
BUT!! Current world events might change everything. And see my other posts re likely imminent drops in the market. This post is just about macro.
Once again, some points here looking back to 2001. (2020 was an irregular event). Sorry for all the colors here, but everything is connected.
1. The Fed Rate (FEDFUNDS dark purple) falls before unemployment rises and recession. Note that the market rose while the interest rate was at its peak in 2006-2007 and 2019. So a further interest rate rise in November shouldn't be a worry, not that it seems likely today looking at the CME Fedwatch Tool www.cmegroup.com
2. There are still more job openings than people to fill them (JTSJOL Non-Farm Job Openings minus USCJC US Continuing Jobless Claims - dark blue). Still unchanged since May.
3. Unemployment Rate (UNRATE dark gray) rises before SPX (yellow) drops. Currently UNRATE is up to 3.8% and unchanged August-September. Relatively static and close to multi-year lows.
4. Note that since May:
* Initial Jobless Claims (USIJC light blue at the bottom) have dropped
* Continuing Jobless Claims (USCJC light gray) are unchanged
* Non-farm Payrolls (USNFP green) are unchanged
* Job openings (JTSJOL light purple) fell slightly and rose back to the May level. At over 9m there are more available jobs that any time pre-COVID.
* The number of Employed Persons (USEMP light pink) is rising continuously and is now at 161.5m - almost 3m more that pre-COVID. There's your economic growth.
5. After a year in decline, M2 Money Supply rose during the summer but might now be falling - a negative indicator?
6. The SPX drop last year was a result of inflation -> rate rises -> fear. But the recession didn't happen and the economy still looks strong
Conclusion is that macro conditions still don't foretell a market crash in the immediate future.
NOT TRADING ADVICE. DO YOUR OWN RESEARCH.

S&P 500 Daily Chart Analysis For Week of Oct 20, 2023Technical Analysis and Outlook:
The Spooz index held staunchly by our completed rebound projection and Mean Res 4378 by tumbling down to Mean Sup 4224, eyeing a retest Inner Index Dip 4212 with an intermediate rebound target to Mean Res 4255. The index could extend to the next Inner Index Dip 4150 for the next week's trading.

Bitcoin(BTC/USD) Daily Chart Analysis For Week of Oct 20, 2023Technical Analysis and Outlook:
This week, Bitcoin saw a surge in price, reaching Inner Coin Rally 29300 and Mean Res 29700. The next target is the Inner Coin Rally 30900 and a retest of the completed Outer Coin Rally 31700. However, it is essential to note that there may be some intermediate pullbacks along the way with the main target Mean Sup 29000.

USDPLN Breakthrough: Rally Ahead or Resistance at Play?The rising USD against PLN has finally broken through its descending trendline. This strength in the dollar can be attributed to rising bond yields (amid an unmoved Federal Reserve) and the prevailing economic challenges in Poland and the European Union (recessions).
On a technical note: The USDPLN pair has successfully broken out of a descending trendline on the daily timeframe that was evident since October 2022. Post breakout, a retest of this trendline occurred and the pair has since persisted in its upward journey. When zooming in to the 4-hour chart, the upward trend remains unblemished. However, a key observation here is our current position relative to the 'overbalance' level, which stems from February's bullish correction phase. Should the USDPLN manage to breach this overbalance threshold, we could be looking at potential resistance in the 4.27 - 4.33 region. This zone not only houses the 200-day moving average but also coincides with January's previous low and the 38.2% Fibonacci retracement level.
#USDPLNAnalysis #ForexTrends #BondYieldImpact #TechnicalBreakout #FiboWatch #CurrencyTrading #EuropeanEconomyInsights

S&P 500 Daily Chart Analysis For Week of Oct 13, 2023Technical Analysis and Outlook:
The Spooz index price exceeded our previous Mean Resistance point of 4336 and closed at the location of a notable event. The recent downward trend suggests that the Mean Support level of 4294 may be reached, with a possibility of extending to the Mean Support of 4228 or even the next Inner Index Dip at 4150. If the index finds support at 4294, it may move up to the newly established Mean Resistance at 4378.

EUR/USD Daily Chart Analysis For Week of Oct 13, 2023Technical Analysis and Outlook:
As our analysis of the EUR/USD daily chart for the week of October 6 indicated, the Eurodollar hit our mean resistance level of 1.062 a few times and is drifting lower toward the mean support level of 1.047. The price may rebound strongly from this zone of upcoming week price action.

Bitcoin(BTC/USD) Daily Chart Analysis For Week of Oct 13, 2023Technical Analysis and Outlook:
This week, the coin remained within the Mean Resistance of 28000 and drifted down to a Mean Support of 26900. It is heading toward testing the next level of Mean Support, 26200, and could extend to the additional Mean Support level of 25100. However, in the meantime, the upside rebound to Mean Res 27400 is highly probable.

DXY Bearish while Bitcion BullishHello Crypto Traders!!
Lets take a look at these two charts side by side. You'll notice that when the DXY decides to PUMP, Bitcoin decides to DUMP and when the DXY decides to DUMP, Bitcoin decides to PUMP.
A massive long term strong bullish trend has finally been broken for the DXY and if it cannot find its way above the trendline, it will continue to DUMP which should make Bitcoin PUMP.
This is a great area to long BITCOIN using the right risk management.
Calculate Your Risk/Reward so you don't lose more than 1% of your account per trade.
Every day the charts provide new information. You have to adjust or get REKT.
Love it or hate it, hit that thumbs up and share your thoughts below!
This is not financial advice. This is for educational purposes only.

🟩 Margin Debt with brokers points upWhen we look at the first chart the Margin Debt with brokers (aka how much the brokers are deploying margin) - we see a positive relationship with the times when brokers are on margin (aka buying a lot) and the market going up.
When we analyse the Rate of Change of this stat for the last 15months we can see that currently we are getting to a state of bearishness close to the 2008 and 2002 periods. This of course is a contrarian indicator and could point to a move higher.
This is a long term assessment, but it is a good point to include in your analysis.
However remember we NEVER have confirmed of the NET NEW HIGHS - hence this market has still not confirmed Bull Status, at best we have Bull-transition. So be very cautious of the market.

S&P 500 Daily Chart Analysis For Week of Oct 6, 2023Technical Analysis and Outlook:
The index's downward trend this week kicked on the seat of the pants of our projected target, Inner Index Dip 4212, repeatedly. Mean Res 4340 and even extend to Mean Res 4400 on the radar for the upcoming week's trading action; however, reignited Pivotal Down Move from Mean Res 4400 could weed out weak trading trawlers.

EUR/USD Daily Chart Analysis For Week of Oct 6, 2023Technical Analysis and Outlook:
The Eurodollar has tested the Outer Currency Dip of 1.050 multiple times. It has risen during this week's trading session, as our EUR/USD Daily Chart Analysis for the Week of September 29 indicated: For the upcoming week, the up target is Mean Res 1.062, and on the downside the Mean Sup 1.050 and completed Outer Currency Dip of 1.050.

SPX - Bear trend is still locked in!!!Stochastic's unlike nearly all indicator's
have the ability to flip from overbought/oversold to locked in to a continuation of TREND
#SP500 is still locked in a bear trend
after 3 days with both K&D lines above 80
or below 20
S and P 500 is locked into a bear trend still
which means all rallies should be faded until that locked in status is lost

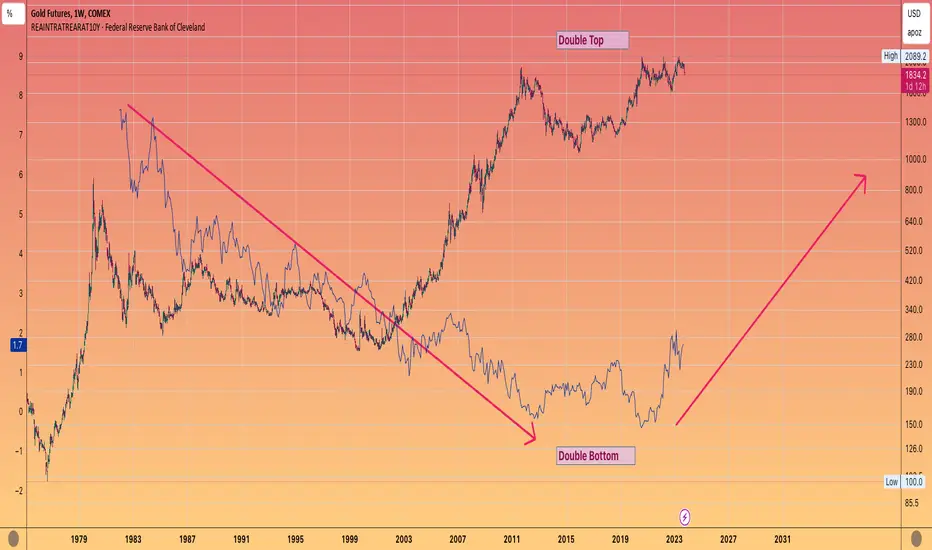
GOLD - Positive real rates is negative for GoldThe attractiveness of Gold is tarnished
When cash instruments yield a positive rate of return
More and more people are getting on board of higher interest rates
(Dimon, Santelli)
But u can see the Gold price has been inversely correlating with the rate of return for decades.
It's bull run in the 2000's along with the commodity bull , coincided with real rates trending to less than zero. Gold Topped a few months prior to that negative reading in 2012!
The current triple top that has been in place for he past 3 years , seems to be in danger of breaking down if rates continue up the next few years.
The key level to watch is last year's lows in October around $1611
Which I believe is a distinct reality if rates head up to 7%