Shanghai Stock Market (SSE Composite Index): A Closer LookThe Shanghai Stock Market is like a financial puzzle, and right now, it's showing us some interesting moves.
First, the rise in the 10-year yield from 3-year lows suggests that there might be changing expectations about economic growth, inflation, or monetary policy. This could be due to a variety of factors such as improved economic prospects, inflation concerns, or changes in the global interest rate environment. The central bank also did something important by closing a 5-billion yuan money deal. It's like they're keeping a watchful eye on how money is moving around. On top of that, they pumped a massive 385 billion yuan into the system, which can make things more exciting.
Now, let's talk about Ichimoku Cloud analysis. It's like a weather forecast for the stock market. Right now, it's showing that the market might be heading up, which is a positive sign. However, the cloud isn't very thick. This means we should be a bit cautious.
There's another important sign on this chart. Tenkan points up, suggesting the market might go up soon, even though it's under Kijun resistance line. It's a bit like seeing a green light at an intersection, even if the other light is still red.
So, as we decode these numbers and signals, it's clear that the Shanghai Stock Market is in a state of flux, with various factors at play. Investors will need to stay vigilant, considering both the data and the bigger economic picture to make informed decisions in the coming year.
Economy

S&P 500 Daily Chart Analysis For Week of August 25, 2023Technical Analysis and Outlook:
The Spooz rock and roll to the upside in this week's price action, hitting our Mean Res 4460 as advertised in Daily Chart Analysis For the Week of August 18 with rinse and repeat, is not out of the question. On the downside, price action continues targeting our completed Inner Index Dip 4340 for a retest and drift further down to the next Inner Index Dip 4212.

EUR/USD Daily Chart Analysis For Week of August 25, 2023Technical Analysis and Outlook:
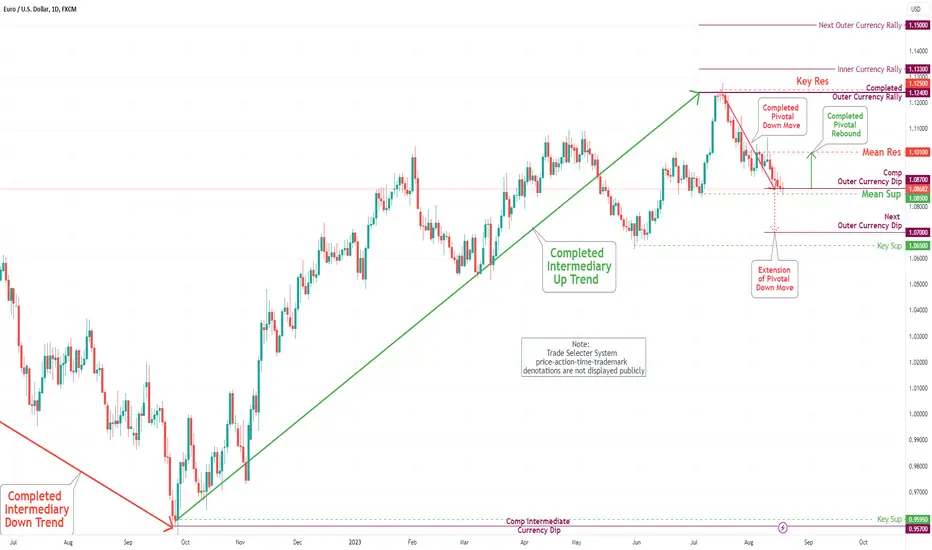
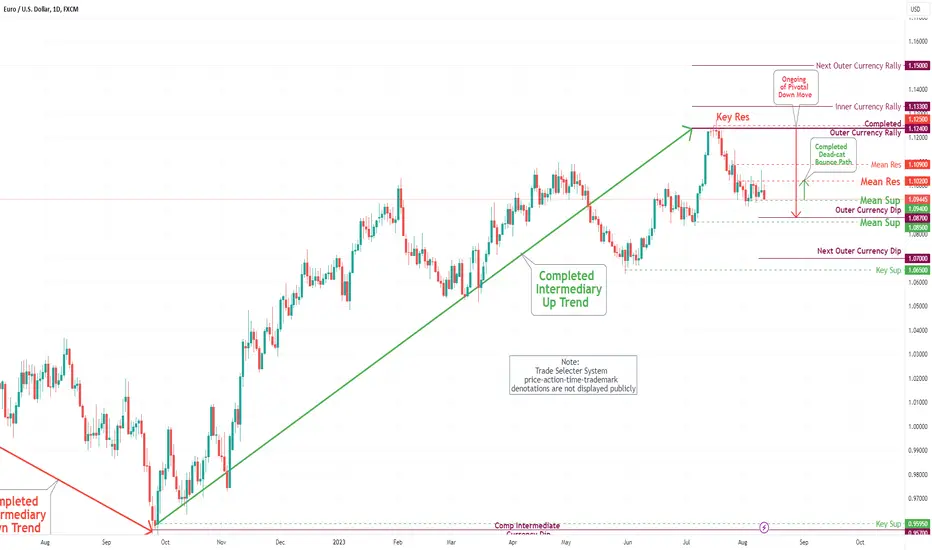
This week's price action of the Eurodollar turned out to be nothing but down modish as projected, by fulfilling our Outer Currency Dip of 1.087 and drifting to the next Outer Currency Dip of 1.070. However, the dead-cat rebound to Mean Res 1.090 should not be ignored.

Bitcoin(BTC/USD) Daily Chart Analysis For Week of August 25,2023Technical Analysis and Outlook:
This week, Bitcoin surpassed two key targets: Outer Coin Dip 28200 and 26900, indicating that the next Outer Coin Dip 24200 is likely, with the Mean Res 26650 serving as a temporary support for price action. However, an extension to Mean Res 27800 should not be dismissed.

$DJI reached 1k+ point drop & 1st target levelGood Morning!
TVC:DJI reached the level that we called for, the 1k point drop we spoke about.
Now what?
Coincidentally, the index is slight oversold.
#FED can only fight #inflation, it cannot nor will it tame it.
If it insists it will hurt #economy. But, they've been saying they know this!
Since they began to raise we made it clear, they're going to break something, but what?

V shape bounce QQQ NasdaqAs per chart, we have finally moving back up from the first half of bear of August.
Market got its liquidity and moving up now. Great time to buy. Indicator for Rate of Change is also turning up (Top indicator chart

XAU/USD -Facing Local Resistance- Gold is facing a local resistance trendline which previously was acting
as Support trendline within the pattern.
Last 3D candlestick print managed to put a higher high in terms of market structure (BoS).
Entry from here is quite risky, however, spot SL is just about 1% from current price.
Last 3D Candlesticks looks like a Bullish Hammer being printed, yet weak in terms
of price action having experienced rejection from resistance trendline .
Wave 5 anticipation for Gold, headed to NATH, but first, price needs to pick it self back up
and penetrate through the broken trendline in order to continue higher.
Quite some critical moves ahead for Gold's Direction
TRADE SAFE
*** Note that this is not Financial Advice !
Please do your own research and consult your own Financial Advisor before
partaking on nay trading activity based solely on this Idea.

S&P 500 Daily Chart Analysis For Week of August 18, 2023Technical Analysis and Outlook:
This week, the Spooz index finalized its down move by completing the Inner Index Dip 0f 4340. However, a strong rebound is possible with Mean Res 4460 as a primary target. On the downside, price action might churn about the completed Inner Index Dip 4340 and Mean Sup 4330 before taking off to the upside. Notwithstanding, if all fails, the market will take us to the Next designated target of Inner Index Dip 4212.

EUR/USD Daily Chart Analysis For Week of August 18, 2023Technical Analysis and Outlook:
The price action of the Eurodollar remained downwards as projected by Trade Selecter by completing our major target Outer Currency Dip 1.087. However, a strong rebound is possible with Mean Res 1.101 as a target. On the downside, price action might take us to the Next Outer Currency Dip of 1.070.
Bitcoin(BTC/USD) Daily Chart Analysis For Week of August 18,2023Technical Analysis and Outlook:
As per Trade Selecter projection, Bitcoin's prices have plummeted, destroying Outer Coin Dip 28900, 28200, and 26900, respectively, and completing Outer Coin Dip 25600. The downward trend continues with Mean Sup 25100 and Next Outer Coin Dip 24200, but a strong rebound is possible with Mean Res 27800 as a target.

Short Dollar Index at Strong Resistance
The US dollar index, technical analysis compared against the seven other major FX currencies(AUD, CAD, JPY, CHF, GBP, EUR, and NZD), is at a strong resistance level, with RSI momentum levels close to being overbought.
Fundamentally and based on the analysis of various economic indicators, the US dollar appears to be leaning towards an inflationary bias, but some conflicting signals suggest potential deflationary pressures. Key points include:
Leading Indicators: PMI and Services PMI indicate a growing economy, potentially leading to inflation. However, momentum is slowing down, which could temper the inflationary outlook.
Money Indicators: M2 is historically low and bouncing higher, coupled with the decreasing interest rates (IRs) and real interest rates (Real IRs) velocity, indicating a possible shift towards looser monetary policy and an inflationary bias.
Inflation Measures: While CPI inflation is now close to average levels, the Core CPI is heading toward normality and decreasing, suggesting some downward pressure on inflation. PPI (Producers Inflation) has shown signs of bouncing higher, indicating potential inflationary tendencies.
Employment: Employment trends point to medium to low inflation expectations, as employment change is within YoY% average levels.
Considering these factors, the ultimate currency bias leans slightly towards an inflationary outlook for the US dollar. However, the mixed nature of the signals suggests a need for continued monitoring of economic indicators and policies to accurately assess the currency's direction.

📈MY TAKE ON THE FED, INFLATION AND CREDIT📊
TLDR: I think the price increase we are seeing is not inflation, the economy is going from bad to worse and the FED's actions don't make any sense.
At the peak of the great inflation of the 70s in USA while both long and short term interest rates were going up together with inflation, so was the aggregate credit.
In fact loans to businesses were growing faster than inflation.
Whereas now, while the short term rates are going up the aggregate credit is going down. Businesses aren’t borrowing and the banks aren’t lending.
And as it was established by Milton Friedman, inflation is exclusively a MONETARY phenomenon.
Therefore price increase followed by unchanged or decreased aggregate credit in not inflation. Which is exactly what we are seeing right now.
It might be attributed to the ongoing effects of the Covid era supply shock which created long lasting bottlenecks, the war in Ukraine or some other fundamental systemic economic problem but it’s not conventional inflation which means that raising interest rates will do nothing but further damage the already weak economy (which is reflected in the unprecedented drop in demand for credit)
So, the further rate hikes that were hinted yesterday by the FED don’t make any sense and we should be expecting a fast race to the zero with more QE when the economic sh*t hits the political fan.
But, let’s wait and see.

MACRO MONDAY 7 - CHINA DEFLATIONMacro Monday (7) - Advance Release
China Inflation Rate – $CNIRRY
China entered into deflationary territory in July 2023 and this is being shared by many with an extremely negative outlook for markets. I believe this chart outlines a very different perspective that leans more neutral than cautionary whilst also providing a more usable framework in the event of a recession scenario playing out.
🔴The last 3 global recessions commenced during China's peak inflationary periods, not during deflationary periods. This is the first clear indication from the chart (red circles).
🔵The last 3 periods of deflation in China signaled the forming of a market bottom in 2000 (over 14 months), thee market bottom in 2008 and resulted in positive S&P500 price action in 2020 (blue areas).
Two out of three times China Deflation has been immediately positive for markets.
⚠️The most contentious period of deflation can be assigned to the 2000 Dot Com crash. The commencement of this 14 month period of deflation from October 2001 did not immediately mark the bottom. Instead the S&P500 made a further c.35% decline to gradually form its bottom over those 14 months ending in December 2002. If this was to repeat we could be looking at Sept 2024 as a possible market bottom and a 35% decline would be $2.9k for the S&P....👀
This scenario is worthy of consideration especially factoring in the comparisons of the 2023 AI boom to the 2000 internet boom. As we enter a new technological epoch with the likes of Augmented Reality, Cryptocurrencies and AI, are we getting ahead of ourselves again? Do these technologies need a little more time to mature much like the internet? Are we overextended like we were in 2000? Its hard to answer no to any of these questions but against the backdrop of record levels of QE and Fiscal Deficit we have to keep an open mind as we froth in record levels of liquidity.
What is useful about this chart is that if a 2000 Dot Com crash scenario was to play out from hereon, we could use China’s move back into inflationary territory (above 0% line) as a possible confirmation of a market bottom/reversal as was the case in Dec 2002.
What day is it? 🤣🤣🤣 I released this early brief Macro Monday as I seen this topic repeatedly in my feed today and wanted to share the perspective as soon as possible. There is a strong possibility of a 2nd alternative Macro Monday Chart on Monday 14th. Hope to see you there!
As always I hope the chart offers perspective and utility
PUKA

S&P 500 Daily Chart Analysis For Week of August 11, 2023Technical Analysis and Outlook:
The Spooz index continued this week to drop to fulfill its destination of Mean Sup 4403 and the possibility of Mean Sup 4330. However, another jump toward the newly created Mean Res 4520 level is also possible in this unconventional market.

EUR/USD Daily Chart Analysis For Week of August 11, 2023Technical Analysis and Outlook:
This week, the price action of the Eurodollar remained stagnant between the Mean Res 1.102 and Mean Sup 1.094. Thursday's reversal tips its hand to continue the pivotal down-move mode with the target, Outer Currency Dip 1.087. However, another jump toward the Mean Res 1.102 level is also possible in this rigged market.
Bitcoin(BTC/USD) Daily Chart Analysis For Week of August 11,2023Technical Analysis and Outlook:
To its price action, Bitcoin experienced a "dead cat bounce," as projected by Trade Selector. Its current trajectory points to resuming the retest of the completed Outer Coin Dip 28900 and moving towards the next Outer Coin Dip 28200 and 26900, respectively. However, another jump toward the Mean Res 30050 level is also possible in this reactionary market.

$CNIRYY - Deflationary CPI- While ECONOMICS:USIRYY numbers remain inflationary,
having the latest increase to 3.2% on August 10th,
on the other side of the World from the second Global Superpower,
ECONOMICS:CNIRYY came Deflationary at negative 0.3% on 9'th of August,
just a day prior to numbers of ECONOMICS:USIRYY .
Note that The Head of Federal Reserve,
our pal Jerome Powell,
stated that Feds do not see Inflation ECONOMICS:USIRYY coming down to their norm target of 2% CPI
by 2025.
Jerome still believes on a 'Soft Landing'..
How about another Joke, Powell !?

U.S. Economy Less Interest Rate SensitiveDespite the fastest rise in interest rates since 1981, and an inverted yield curve where short-term rates are much higher than long-term bond yields, the United States has not (at least yet) experienced the recession forecast by the vast majority of market pundits and economists. Why not?
The relatively few contrarians that did not forecast a recession, including myself, had many reasons for a more optimistic view. However, the most critical reason appears to have been an appreciation of how the U.S. economy has changed over decades and become much less sensitive to interest rates.
In the 1950s, 1960s and 1970s, the U.S. economy was driven by housing and manufacturing. The only choice to finance a home was the 30-year fixed rate mortgage, provided by a savings and loan institution, that deliberately borrowed short-term from savers and lent long-term, taking considerable interest rate and yield curve risk. Further, there was no such thing as financial futures or interest rate swaps to allow for the efficient hedging of interest rate risk.
Fast forward to the modern economy of the 2020s. The U.S. is an economy driven by the service sector, and services are considerably less sensitive to interest rate swings than housing and automobiles. Home mortgages come in every size and flavor, from floating rates to fixed rates. Mortgages are originated by specialists and then packaged and sold to pensions, endowments and investors willing to take the risk. There are no savings and loan institutions. Financial futures, swaps and options are available for efficient hedging and management of interest rate risk.
In short, the U.S. economy does not dance to interest rates like it once did. Make no mistake, though; interest rate shifts have a profound impact on asset values, from equities to bonds, to housing. It is just that the impact on the real economy is much more subdued than it once was, and a rise in rates does not automatically mean a recession is around the corner.
If you have futures in your trading portfolio, you can check out on CME Group data plans available that suit your trading needs www.tradingview.com
By Bluford Putnam, Managing Director & Chief Economist, CME Group
*Various CME Group affiliates are regulated entities with corresponding obligations and rights pursuant to financial services regulations in a number of jurisdictions. Further details of CME Group's regulatory status and full disclaimer of liability in accordance with applicable law are available here: www.cmegroup.com
**All examples in this report are hypothetical interpretations of situations and are used for explanation purposes only. The views in this report reflect solely those of the author and not necessarily those of CME Group or its affiliated institutions. This report and the information herein should not be considered investment advice or the results of actual market experience.

ISM New Orders vs Consumer SentimentISM New Orders Vs Michigan Consumer Sentiment index
ISM New orders provide an indication of current consumer demand. Utilising a chart of New Orders readings we can attempt to understand the trend of consumer demand forward. ISM New Orders could be considered an additional gauge of consumer sentiment because if businesses are reporting increases in orders month over month, this demonstrates consumers have the consistently had the resources and the desire to spend. If this continues over months a trend can form and we can capture this direction on a chart. To support the ISM predictive argument I include a chart that illustrates a correlation between the ISM Manufacturing New Orders Index and the University of Michigan Consumer Sentiment Index, the latter of which is considered one of thee leading indicators for predicting future consumer spending/demand. This will be posted in the comments.
According to Investopedia "ISM data is considered to be a leading indicator of economic trends. Not only does the ISM Manufacturing Index report information on the prior two months, it outlines long-term trends that have been building over time based on prevailing economic conditions".
According to the University of Michigan, the Consumer Sentiment Surveys "have proven to be an accurate indicator of the future course of the national economy."
Based on the above correlation I postulate that we can use the ISM New Orders Index as an additional leading/predictive indicator to establish what direction consumer demand is trending. Something we can keep an eye on and something that will factor in this weeks MACRO MONDAY Edition which i will post immediately after this
PUKA

S&P 500 Daily Chart Analysis For Week of August 4, 2023Technical Analysis and Outlook:
The Spooz index experienced a significant drop as a result of the Inner Index Rally 4590 reaching completion last and this week's trading session, respectively. This caused our Mean Sup 4534 and 4507 to be eliminated. It seems likely that the index will continue to decline, potentially reaching our next Mean Sup 4403 and even Mean Sup 4330. However, it's important to note that there could be a Reignited Rally Resumption at the solid and strategic Mean Sup 4403 level, as this week's trading has been heavily oversold.

EUR/USD Daily Chart Analysis For Week of August 4, 2023Technical Analysis and Outlook:
In this week's session, the Eurodollar has decreased to our Outer Currency Dip of 1.087. This has resulted in a very weak Mean Res of 1.102. However, Friday's reversal could indicate a potential extension of the dead cat bounce to Mean Res 1.109, while the Mean Sup of 1.094 is lingering below.

Bitcoin(BTC/USD) Daily Chart Analysis For Week of August 4, 2023Technical Analysis and Outlook:
This week, the price action of the coin remained stagnant between the Outer Coin Dip 28900 and Mean Res 30050 levels. This suggests it might decrease further towards the Outer Coin Dip levels of 28200 and 26900. However, there is also a possibility of a dead-cat rebound towards the Mean Res 30050 level.

RELATIVE HOUSE PRICE INDEXMeasures how expensive or cheap housing is relative to wages.
-Base 100 in 1975
-Volatility clean
-In USD
