Fundamental and Technical Analysis | FebuaryTable of Content:
1. Eurozone Inflation Data
2. US Economics Growth
3. NVDA
4. Commodities
5. Technical Analysis
1. Eurozone Inflation Data
The Eurozone's inflation for the month of January has exceeded the previously estimated figures, as reported by MarketWatch on February 23. It has been emphasized by policymakers that the economy is undergoing a disinflation process, and a soft landing has been achieved. However, the recent surge in inflation within the European Union implies a substantial escalation in interest rates.
2. US Economic Growth
The US economy experienced a less robust economic expansion than previously estimated in the fourth quarter, as evidenced by a downward revision in consumer spending. This adjustment has resulted in weaker economic growth (Bloomberg).
The total amount of outstanding credit card debt in the United States has reached $986 billion, with an average interest rate of 20%. This marks the highest level of credit card debt since the 1980s and translates into an interest payment of $200 billion per year. These figures do not include other forms of debt such as mortgages, student loans, and car loans, which are likely to exacerbate the situation. At the same time, the US government is paying over $200 billion in interest payments
The Personal Consumption Expenditures Price Index has risen from 5.3% to 5.4%, however, this data alone is insufficient to support the notion of disinflation. The Gross Domestic Product (GDP) has been revised downwards from 2.9% to 2.7% (a decrease of 0.2%) from the preceding quarter. According to Bloomberg, the US economy experienced a weaker expansion than originally projected.
Revised fourth-quarter inflation figures have been adjusted upward.
Additionally, JP Morgan's Jamie Dimon stated that "The Federal Reserve has lost a little bit of control of inflation". He has been warning about the economy for a while and I believe that he knows something is cracking as we speak.
3. NVDA
The stock price of $NVDA experienced double-digit growth. The stock price has risen by 100% since the beginning of the year. Revenues and profits have both decreased by 21% and 52% respectively on a year-over-year basis, and every segment of the business has exhibited a decline over the same period. The CEO placed significant emphasis on the importance of Artificial Intelligence, yet he sold stocks worth over $100 million prior to the market's significant downturn and may presently be engaged in additional sales.
4. Commodities
The statement suggests an anticipated appreciation in the value of the US dollar, which is reflected in the downward movements of gold, silver, platinum, copper, and various grains such as corn, rice, and soybean. Conversely, energy commodities are experiencing an upward trend, with natural gas exhibiting a significant increase.
5. Technical Analysis
The 21-day weighted ratio of equity-only put-to-call options is suggestive of a preponderance of puts in the market and indicates a significant degree of buying pressure. This metric has demonstrated a high degree of efficacy in identifying market highs and lows by suggesting a move in the opposite direction to the put/call ratio. Notably, during the present bear market, the ratio has achieved a 100% success rate. Furthermore, the current volume of call options is the highest on record, and retail investors are contributing $1.1 billion daily to the market.
-Momentum indicators: RSI and MACD moving downwards and volume remain below average (bearish)
As previously stated, " I will take the opportunity of a rise in equity markets to short BTC at higher levels". I have now filled all my short position on BTC in a confident manner. Below is my BTC outlook
Conclusion:
The recent market rally, spurred by technical indicators, high-quantity puts, and government emphasis on disinflation, has led to a surge in retail investment. As a result, prices for some assets have skyrocketed, and the quantity of long positions in the market has reached alarming levels. This suggests an overabundance of buying and a lack of liquidity that could cause the market to dip and potentially result in retail closures, as inflation has proven to be more persistent than anticipated by governments. I remain committed to my long-term investment plan, I am acknowledging the growing fissures in some economies that could lead to a catastrophic downturn. It is essential to remain vigilant and prepare for potential market turbulence in the future.
As previously mentioned, my portfolio consists of short-term bonds, USD, SPX shorts, BTC Shorts, small quantity gold, and just acquired Natural gas contracts.
For personal records but feel free to discuss or argue.
Economy
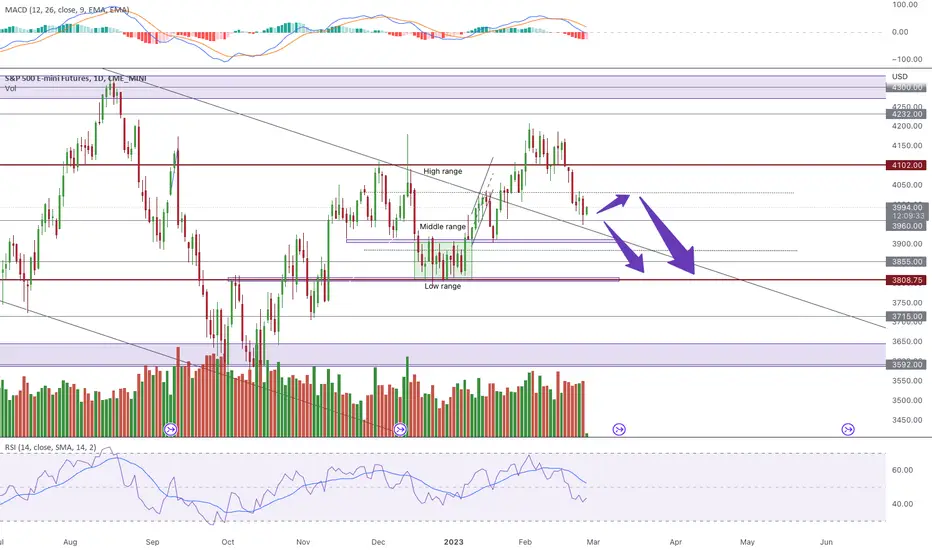
S&P 500 Daily Chart Analysis For Week of February 24, 2023Technical Analysis and Outlook
The index Mean Res 4145 was the culprit target with the recent Intermediary Up Trend as shown on S&P 500 Daily Chart Analysis For the Week of Feb 17; all three targets were hit - Mean Sup 4060, Mean Sup 4015, and the Inner Index Dip 3980. The newly created Mean Res 4028 is our intermediate upside target - Dead-cat bounce. Keep in mind that the current bearish market sentiment is intact. There is a significant possibility that the Mean Sup 3890 and retest could be undertaken of Key Sup 3785 and completed of the Inner Index Dip 3785 as well.

EUR/USD Daily Chart Analysis For Week of February 24, 2023Technical Analysis and Outlook:
The Eurodollar continued a downward spiral this week, as shown on EUR/USD Daily Chart Analysis For the Week of Feb 17. The price action hit our Mean Sup 1.066 for several days, indicating its bearish mode. The leading downside target designation is Mean Sup 1.052 and the Inner Currency Dip of 1.046. Once this puppy hits our targets, we will see a revival to the upside aiming for the main target of the Mean Res 1.060.

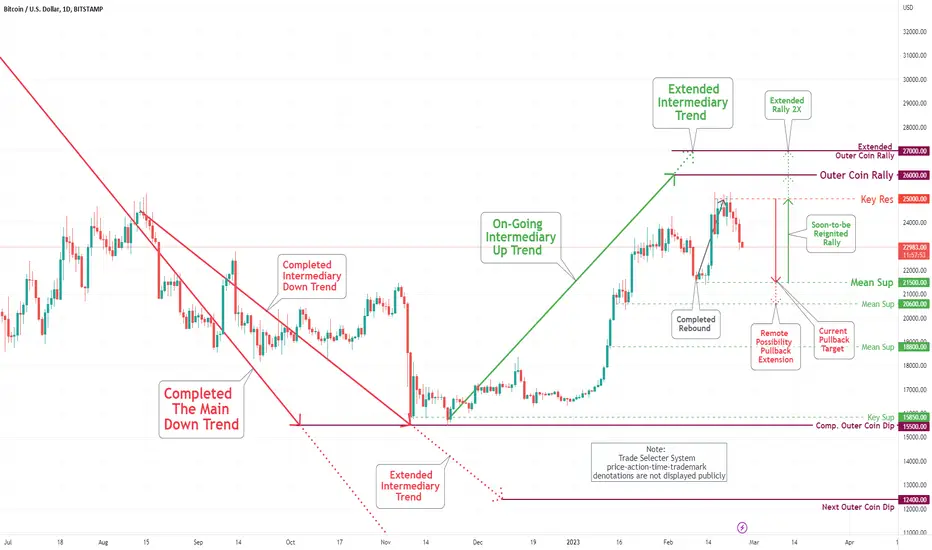
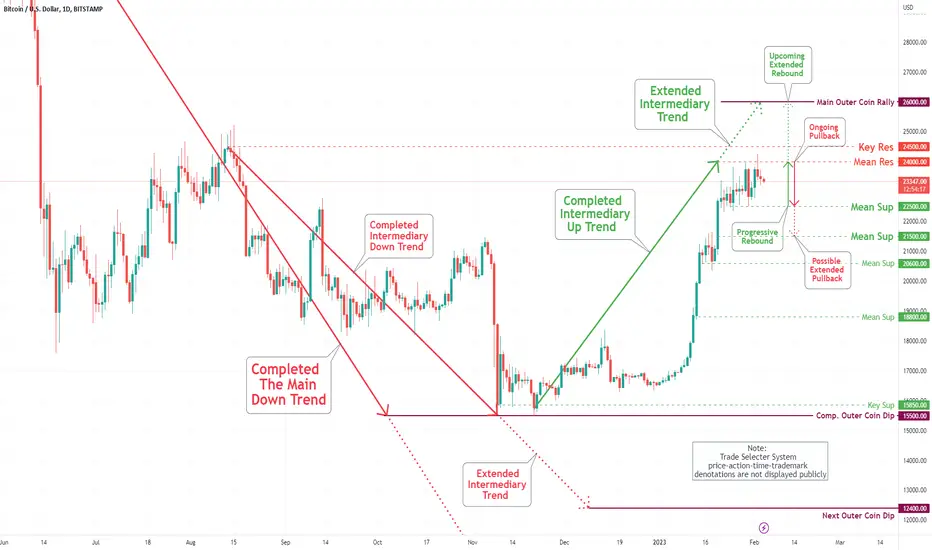
Bitcoin (BTC/USD) Daily Chart Analysis For Week of Feb 24, 2023Technical Analysis and Outlook:
After hitting our Key Res $24,500, as shown on the Bitcoin Daily Chart Analysis Update For the Week of Feb 17, the coin is retreating aggressively, striking our target of the Mean Sup $23,500 as marked and showing an earmark move to Mean Sup $21,500. Once this puppy settles down, we will see a resurgence to the upside - the initial target of Key Res $25,000 with a rally all the way to the Outer Coin Rally of $26,000 and the Extended Outer Coin Rally of $27,000 targets.
DXY - Will US Dollar history of 1981 repeat? 🔲DXY
Will the USD find support at this important monthly line🔲and history of 1981 repeat with a bullish run⁉️🚨
Personally I don't expect that due to the parabolic $-M1 Supply
But what are your thoughts on that dear #Bitcoin and Crypto Nation?
Let me know your thoughts in the comments🤗
⬇️⬇️⬇️
Likes and Follow for updates appreciated🤗
Disclaimer:
Not financial advice
Do your own research before investing
The content shared is for educational purposes only and is my personal opinion

Bitcoin - BTC and the DXY RSI 🟢Nice BTC behavior when the DXY left the overbought area on the weekly RSI
As long as the DXY follows the downwards channel a bullish Crypto run will likely occur🟢
Let me know your thoughts in the comments🤗
⬇️⬇️⬇️
Likes and Follow for updates appreciated🤗
Disclaimer:
Not financial advice
Do your own research before investing
The content shared is for educational purposes only and is my personal opinion

S&P 500 Daily Chart Analysis For Week of February 17, 2023Technical Analysis and Outlook
The index continues to respect our Mean Sup 4060 target as shown on S&P 500 Daily Chart Analysis For the Week of Feb 10. The newly created Mean Res 4145 is our intermediate upside target - However, keep in mind that the temporary bearish market sentiment is intact, and a significant possibility that the Mean Sup 4060 retest could be undertaken with an eye on the inner stepping stone of Mean Sup 4015 and completion of the Inner Index Dip 3980.

EUR/USD Daily Chart Analysis For Week of February 17, 2023Technical Analysis and Outlook:
The Eurodollar this week continued a downward retreat. The price action created new Mean Sup 1.066 as the intermediary beak point from the knockout punch. The leading upside target designation is Mean Res 1.075 - dead cat rebound. Once this puppy settles down, we will see a revival to the downside aiming for the main target of the Inner Currency Dip of 1.046.

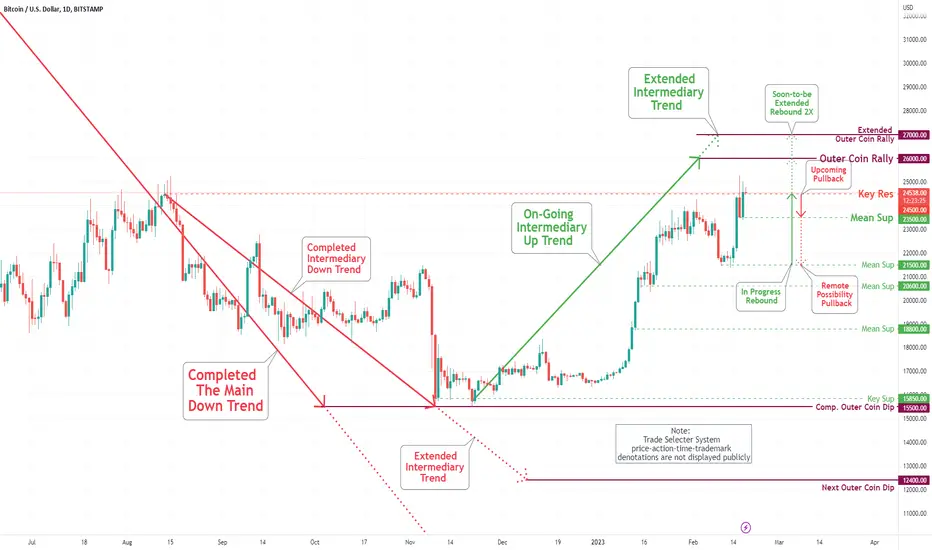
Bitcoin (BTC/USD) Daily Chart Analysis For Week of Feb 17, 2023Technical Analysis and Outlook:
The coin is resting comfortably at our Key Res $24,500, as shown on the Bitcoin Daily Chart Analysis Update For the Week of Feb 16. We expect a pullback to our Mean Sup $23,500 for this week's price action. Once this puppy settles down, we will see a resurgence to the upside - the initial target of Key Res $24,500 (Retest) with a rally all the way to the Outer Coin Rally of $26,000 and Soon-To-Be the Outer Coin Rally of $27,000 outcome.
P2P | DXY - 2.16.23Hello everyone! Thanks for being patient with the content, just finished building the studio setup so I can really dive into the markets and give in depth analysis.
In this clip I will be discussing my take on DXY for the next few weeks to Q2 and Q3.
As you can see the #dollar has made a significant pullback to an area of previous support, where its also trading under the most recent support.
There is no news from today/tonight until Feb 21st for #DXY, I believe it will be an opportunity for the #centralbanks (Whales) to collect orders and take out any retail or liquidity.
Following the accumulation into distribution phase, I'd say we could see a continuation of a #bearish dollar to hunt the biggest liquidity pool before continuing a #bullishtrend
I won't be trading live until April due to some strategy testing so I hope you guys and gals can appreciate the breakdowns of the dollar. Remember, this is for you to frame your own idea around the market and use what works for your analysis.
As always gang, happy trading, trade well, and lets run it up from 2023 til infinity!
You can help continue to grow the page by liking and following the channel, and if you get any value from this to boost it too!
DISCLAIMER
***This page is for educational purposes only and is not intended for any financial arise. I am not a financial advisor nor do I manage any other accounts for users. Any trades you take will be of your own doing and P2P will not be held responsible.***

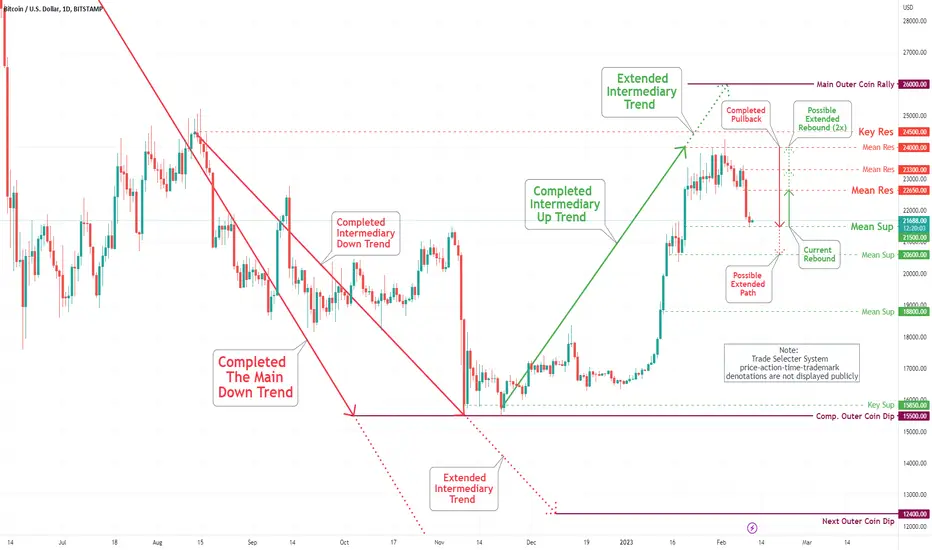
Bitcoin (BTC/USD) Daily Chart Analysis For Week of Feb 10, 2023Technical Analysis and Outlook:
Bitcoin hit our initial progressive pullback Mean Sup $22,500 and extended a retreat to Mean Sup $21,500 on Friday as shown on Bitcoin Daily Chart Analysis For the Week of Feb 3. Once this puppy flushed out weak-longs, resumption to the upside shows the initial target of Mean Res $22,650 with a possible rally all the way to the Mean Res $23,300 and $24,000 - this week.
End Of The Dollars Plummet?What you see here is a larger time frame analysis of the overall price action of DXY(dollar). Price has moved away from previous major resistance and is now showing bullish price action and is now showing resistance at a price area that previously caused a strong sell of (supply). Price will consolidate here before choosing a direction which I believe will be to the upside. Wait for break of yesterdays manipulated high for entry with stop below the red supply line.

S&P 500 Daily Chart Analysis For Week of February 10, 2023Technical Analysis and Outlook
Spooz hit our Mean Sup 4060 target as shown on S&P 500 Daily Chart Analysis For the Week of Feb 3. With the confirmation of the Key Res $4180 in place, the current dead cat rebound is expected to take us to Mean Res 4120 - However, keep in mind that the bullish market sentiment is intact, and a significant possibility that the Key Res $4180 retest could be launched with an eye on completion of the Outer Index Rally 4230. But if all fails, the index will take us down to two Mean Support targets: 4015 and 3970, for this week's trading scenario.

EUR/USD Daily Chart Analysis For Week of February 10, 2023Technical Analysis and Outlook:
The Eurodollar this week continued a downward spiral retreat to the crime scene of Mean Sup 1.078 and Mean Sup 1.070 from our newly created Mean Res 1.099 as shown on EUR/USD Daily Chart Analysis For the Week of Feb 3. The leading target designations are Mean Sup 1.052 and Inner Currency Dip 1.046 - dead cat rebound is expected.

USINTR - still in a upside trend ( wth 30yr backtesting)
*High winning rate with backtesting by my strategy
Right now ECONOMICS:USINTR is still in the upside trend.
This means that it has been consistently performing poorly and may not be a good investment opportunity in the short term.
🔔 Be prepared for reversals.
It's advisable to be patient and wait for the downward trend to occur before the risk market confirms a bullish market again.
Good luck!

Disney pops on earningsDisney had a nice rally. Its the rally we have been waiting for.
Finally hitting and fulfilling our upside target we are now accumulating a swing short on Disney.
The level was hit in the post market session and has pulled off the highs nicely.
We telegraphed this trade to our subscribers and were already in the money.

Is Gold telling us something?Gold is forming a picture perfect Bear Flag.
If this pattern breaks and triggers we have 2 downside targets.
The importance of analyzing this pattern is Gold encompasses much of the macro landscape in its price action.
If Gold is acting bearishly based off this pattern it could be foreshadowing a dollar strengthening.
It could also foreshadow perhaps a good jobloss claims number tomorrow that could force yields higher.
Whatever the catalyst may be, based off of this pattern were likely to see some additional weakness in the near term unless we break out of the bear flag upper range.

Bullish Near-Term OutlookBesides the macro-economic outlook I've described in other ideas, which really are the foundation of equity moves right now, SPY is showing both a cup-and-handle and broadening downward wedge, both of which are bullish indications from a technical perspective. It's palpable that sentiment has changed across social media, and it makes sense that a bear market wouldn't be "up=down=up=down" forever. I expect a slow melt up and a second drawdown when the fed pivots in reaction to lagging negative economic data later in 2023. Probably late, like usual.
As always, no one ever knows for sure and your investment strategy should reflect that uncertainty.
InTheMoney

Bitcoin - RVGI indicator❌cross just occurred🔵🚨👀The RVGI indicator❌cross just occurred🔵🚨🚨🚨👀
Look at the great entry points🟢for Bitcoin when these crosses❌occurred in the past on the US10Y-US02Y chart dear BTC and Crypto Nation💥🚀😎
Let me know your thoughts in the comments🤗
⬇️⬇️⬇️
Likes and Follow for updates appreciated🤗
Disclaimer:
Not financial advice
Do your own research before investing
The content shared is for educational purposes only and is my personal opinion

S&P 500 Daily Chart Analysis For Week of February 3, 2023Technical Analysis and Outlook
Spooz hit our target Outer Index Rally 4140 and beyond. The development of the Key Res $4180 is in progress. The bullish market sentiment is intact. The pullbacks with this ongoing rally are expected to target the newly created Mean Sup 4060, and possibly an extension to the crime scene Mean Sup 4015.

EUR/USD Daily Chart Analysis For Week of February 3, 2023Technical Analysis and Outlook:
The Eurodollar pivoted from completing our newly created Mean Res 1.099 and is returning to the crime scene of Mean Sup 1.078 with possible additional downward movement to Mean Sup 1.070 - dead cat rebound is expected.

Bitcoin (BTC/USD) Daily Chart Analysis For Week of Feb 3, 2023Technical Analysis and Outlook:
Bitcoin extended a progressive rebound to a new Mean Res $24,000 - with the expectation of a pullback to the Mean Sup $22,500 and, possibly, an extension to Mean Sup $21,500. Once this puppy flushes out weak-longs, resumption to retest the Mean Res $24,000 and the Key Res $24,500 is imminent with a rally all the way to the Outer Coin Rally of $26,000.
Meta...What a move!Massive Moves to the upside often see that move retraced over the coming weeks especially if market fundamentals deteriorate.
none the less this stock likely sees a significant amount of profit taking.
