S&P 500 Daily Chart Analysis For Week of May 2, 2025Technical Analysis and Outlook:
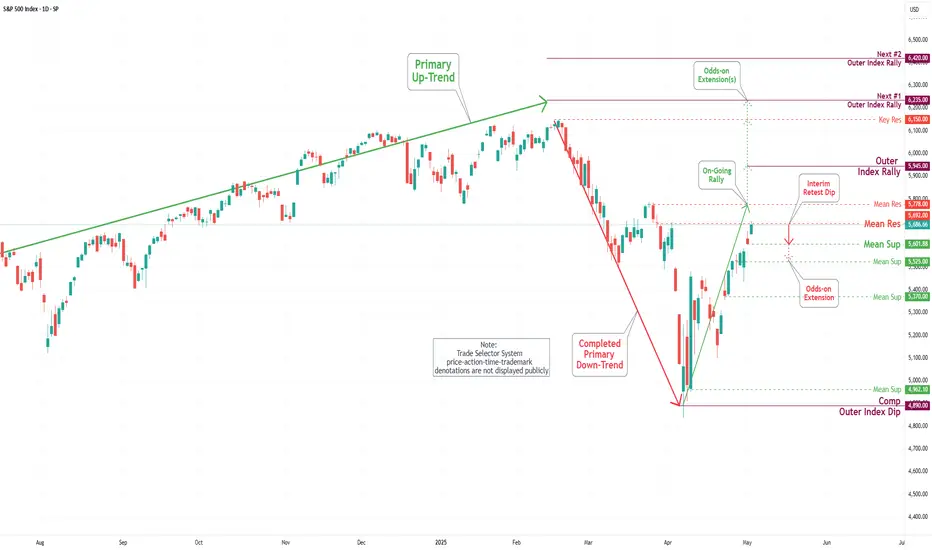
During this week's trading session, the Index demonstrated a steady to higher price movement, achieving a key target at the Outer Index Rally level of 5550 and successfully surpassing the Mean Resistance level of 5672. This trajectory establishes the foundation for sustained upward momentum as it approaches the Mean Resistance level of 5778 and sets sights on reaching the next Outer Index Rally target marked at 5945. However, it is essential to acknowledge the substantial risk of a sharp retracement from the current price level to the Mean Support level of 5601, with the potential for further decline to the Mean Support level of 5525.
Economy
EUR/USD Daily Chart Analysis For Week of May 2, 2025Technical Analysis and Outlook:
The Euro currency has shown weakness in this week's trading session and is resting at the Mean Support designation marked at 1.128. The current trajectory indicates that the Euro is targeted to the downside, with a Mean Support level of 1.119 and an Outert Currency Dip of 1.111. However, it is essential to recognize that upward dead-cat rebounds may re-emerge from the Mean Resistance level or Outer currency Dip.

Bitcoin(BTC/USD) Daily Chart Analysis For Week of May 2, 2025Technical Analysis and Outlook:
Bitcoin prices have significantly exceeded our previously completed Interim Rally 95000, thereby positioning the cryptocurrency to aim for the forthcoming Interim Coin Rally marked at 100000. Nevertheless, current price movements indicate a potential retracement toward the Mean Support level at 94000, with a further possible decline likely toward an additional Mean Support target at 91800. It is imperative to recognize the potential for upward momentum to develop from a retest of either support level, as this could facilitate a trajectory toward the next Interim Coin Rally at $100,000 and beyond.

$JPINTR -BoJ Holds Rates but Cuts GDP Growth Outlook (May/2025)ECONOMICS:JPINTR
May/2025
source: Bank of Japan
-The Bank of Japan (BoJ) kept its key short-term interest rate at 0.5% during its May meeting, in line with expectations.
The unanimous decision came amid growing concerns over the impact of U.S. tariffs.
In its quarterly outlook, the BoJ slashed its FY 2025 GDP growth forecast to 0.5%, from January’s estimate of 1.0%.
The growth outlook for FY 2026 was also lowered to 0.7% from the prior forecast of 1.0%.

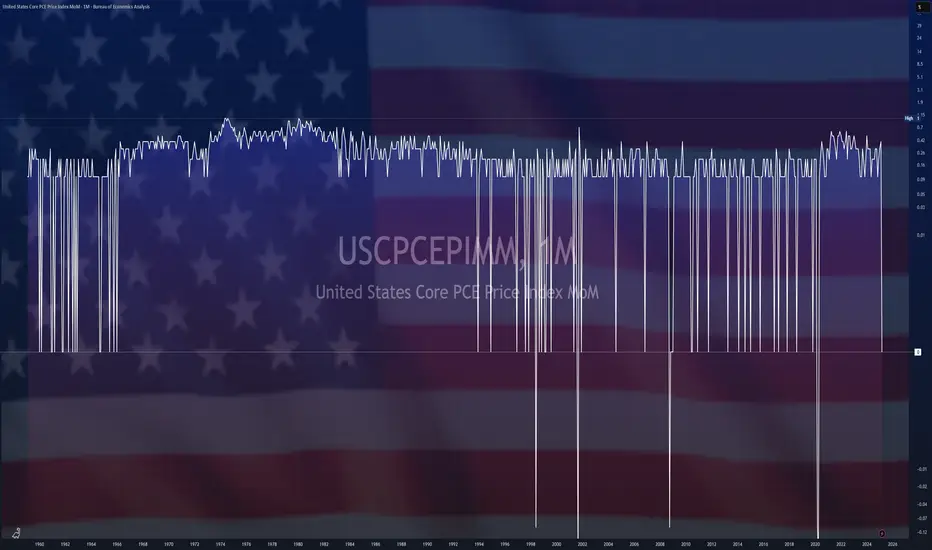
$USPCEPIMC -U.S PCE Inflation Slows as Expected (March/2025)ECONOMICS:USPCEPIMC -U.S PCE Inflation Slows as Expected (March/2025)
ECONOMICS:USPCEPIMC
March/2025
source: U.S. Bureau of Economic Analysis
-The personal consumption expenditure price index in the US was unchanged in March from February 2025, the least in ten months, and following a 0.4% rise in each of the previous two months, in line with expectations.
Prices for goods fell 0.5%, after a 0.2% increase in February and prices for services went up 0.2%, easing from a 0.5% rise.
Meanwhile, the core PCE index, which excludes volatile food and energy prices, was also unchanged, compared with forecasts for a 0.1% increase.
Separately, food prices rose 0.5% (vs a flat reading) while prices for energy goods and services dropped 2.7% (vs 0.1%).
Finally, the annual PCE rate decreased to 2.3%, the lowest in five months, and the annual core PCE inflation also eased to 2.6%.
$USGDPQQ -U.S Economy Unexpectedly Contracts in Q1/2025ECONOMICS:USGDPQQ
Q1/2025
source: U.S. Bureau of Economic Analysis
-U.S economy shrank 0.3% in Q1 2025, the first contraction since Q1 2022,
versus 2.4% growth in Q4 and expectations of 0.3% expansion, as rising trade tensions weighed on the economy.
Net exports cut nearly 5 percentage points from GDP as imports jumped over 40%. Consumer spending rose just 1.8%,
the weakest since mid-2023, while federal government outlays fell 5.1%, the most since Q1 2022.

Weekly Price Action: S&P500 Emini Futures ES1! Tuesday 4/29/2025In this video, we will be looking into the potential price action ES1!.

Weekly Price Action: Dow Jones DJI Tuesday 4/29/2025In this video, we will be looking into the potential price action DJI.

$CNGRES -China's Gold Reserve (Q4/2024)ECONOMICS:CNGRES
Q4/2024
2.280 Tonnes
source: World Gold Council
- Gold Reserves in China increased to 2279.56 Tonnes in the fourth quarter of 2024 from 2264.32 Tonnes in the third quarter of 2024.
Gold Reserves in China averaged 1216.76 Tonnes from 2000 until 2024,
reaching an all time high of 2279.56 Tonnes in the fourth quarter of 2024 and a record low of 395.01 Tonnes in the second quarter of 2000.

S&P 500 Daily Chart Analysis For Week of April 25, 2025Technical Analysis and Outlook:
In this week's trading session, the Index did steady to higher prices, distancing itself from the rendered obsolete Mean Resistance level of 5455 and targeting the next significant mark identified as Outer Index Rally 5550. This trend lays the groundwork for a continued upward movement; however, there is also a considerable risk of a sharp pullback to the Mean Support level of 5370 after reaching the Outer Index Rally at 5550.
Contrariwise, it is essential to acknowledge the possibility of upward momentum continuation resulting in meeting the primary target Outer Index Rally 5550 by challenging the Mean Resistance of 5672 and extending toward additional levels: Mean Resistance 5778 and Outer Index Rally 5945.

EUR/USD Daily Chart Analysis For Week of April 25, 2025Technical Analysis and Outlook:
In the most recent trading session, the Euro successfully retested the completed Outer Currency Rally level at 1.142 and completed the subsequent target identified within the Outer Currency Rally at 1.157. Consequently, the Euro experienced a firm decline to the Mean Support level of 1.131. However, it is essential to recognize that upward momentum may re-emerge, facilitating a retest of the Key Resistance level at 1.151 or potentially leading to a further decline toward the next support level designated as Mean Support at 1.119.

Bitcoin(BTC/USD) Daily Chart Analysis For Week of April 25, 2025Technical Analysis and Outlook:
Bitcoin experienced a significant rally in this week's trading session, breaking through all identified Mean Resistance levels: 86400, 90600, and 94500. This breakout led to the completion of the Interim Coin Rally at 88400. As a result, the newest identified Interim Coin Rally at 95000 has also been completed, indicating a possible pullback to the Mean Support at 92000 and a further decline potential toward an additional Mean Support target at 88500. However, it's important to recognize the chance of upward momentum emerging from a retest of the completed Interim Coin Rally at 95000, which could advance toward the next Interim Coin Rally at 100000.

Possible H&S Forming – It’s All About the News NowOANDA:XAUUSD
📉 Watching closely: Possible Head and Shoulders formation developing on the 4H and 1H charts
As of April 24, 2025, Gold (XAU/USD) is forming a potential Head and Shoulders pattern on the shorter timeframes (4H and 1H), which could indicate a reversal setup. While multiple scenarios are still in play, the price action around the $3368 level will be crucial.
If price fails to break above this resistance in the near term, it could suggest weak bullish momentum and open the door for a pullback toward and possibly below the neckline around $3250 .
🔔 Key Economic Events – April 24
08:30 EDT – Durable Goods Orders MoM
Forecast: +2.0%
Personal outlook: Numbers might come in weaker than forecasted.
Durable goods orders are a solid gauge of industrial demand. Weaker-than-expected numbers would likely weaken the USD and could offer some upside pressure on Gold.
10:00 EDT – Existing Home Sales
Forecast: Lower than previous.
As a key barometer of consumer confidence and economic stability, lower-than-expected figures could also put pressure on the USD, potentially providing Gold a short-term bullish impulse.
📊 Potential Scenarios
Scenario 1 – Bullish Breakout
Weak economic data → USD weakens → Gold spikes above $3400
If both data points disappoint, we could see a rally in Gold, possibly breaking the resistance and invalidating the H&S pattern.
Scenario 2 – Bearish Breakdown (Preferred H&S Scenario)
Strong data → USD strengthens → Gold falls below $3200
While less likely, if economic data comes in stronger than forecasted, Gold could see a significant drop, forming the right shoulder and breaking the neckline – confirming the Head & Shoulders reversal.
Scenario 3 – Sideways Movement
Neutral data + Tariff talks in focus
In the absence of impactful data or if figures come in as expected, Gold might consolidate sideways. Ongoing developments around US-China tariff negotiations could dominate sentiment, delaying or nullifying the H&S pattern entirely.
📉 Market Sentiment Snapshot
US stocks are rallying on optimism around tariff reductions
Trump administration signaling potential easing of China tariffs
➡️ Gold under pressure as risk-on sentiment rises
📍 Conclusion
Keep an eye on the $3368 level and $3250 neckline. Short-term moves will likely be dictated by today’s economic releases and the evolving trade narrative. A confirmed break below the neckline would validate the bearish H&S scenario with potential downside toward $3200 and below.
👉 Stay nimble and trade the reaction, not just the forecast.
-------------------------------------------------------------------------
This is just my personal market idea and not financial advice! 📢 Trading gold and other financial instruments carries risks – only invest what you can afford to lose. Always do your own analysis, use solid risk management, and trade responsibly.
Good luck and safe trading! 🚀📊

S&P 500 Daily Chart Analysis For Week of April 17, 2025Technical Analysis and Outlook:
In the recent shortened trading session, the Index recorded steady to lower prices, distancing itself from the Mean Resistance level of 5455, as indicated in the previous week's Daily Chart analysis. This trend establishes a foundation for continuing the downward trajectory, targeting the Mean Support level 5140. Should this downward momentum persist, further declines may extend to the next Mean Support level of 4970 and ultimately reach the completed Outer Index Dip at 4890.
Conversely, it is essential to acknowledge the possibility of upward momentum at the current price level, which may challenge the Mean Resistance of 5455 and extend toward the Outer Index Rally at 5550.

EUR/USD Daily Chart Analysis For Week of April 18, 2025Technical Analysis and Outlook:
During the current trading session, the Euro has demonstrated a successful pullback to the anticipated support level of 1.128, from which upward momentum has emerged. Consequently, the currency is positioned to retest the previously completed Outer Currency Rally level of 1.142, potentially advancing towards the subsequent target marked next Outer Currency Rally at 1.159. However, it is essential to recognize that there is a possibility of downward momentum re-emerging should the Euro challenge the completed resistance at 1.142 or the forthcoming target of 1.159.

Bitcoin(BTC/USD) Daily Chart Analysis For Week of April 18, 2025Technical Analysis and Outlook:
During the price movements observed throughout the week, Bitcoin has remained close to the previous Mean Support level of 85200 and appears poised to initiate an upward breakout, targeting the newly developed Mean Resistance level of 86400. This breakout may facilitate a retest of the completed Interim Coin rally at 88400, with additional expansions of targets also being a possibility. It is critical to acknowledge that potential for downward momentum may arise from a rechallenge of either the Interim Coin Rally at 88400 or the Mean Resistance at 86400.

WILL THE S&P 500 COME CRASHING DOWN? TRIPLE RSI DIVERGENCE?!S&P 500 (SPX) Is considered to be one of the primary benchmarks for the U.S economy. Recently it appears to be showing a triple bearish RSI divergence, DMI indicating bearish with ADX above 20, and a bearish MACD on the 1 Month chart. The technical analysis seems to have a highly bearish hypothesis in my opinion. If we give some thought to Ray Dalio's Principles for Dealing with the Changing World Order , some haunting indicators appear to be forming. Could this just be a minor correction? Or is this the beginning of an extended economic downturn?
Disclaimer: Not financial advice.

$EUINTR - ECB Lowers Interest Rates by 25bps (April/2025)ECONOMICS:EUINTR - ECB Lowers Interest Rates by 25bps (April/2025)
ECONOMICS:EUINTR
April/2025
source: European Central Bank
- The European Central Bank lowered interest rates by 25 basis points on Thursday, as expected, marking the sixth consecutive cut since June and bringing the key deposit rate down to 2.25%.
Policymakers noted that the disinflation process is progressing well and dropped previous references to a "restrictive" policy stance, while cautioning that the growth outlook has worsened amid escalating trade tensions.

$GBIRYY - U.K CPI (March/2025)ECONOMICS:GBIRYY 2.6%
March/2025
source: Office for National Statistics
- The annual inflation rate in the UK slowed to 2.6% in March 2025 from 2.8% in February and below market and the BoE's forecasts of 2.7%.
The largest downward contributions came from recreation and culture (2.4% vs 3.4%), mainly games, toys and hobbies (-4.2%) and data processing equipment (-5.1%). Transport also contributed to the slowdown (1.2% vs 1.8%), largely due to a 5.3% fall in motor fuel prices.
In addition, prices rose less for restaurants and hotels (3%, the lowest since July 2021 vs 3.4%), mostly accommodation services (-0.6%); housing and utilities (1.8% vs 1.9%); and food and non-alcoholic beverages (3% vs 3.3%).
In contrast, the most significant upward contribution came from clothing and footwear (1.1% vs -0.6%), with prices usually rising in March as spring fashions continue to enter the shops.
Compared to the previous month, the CPI edged up 0.3%, slightly below both the previous month’s increase and expectations of 0.4%.
Annual core inflation slowed to 3.4% from 3.5%.

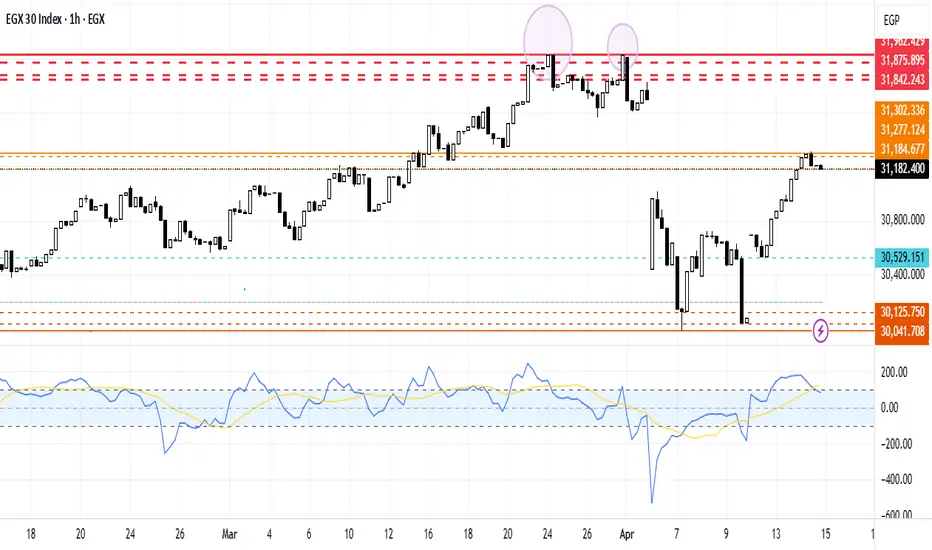
The Effect of US Tariff Exemptions on EGX30.EGX30 stock stabilized in a consolidation zone, failing to breach the 29991 support line. Despite breaking the 30041 support line to the downside, it corrected its upward trajectory between the 30529 support line and the 31302 resistance line, reflecting the bulls' dominance over the bears. This is because Egypt agreed to work towards a package of $7.5 billion in direct Qatari investments, according to a joint statement released by the Egyptian president's office on Monday. In addition, Egypt is pushing ahead with efforts to secure funding from Gulf neighbors and foreign partners as it seeks to tackle heavy foreign debts and a gaping budget deficit.
Price Action: S&P500 SPX Monday 4/14/2025In this video, we are looking at the S&P500 Index and its potential movement on the Daily Chart for Monday 4/14/2025.

SPX Fractal Expansion: New Highs Ahead Despite FearAs of April 14, 2025, the CBOE:SPX is exhibiting a clear fractal expansion, suggesting the beginning of a new bullish leg. The recent correction, which caused widespread panic, appears to have completed a fractal cycle reset, with price respecting historical support near 4704 and forming a new fractal edge around 5300.
Despite the fear-driven selloff, momentum indicators like RSI and MACD show signs of bottoming, and volume surged on rebound days, confirming strong institutional buying. The price is now testing temporary resistance at 5878, with a path open to reclaim all-time highs (6100+).
Global & Technical Tailwinds
Technical momentum is recovering across timeframes, with positive divergence on stochastic oscillators.
Breadth is improving: More stocks are participating in the rally, reflecting internal strength.
Sentiment has flipped: The VIX has cooled from panic levels (above 45), and investor fear is easing.
Macro support: Inflation is declining, and central banks are signaling potential rate cuts by late 2025.
Earnings outlook remains solid, and analysts forecast SPX to end 2025 around 6500–7100.
🔍Conclusion
The SPX is carving out a fractal mirror of past bullish reversals, reinforced by strong macro and technical context. Barring unexpected shocks, the index is likely to break above resistance and push toward new highs, even as residual fear lingers. The setup favors buying dips within this emerging structure.

S&P 500 Daily Chart Analysis For Week of April 11, 2025Technical Analysis and Outlook:
During the current trading session, the Index has recorded lower opening prices, thereby completing our key Outer Index Dip levels at 5026 and 4893, as previously highlighted in last week's Daily Chart analysis. This development establishes a foundation for a continuous upward trend, targeting the Outer Index Rally at 5550, with an interim resistance identified at 5455. Should this upward momentum persist, further extension may reach the subsequent resistance levels of 5672 and 5778, respectively. However, it is essential to note that a downward momentum may occur at the very significant completion target level of the Outer Index Rally at 5550, with the primary objective being a Mean Sup 5140 and retest of the completed Outer Index Dip at 4890.
