Amazon EarningsAmazon likely sees a continuation move into the multi factor resistance white trendlines.
If it reaches that level it will likely encounter some sell pressure.
Economy

DJT....Have we seen this before?Similar pattern appearing on the DJT.
Will we see the upside move completed or will it fail like it did in 2018/2019.

Bitcoin & Consumer Confidence Index by University of Michigan⚫️Update:
US Consumer Confidence Index by University of Michigan⚫️
Index with a bear channel breakout on the way up - needs to be confirmed above 65.2 dear Bitcoin and Crypto Nation 🚨🚨🚨
Exciting to see if a BTC🟠 #bullish run begins afterwards
Let me know your thoughts in the comments🤗
⬇️⬇️⬇️
Likes and Follow for updates appreciated🤗
Disclaimer:
Not financial advice
Do your own research before investing
The content shared is for educational purposes only and is my personal opinion

How to Reduce Inflation in South Africa in 2023! - 5 WAYS!How to Reduce Inflation in South Africa in 2023! - 5 WAYS!
I got this excellent question today from someone Which I thought was an important question to answer considering the state of the Country of South Africa.
Hi everyone. In SA I always wonder how an ordinary person "employed or not" can contribute to bring positive change to our inflation?
A. Here is my answer...
As an economist, I can say in theory it is possible to bring positive change to the inflation rates but in reality – with corruption – I’m not sure it’s that easy.
Also, it’s the butterfly effect where we need to come together as a community (country) to work towards lowering inflation.
So on the one hand, there needs to be less spending unfortunately. Here are a few measures I can think of…
#1. Lower non-essential spending.
People need to stop spending unnecessarily on products and services and instead start saving more for their future. This will hamper and reduce the impact of inflation.
#2: Support your local places!
This world is becoming highly globalised not only where the rich get richer but the TOP stores and shops get richer too.
As a community, we need to start supporting the local businesses that have great quality products and services to.
We need to be more friendly to each other and help spread awareness to the small but great man.
This will help stimulate the local economy and bring on more job creation and economic growth.
#3: More investments in education
Education is key to help bring personal development and skills training. We need to educate our fellow people on business skills, high income skills, programming, AI, machine learning, savings, risk averse investments and encourage more businesses to help grow.
#4: Save more to invest more
When inflation is high it means people were spending uncontrollably which pushed up demand and lowered supply. Instead, we should encourage more savings in stocks, property, trading, funds, and personal finances to reduce the effects of inflation.
Instead of drinking sorrows away, spending on games to bide time – focus on less spending and more saving for the future – reducing the debt levels.
#5: Invest in renewable energy
Load Shedding is here to stay. And so we need to try to support more renewable energy initiatives that come about. Solar, wind and gas. This will definitely help reduce the cost of energy and curb inflation.
As I said, we can only do our part and hope for the best. We are a nation with hope, optimism and trust. But instead of just trusting the government we should also learn to support and trust our local businesses and methods to living a better life.
Hope that helps.

A major bull trap has been set.The current level of euphoria and speculation on Wall Street is likely to go down in history in the same way that the misplaced optimism of speculators in 1929 was immortalized by the tremendous crash and ensuing depression. The current dynamics at play are more similar to that period than most realize.
Many potential catalysts for the Global Financial Crisis 2.0 are beginning to rear their heads, including things such as:
-The auto loan bubble
-The residential & commercial real estate bubble
-The private equity and venture capital bubble
-The largest losses in the total bond market in generations
-Highest level of Federal Debt to GDP in US history and extremely high level of consumer & corporate debt in US history
-The most overvalued market based on forward earnings in history (Based on my expectations of S&P 2023 earnings will fall below 140). Peak margins above -13% coming back under 10% will also help to drive this.
-The fastest pace of interest rate hikes since Paul Volcker and $90 billion of quantitative tightening per month.
-The crypto bubble implosion where many exchanges are likely to fail due to their ponzi-like staking dynamics and unprofitable nature of exchanges like Coinbase. We are starting to see the beginnings of the financial contagion from FTX into other exchanges and coins. This is happening in an industry valued at over $3 trillion at its peak.
-The Chinese real estate crisis and recession
-The energy crisis which has curtailed over 20% of EU industrial capacity and is sending Europe into a recession. This is leading to increased energy costs around the world.
-Looming sovereign debt crises & currency crises for emerging and certain developed economies.
- Monetary growth is contracting at the highest pace since the Great Depression.
The $1.6 trillion auto loan bubble is reminiscent of the subprime lending bubble. There were incredibly loose lending standards in this auto loan bubble, where people that received federal stimulus checks were able to claim these as income. This entitled them to larger sized loans than they would have otherwise had access too. Many of these loans were made at over 130% loan to value ratio. These loans have been packaged up as bonds and sold off to investors hungry in search for yield in a world of artificially low interest rates, suppressed by the Fed for the better part of 14 years since the Global Financial Crisis. The amount of delinquent auto loans has continued to increase, and the looming crisis represents a huge threat to financial stability. As real wages and employment continue to fall, the amount of delinquent loans will continue to rise.
Earnings for the S&P 500 in Q3 have already started to contract more than 5% year over year (excluding energy) and yet many analysts still expect some, to no growth of earnings in 2023. Earnings are likely to collapse over 40% in 2023, pressured by falling consumer demand and falling operating margins. Consumer sentiment registered the worst sentiment among US consumers since the great depression.
All of the Fed manufacturing and service data components show comparable data now to data being released in mid 2008 to the spring of 2009, all with continuously negative trends. Capital expenditures have begun decreasing and mass layoffs are just beginning. 37% of US small businesses could not pay their rent in full in October. Many companies will be forced to close their doors permanently and layoff their entire staff. Consumption began to fall rapidly after the Fed began quantitative tightening and ended quantitative easing. The effects finally began hitting company earnings largely in Q3, with much more pain to follow. Meanwhile, many companies continued to hire large amounts of people unaware that consumption would continue to collapse. As asset prices fall further and inflation stays elevated, real wages will continue falling.
Student loan payments begin again at the start of 2023, further harming consumer sentiment.
Money supply growth began stagnating early in the year in 1929 and the federal government began to tighten spending with the New Deal programs in 1936 before the crash happened in 1937. Bank balance sheets have been flat for 2022 while the central bank balance sheet has been contracting leading to a slight contraction in the money supply. The contracting growth of monetary supply and fast paced increases in interest rates will lead to a large-scale downturn in GDP. On a technical basis, the current market setup looks very similar to 1929, 1937, 1973-1974, 1987, and 2008. All of which had major rallies that topped in late summer / fall before crashing over 30%. All of these crashes took place over the span of less than 3 months, with the majority of the percentage decline occurring over a period of 2-3 weeks.
There are dozens of companies that are virtually guaranteed to go bust in this downturn based on an overview of their financials. There have never been so many listed companies that reached valuations in the billions at their peak with no earnings . Many companies at the time of this writing still have valuations of over 6 times sales and many companies such as Coinbase, Uber, and Rivian are still valued at over $10 billion market caps whilst losing hundreds of millions of dollars per quarter. The dozens of zombie companies in the S&P 500 are being forced into rolling their debts at higher interest rates while their earnings fall. This will be the largest debt deleveraging cycle in the US economy since the great depression, because this is the largest accumulation of bad debts since the roaring twenties.
It is not long until the credit risk is truly realized by market participants, and interest rates spike throughout the economy. This would include the inter-bank lending rate and junk rated bonds which would lead to a financial crisis. The longer the Fed’s quantitative tightening runs, the more inevitable the financial crisis becomes. The Fed ran the balance sheet down around $600 billion over the course of 2018 into late summer of 2019 before inter-bank lending rates started to spike. This time, the Fed has run the balance sheet down close to $300 billion so far with a plan of reaching over a $600 billion runoff in Q1 of 2023.
The hopes for a Fed pivot are misplaced. A Fed pivot on interest rate hikes and even a reversal of the rate hikes cannot re-incentivize people to borrow . In a contracting credit cycle and business cycle downturn, debt begins to be paid off and defaulted on rather than excessively accumulated. The demand to borrow collapses even if interest rates were lowered by the Fed. Therefore, bear markets and recessions usually don’t end until many months after the Fed has already begun cutting interest rates. This was seen in the Great Recession and the dot com bubble of 2000; where the market didn’t bottom until over 18 months after the Fed began cutting rates.

Copper is Screaming! Are you listening?Why is Copper so important to track and what can we learn from studying its price action. Copper simply put is the most used base metal in the world and really powers every aspect of world. Doctor Copper is telling us something.
Copper has had an impeccable rally of the lows, this has been confirmed with the major rally in copper mining stocks.
In this chart we have overlayed the inflation rate in orange with the price action in copper.
The inflation rate has a delayed reaction based off of the price action in Copper.
What we can observe recently is the price of copper topping 112 days before the inflation rate. Copper had a significant decline which was followed by a decline in peak inflation.
Over the last 148 days, Copper has rallied 38%. Could this mean that we are about to see a delayed spike in the inflation reading?

S&P 500 Daily Chart Analysis For Week of January 27, 2023Technical Analysis and Outlook
Spooz continuously displays a bullish influence on the current market sentiment, with the upside trend hitting our targets Mean Res 4085 and continuous driving momentum to Outer Index Rally 4140. The pullbacks with this ongoing rally are expected to target Mean Sup 4015 and possibly extension to Mean Sup 3970.

EUR/USD Daily Chart Analysis For Week of January 27, 2023Technical Analysis and Outlook:
The currency pivoted about our newly created Key Res 1.091 and is heading down to Mean Sup 1.078 with possible additional buster energy to Mean Sup 1.070 before reigniting upward action to the Outer Currency Rally $1.110 in the near future.

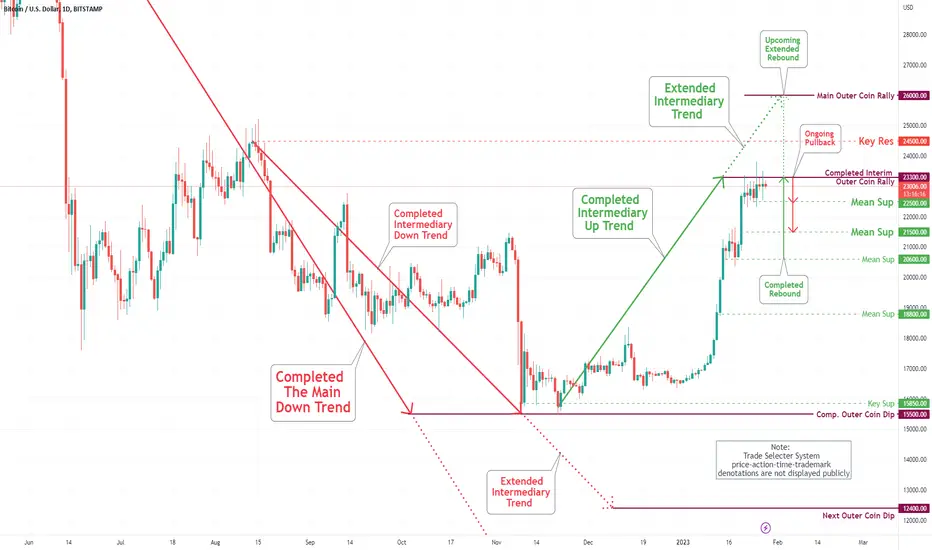
Bitcoin (BTC/USD) Daily Chart Analysis For Week of Jan 27, 2023Technical Analysis and Outlook:
The coin hoovered under our completed with conformation Outer Coin Rally of $23,300 throughout the week - expect a pullback to the newly created Mean Sup $22,500 and, as a bonus, Mean Sup $21,500. Once this puppy flushes out weak-longs, resumption to retest the Outer Coin Rally of $23,300 and $26,000 is inevitable.

Ecopetrol possible SHORTEcopetrol will limite his exploration and production cause "Energetic Transition".

PERSONAL SAVING RATE RUNNING ON EMPTYThis chart shows that personal saving is at the lowest in US Record . TIC TIC TIC BOOM NO SAVINGS RECORD HIGH RATES ON CREDIT CARD . AND CONSUMER SPENDING AT A RECORD HIGH . . ONCE UNEMPLOYMENT TICKS UP I WANT TO PUT THIS OUT THERE THEREIS ONLY TWO THINGS THAT CAN HAPPEN 1 PUT CASH DIRECT INTO THE ACCOUNT =INFLATION OR CONSUMER CREDIT DEFAULTS START Auto repossessions at a rate of 15,000 a month . or a 3th way debt forgiveness, The MACRO Picture over the next 18months, is NOT good Civil Unrest , homelessness.

SPY retraceAs you take a look at the chart the retrace to the MAs and BB mid, as well as fib retrace. The lower high and support levels add up. Maybe not this week but definitely soon.

The end of the bear marketSPX has been in an descending broadening triangle, which is generally seen as a bullish pattern. Now that the S&P has pivoted off a double bottom, and had a gap up, which generally confirms a trend, there is enormous upside on the S&P 500. This is in addition to CPI dropping yesterday, which shows that the FED can finally pivot, giving stocks a massive upside.
I'm trading this by going long on undervalued stocks in the s&p500

Dollar gain strength again SA randUSDZAR gained momentum in pushing to the upside since South africa had a negative impact on the economy due to the poper supply issue. We our first price target from last week was that price would hit 17.50 but now that it has made multiple breakout on certain levels we looking forward for the price to head around 17.70.
We see a very clear price has reached the RS ZONE on 1H TM and 4H TM.
We take longs just after few countable minutes from market open.
Most preferable time will be 01h15 am +2 GTM Johannesburg time zone.

S&P can drop to 3,194 and make relative sense Considering the 2020 low, in log format, that draws back all the way to the 2009 lol, it would make relative sense for the S&P to still drop another 17.5%.. unfortunately

Imagine there's a bottom in my mind.Hello and nice Sunday.
Today, I am delivering chart on 4 hour candles on Log scale.
This chart is same as previous, with light re-edit to better fit.
We can confirm, previous chart is playing nice to these days.
While some upside is possible, I won't trying to catch next 5%, if downside risk is much bigger.
...And 3 million Bitcoins was actually shorted around 20500 USD area. I thought, it will be temporary surpassed and leading to red ring test. On local Fibo is 618 , with target at 382 retracement.
In my chart we can see also 21 Weekly MA and it will be tested for support which won't hold too long. Probably break down in panic sells..
That is sign of BTC is at "Anger" phase of bear market, based on Wall Street cheat sheet.
Pros is maybe my personal buy zone would be very near and even real bottom area. There is green ring and long-term yearly rising support (blue line).
I can't say this chart will play out perfectly, especially if some sideways extends timing. However this is what I believe and I always try to stick to my opinions.
Always with care and ready,
Emvo.
*This is not any financial advice.
S&P 500 Daily Chart Analysis For Week of January 20, 2023Technical Analysis and Outlook
The upside target to the Mean Res 4820 was targeted within a mid-week, with the hasty pullback to our designated Men Sup 3950 and 3890. The index continuously displays a bullish influence on the current market sentiment with upside replication of targets to Mean Res 4020. Key Res 4085 and Outer Index Rally 4140. The pullbacks with this upcoming major rally are to be expected.

EUR/USD Daily Chart Analysis For Week of January 20, 2023The euro-dollar continuously stayed close to our newly created Key Res $1.086 this week and displaying a solid movement towards Outer Currency Rally $1.110 as specified in EUR/USD Daily Chart Analysis for December 30. However, be aware that this puppy is prone to breaking downwards to Mean Sup $1.078 and possibly $1.070 to reignite upward action Outer Currency Rally $1.110.

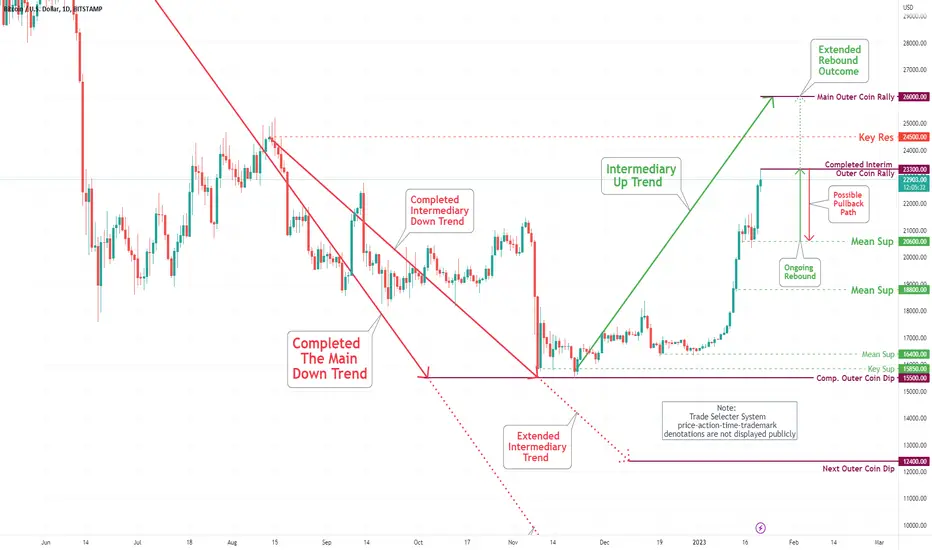
Bitcoin (BTC/USD) Daily Chart Analysis For Week of Jan 20, 2023Technical Analysis and Outlook:
Bitcoin completed the Outer Coin Rally of $21,200 and Key Res $ 21,300 on January 14 and stayed very near the outcome throughout the week - busting through on Friday with follow-through on Saturday to complete the interim Outer Coin Rally of $23,000 (Not shown 60 min chart). The pending confirmation is in the process - Once confirmed, the pullback to Mean Sup $20,600 is inevitable. Once this puppy settles down, we will see a resurgence on the upside to finalize the Outer Coin Rally of $26,000.
BTC dont be trappedBitcoin what a sadly community everybody think some magical person is gonna buy BTC all the way up to a new high.
don't be fooled by it zoom out and take a look at the bigger picture BTC has been following orderflow for years and will again follow the orderflow before a new high

Two hidden problems with the recent mega-cap tech layoffs Disclaimer: I have never worked in investment banking in any capacity, and the following ideas are merely my speculations
Current Macroeconomic and Technical Context
Inflation and interest rate hikes cooling down are common knowledge. As such, the market has become more bullish over the past weeks, creating rounded support and strong support on the NASDAQ around the 0.618 Fibonacci retracement level. There have also been rallies across tech companies, like meta, unity, grab, and para from their lows. However, now the NASDAQ has formed a descending triangle and so it remains possible that there will be a sharp breakdown through support.
Why mega-cap tech rallied off layoffs
Massive layoffs have occurred in mega-capitalization tech firms in recent months to respond to the current recessionary economic environment, with firms like Google, Microsoft, Amazon, and other tech companies laying off more than 70,000 employees in the last year. Under the typical theory of firm economics, this is efficient behavior for the firm, decreasing variable costs to respond to reduced demand for products, thereby increasing profits for shareholders.
Problems which some have not considered
There are two important problems with the layoffs, which are summarized as:
Firing tech employees results in unfinished projects and unpatched bugs
Former employees may need to sell their shares to cover living expenses
Firstly, unlike in a factory, or place where a smaller of employees is a feasible solution to cutting costs, these technology companies are not small and are instead mega-capitalization companies, they have thousands of employees working on projects and addressing security issues. Logically, the remaining employees can't easily take over the role of the thousands of fired employees, so there will be less work done to maintain the systems, and the big projects which fired employees were working on are likely to be abandoned or take a long transition time, meaning there will be a slower rate of growth for tech companies. This issue of losing valuable employees was shown most clearly with Twitter, which almost immediately started losing functionality after it had layoffs, and even needed to rehire employees.
Secondly, it is well-known that the retail investors who put their money in stocks are mostly individuals with high salaries, since they have the money to put into stocks without worrying about expenses in the short term. It is also well known that tech employees in the USA have an incredibly high average salary, averaging above six figures in 2021, according to SHRM. For these tech investors, who are now no longer employed, many of whom are living in costly areas of the United States like Washington, California, or New York, they no longer have the income to put into purchasing stocks, and rather they may have to sell off their shares to cover their high costs of living. In other words, tech layoffs are likely to cause a significant drag on the stock market in the coming months caused by a decrease in income investment and increased selling pressure.

Bitcoin and the Philly Fed Manufacturing Indexive 🔴☑️⭐️🟢Update
Bitcoin and the Philly Fed Manufacturing Index
possible bullish scenario when...
1. Index is negative🔴☑️
2. Index breaks trendline⭐️
3. enjoy the BTC bull run🟢
Today bad value -13.8⬆️more patience necessary🚨
Let me know your thoughts in the comments🤗
⬇️⬇️⬇️
Likes and Follow for updates appreciated🤗
Disclaimer:
Not financial advice
Do your own research before investing
The content shared is for educational purposes only and is my personal opinion
