Bitcoin (BTC/USD) Daily Chart Analysis For Week of Nov 25, 2022Technical Analysis and Outlook:
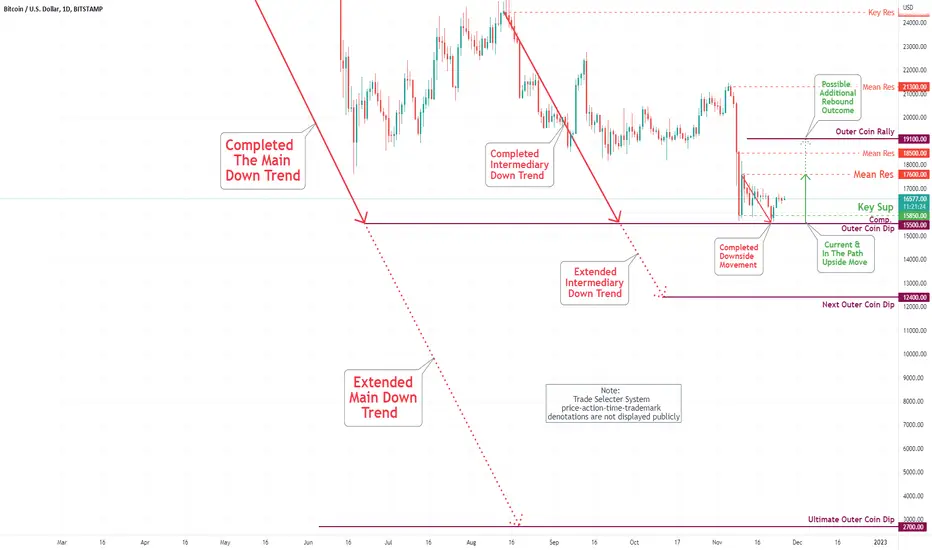
Bitcoin has repeated bounce from our Key Sup $15,850 on Nov 21. The coin is currently positioned to punch to the Mean Res $17,600 and subsequently to Outer Coin Rally $19,100. The down-trend projects for the next Outer Coin Dip of $12,400 in the foreseeable future are being delayed.
Economy
What are new-home sales and why do they matter to the economy?Upcoming week we have two important major events happening for the U.S , one of them is the new-home sales. But what exactly are new-home sales, and why do they matter? In this post, we'll break down what new-home sales are and explain why they're so important to the overall health of the economy. You also be more prepared and informed why the market moved in a certain way. Lets move on...
What are new-home sales and why do they matter to the economy?
New-home sales are a measure of trading activity in the market for newly built homes. The new-home sales data are important leading indicators of economic activity, providing timely information on changes in the demand for new homes, which directly affects decisions regarding investment, production, and employment. The data on new-home sales also provide valuable information on the market fundamentals that are shaping trading conditions in the market for newly built homes. The data can be used to inform decision-making about pricing, product mix, and other strategic considerations. In addition, the data can be used to assess market conditions and identify emerging trends. As such, new-home sales data are an important tool for monitoring and understanding the health of the economy.
See historical graph here:
fred.stlouisfed.org
Impact of new-home sales
When new-home sales activity levels rise, it has a positive impact on the economy as a whole. For consumers, this increased activity level leads to currency being put back into circulation. When builders see an increase in new-home sales, they are able to reinvest that currency into building more homes, which in turn provides more jobs for other industry players. The increased activity also has a positive impact on the stock market and it's currency, as builders and other companies who stocks are traded publicly see their stock prices increase. This provides more stability in the markets and can lead to more investors feeling confident about putting their money into the markets. Ultimately, when new-home sales activity levels increase, it provides a boost to the economy as a whole.
New-home sales are an important economic indicator because they signal overall consumer confidence and spending. Increased new-home sales activity levels have a ripple effect throughout the economy, benefiting consumers, builders, and other industry players. We shall see what impact the new-home sales will have this week on EURUSD.
We can currently see we are stuck in a range between support and resistance - let's see what the week will bring.
Trade safe around these hours! Cheers.

Bitcoin in connection to Home Sales 🚨🚨Update:
Bitcoin in connection to Home Sales
We just saw a channel break dear Crypto Nation - last time seen at Corona sell-off🚨🚨
If Home Sales find the way back into the channel BTC might recover as well
Let me know your thoughts in the comments🤗
⬇️⬇️⬇️
Likes and Follow for updates appreciated🤗
Disclaimer:
Not financial advice
Do your own research before investing
The content shared is for educational purposes only and is my personal opinion

S&P 500 Daily Chart Analysis For Week of November 18, 2022Technical Analysis and Outlook
Outer Index Rally 4060's upside target (As shown on Chart Analysis For the Week of November 11) is currently in progress along with potential #2 Outer Index Rally 4140; however, the newly created Mean Res 3995 is in the interim a roadblock. The downside selected target to Mean Sup 3915 is very high once the completion(s) is triggered, with the possibility of extension to Mean Sup 3745 and beyond - in the foreseeable future.

EUR/USD Daily Chart Analysis For Week of November 18, 2022Technical Analysis and Outlook:
Following the strong Eurodollar rebound the previous week, the currency
completed our designated target of the Inner Currency Rally 1.038 this week, as specified on the EUR/USD Daily Chart Analysis For November 11 chart. Since completing the target, the Eurodollar is in retreat mode to Mean Sup 1.0285, potentially followed to a completed Inner Currency Rally of 1.038 retests one more time.
The prevailing down move is prone to pull back to our additional Mean Sup 1.014, 1.000, and 0.975. The down-trend projects for the Next Outer Currency Dip of 0.937 for the foreseeable future is being reignited.

Bitcoin (BTC/USD) Daily Chart Analysis For Week of Nov 18, 2022Technical Analysis and Outlook:
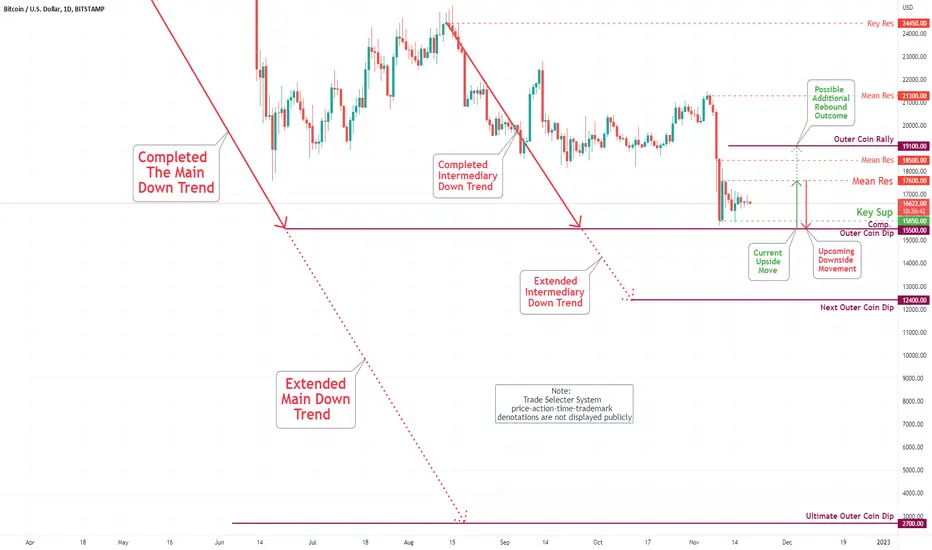
Bitcoin has repeated bounce from our Key Sup $15,850 on Nov 14. The coin is currently positioned itself to hit the Key Sup $15,850 and completed the Outer Coin Dip marked at $15,500, launching sharp upside movement to Mean Res $17,600 and Outer Coin Rally $19,100. The down-trend projects for the next Outer Coin Dip of $12,400 in the foreseeable future is being shelved for now.
Bitcoin and the Philly Fed Manufacturing Indexive 🔴☑️⭐️🟢Bitcoin and the Philly Fed Manufacturing Index
possible bullish scenario when...
1. Index is negative 🔴☑️
2. Index breaks trendline⭐️
3. enjoy the #BTC bull run🟢
Today bad value -19.4 ➡️ more patience necessary🚨
Let me know your thoughts in the comments🤗
⬇️⬇️⬇️
Likes and Follow for updates appreciated🤗
Disclaimer:
Not financial advice
Do your own research before investing
The content shared is for educational purposes only and is my personal opinion

BLUE LINE - Last Support For Crude OilIs this it? Headed into the end of 2023 - are we going to see Crude Oil fall below $76 ppb as COVID & economic concerns trap the global economy into a contraction phase?
My research suggests Crude Oil will attempt to find support near $63 to $65 before attempting to bottom. From current levels, this suggests a -$30 ppb downward price trend is likely.
Two things are likely driving this trend:
Lack of global demand
Inflation/Price concerns
Has the current Flag/Pennant reached the APEX and is price attempting to break downward?
Time will tell...
Follow my research.

S&P 500 Daily Chart Analysis For Week of November 11, 2022Technical Analysis and Outlook
Chart Analysis For the Week of November 4) has been completed, along with two additional rebound stages Mean Res 3900 and Mean Res 3965. Currently, designated upside targets are Outer Index Rally 4060 and 4140, respectively. The downside selected target to Mean Sup 3915 is very high, with the possibility of extension to Mean Sup 3745 and beyond - in the foreseeable future.

EUR/USD Daily Chart Analysis For Week of November 11, 2022Technical Analysis and Outlook:
Eurodollar has rebounded strongly this week since completing our Inner Currency Dip on 26 September - Upcoming target Inner Currency Rally is at 1.038. The prevailing down move is prone to pull back to our Mean Sup 1.000 and beyond in the foreseeable future.

Bitcoin (BTC/USD) Daily Chart Analysis For Week of Nov 11, 2022Technical Analysis and Outlook:
Bitcoin has completed our designated Outer Coin Dip of $15,500, as shown since Bitcoin Daily Chart Analysis For June 17. As a result, a massive rally was staged, creating Mean Res $17,600 launching from Key Sup $15,850 for an upcoming upside move with an additional Outer Coin Rally marked at $19,100. The down-trend projects the next Outer Coin Dip of $12,400 in the foreseeable future.

NDX SPX showing signs of pump coming, very likelyPlease see out $VIX chart right before this
#economy is TRASH
#Fed is not getting #inflation under control nor is raising rates helping
Nothing looks good ANYTIME soon
BUT $NDX looks to be gaining some strength
Can we get a 2k+ pump on #NDX into the end of the year and THEN.......
$SPX shows SIMILAR possibility
#stocks

S&P 500 Daily Chart Analysis For Week of November 4, 2022Technical Analysis and Outlook
The upside target marked at 3975 has been partially completed—the newly created Mean Res 3805 is currently designated as the primary target. Mean Res 3900, Mean Res 3955, and Outer Index Rally 3975 are in the making. Downside target designated to Mean Sup 3715 is very high, with the possibility of extension to Mean Sup 3665 and beyond - in the foreseeable future.

EUR/USD Daily Chart Analysis For Week of November 4, 2022Technical Analysis and Outlook:
Eurodollar has completed the retest of our Mean Res 0.9965 - there is a slight possibility of extending this dead-cat rebound to Mean Res 1.0080. The current down move is prone to pull back to our Mean Sup 0.9895 and beyond in the foreseeable future.

Bitcoin (BTC/USD) Daily Chart Analysis For Week of Nov 4, 2022Technical Analysis and Outlook:
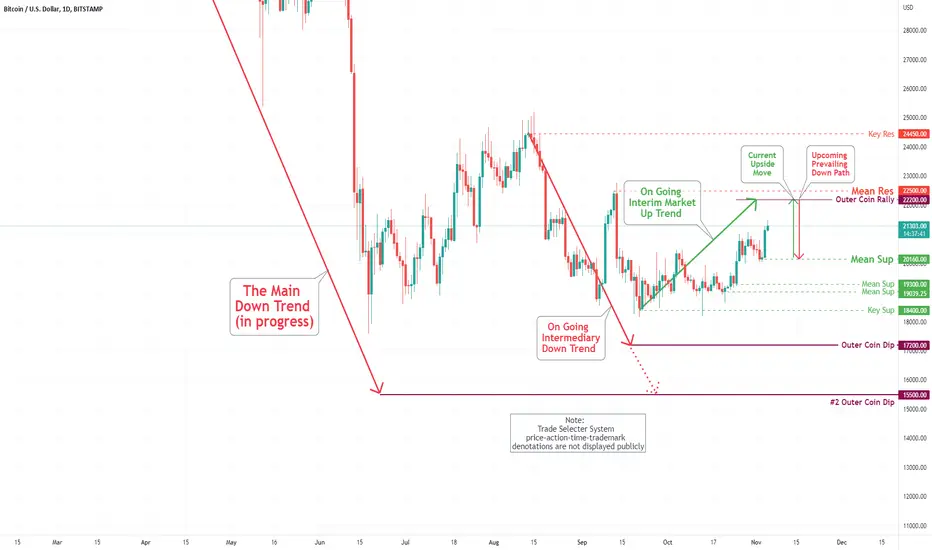
Bitcoin has completed the retest of our Mean Sup $20,300 (As sown on Bitcoin Daily Chart Analysis For the Week of Oct 28) and, as a result, pushed a breakout via Mean Res $20,800 heading towards our designated Outer Coin Rally $22,200 and Mean Res $22,500. The down path shows us a retracement to Mean Sup $21,160 and beyond in the foreseeable future.
NFP 261K is mid!
2016-2017 NFP Average = 168k (Trump Era)
2017-2018 NFP Average = 198k
2018-2019 NFP Average = 164k
2019-2020 NFP Average = -796k (COVID-19)
2020-2021 NFP Average = 474k (Biden Era)
2021-2022 NFP Average = 410k
There was a time when 261k would have been outstanding, but following on from the big job reset in 2019/2020 the average was above 400k.

Bitcoin could to continue climb to $22kIn this update, I will analyze Bitcoin from H2 timeframe giving me an interesting fact that the price could to continue climb toward $22k.
It's appear that in H4 timeframe look bullish in this run.
Meanwhile, in Daily timeframe, Bitcoin forming a possible bearish Gartley Harmonic Pattern, what more later, this look a good opportunity to short in the smart zone. For now, I'm in long toward $22k. Maybe, we could to see any possible bearish channel formation in Daily and this could be a good idea to take in perspective. I'm in long from $20,890 USD, Stop Loss to $20,450 USD and take profit to $22k.
***Based in the fundamental analysis, everything will depend on the next week how far FED will raise interest rate? And any bearish signal that if the FED don't make an aggressive interesting rate indicating pessimistic based the forecast what Jerome Powell has, we could to see a strong data here that Bitcoin and S&P 500 may be bullish in this case to watch in the next week. The U.S. Dollar take risk in the curb of possible recession that some economist said recently and a bad speculation that appear in Forex market to take in perspective with U.S. Dollar.
Good luck!!!

DJI come with me to see this sadly story...The DJI after this mini-bull run makes many people get confused about the economy and, if we are in the bottom of the correction but the things is this movements aren't natural and are made just for make think the people the situation is under control and ¨this gonna be temporary¨ but the reality is this are just the first consequences of 2008/2020 and the massive money print behind of those crisis.
If in FOMC'S meet Powell decides to make an increase on the interest rate higher that the previous (0.75) will confirm the situation is gonna get worse in the market and in the economy in general.

S&P 500 Daily Chart Analysis For Week of October 28, 2022Technical Analysis and Outlook
The upside target marked at 3875 has been completed. Mean Res 3955 and Outer Index Rally 3975 are in the making. Follow-through above targets down move designated to Mean Sup 3805 is very high, with the possibility of the two additional targets - for NOW.

EUR/USD Daily Chart Analysis For Week of October 28, 2022Technical Analysis and Outlook:
Eurodollar has completed a market rebound by producing a high-probability retest marked at Mean Res 1.0080 and 1.0150. The downside move shows Mean Sup 0.9870 as a first stop with follow through three significant down destinations, with a continuation to the next Outer Currency Dip of 0.9370, which is in the making.

Bitcoin (BTC/USD) Daily Chart Analysis For Week of Oct 28, 2022Technical Analysis and Outlook:
Bitcoin has completed a market rebound by producing medium strength Mean Res $20,800 with the continuous outcome mark at Outer Coin Rally of $22,200. The down path shows us a retracement to Mean Sup $20,300 and possibly all the way down to Mean Sup $19,300.

S&P 500 Daily Chart Analysis For Week of October 21, 2022Technical Analysis and Outlook
Currently, in the S&P 500 market, we have tremendous volatility both ways . . . traders/investors are losing both ways. The longs get stopped on the downside, and the shorts get stopped on the upside. What we got is that the whole floor gives way. Pay attention to the critical data presented here.
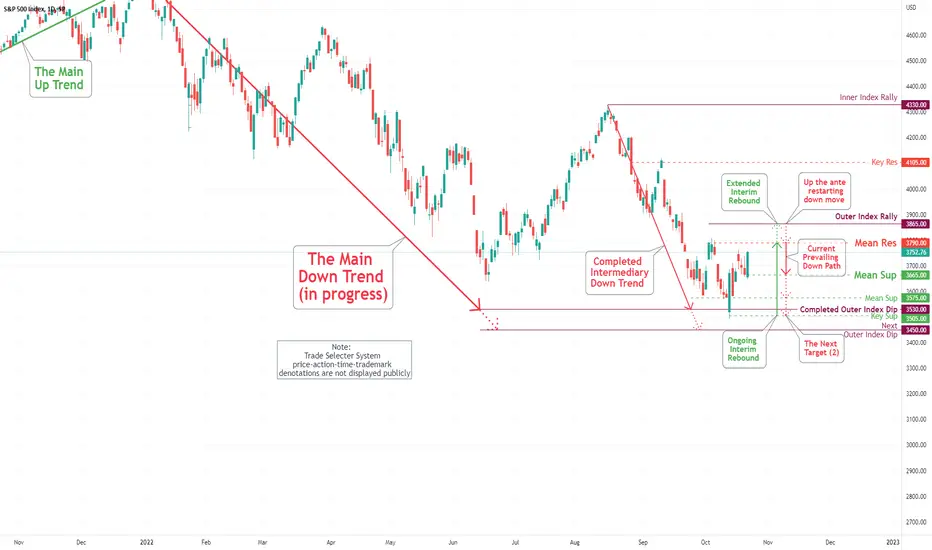
The upside target is marked at Mean Res 3790 and Outer Index Rally 3865. The downside destination is the retest of the Mean Sup 3665: Followed by the Mean Sup 3575, a retest of the completed Outer Index Dip 3530, and Key Sup 3505. Continuation to the next Outer Index Dip of 3450 is in the making.
EUR/USD Daily Chart Analysis For Week of October 21, 2022Technical Analysis and Outlook:
The Eurodollar bounced swiftly from our Mean Sup 0.9700 and rested at our Mean Res 0.9860; however, retesting the Mean Res 0.9987 and 1.0020 is probable. The significant downside move is a) from the current position, b) From up the ante restarting down move of 1.0020. The main targets continue to be our Key Sup 0.9595 and completed Inner Currency Dip 0.9570. Continuation to the next Outer Currency Dip of 0.9370 is in the making.
